
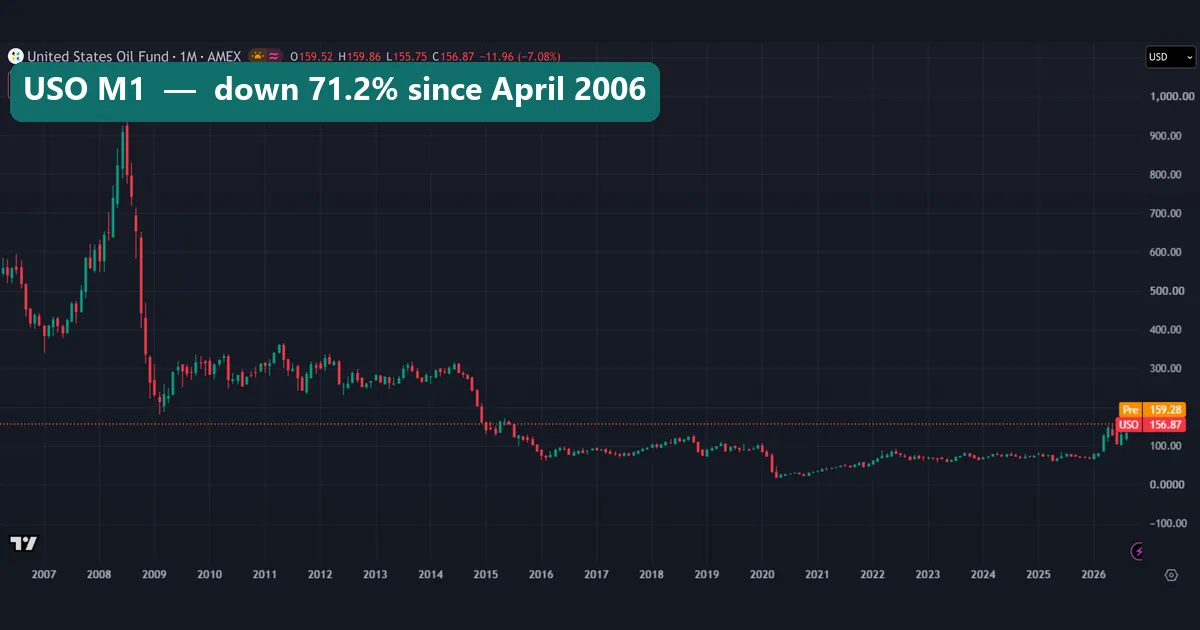
How to invest in oil comes down to one question: what do you end up holding? You cannot buy the oil price itself. Instead, you hold a futures contract, a CFD, a fund share or a stake in energy companies, and each follows oil in its own way. This guide settles how far those routes strayed from the price, using figures we measured up to 2 November 2026. The first chart shows the problem. USO, a well-known oil fund, fell 71.2% from April 2006 while the USOIL price rose 40.0%. This is a survey, not advice, and we name no broker.
What investing in oil actually means
Oil is awkward to own. A barrel needs storage and transport, so investors usually hold a financial claim that refers to a price. Two prices matter most: WTI, the US grade priced at Cushing, Oklahoma, and Brent, the North Sea grade. Our crude oil TradingView guide shows which chart symbol follows which.
TVC:USOIL tracks WTI, but it is a reference series and not something you can buy, as our USOIL guide explains. So every comparison here sets a real product against a line nobody can hold. Also, a barrel pays no income and a futures contract expires. Only energy shares pay dividends, and they bring company risk in exchange.
How to invest in oil: the four routes
Futures. Everything else leans on this market. The CFTC staff report on the NYMEX WTI contract calls it the central benchmark for US crude. Each contract covers 1,000 barrels, priced in US dollars, with delivery at Cushing. So you must exit or roll before expiry: the BIS Bulletin on futures-based commodity ETFs says buyers of physically settled contracts cannot avoid delivery. Brent futures, it adds, settle in cash.
CFDs. Here you hold a contract with a provider, who sets the size, the spread and the financing charge. Our guide to CFDs covers those costs and the regulators. We tested no CFD for this article.
Oil funds. USO and BNO trade like shares on NYSE Arca, but they hold futures. The fund does the rolling, so you never face delivery. However, USCF’s risk disclosures for USO and BNO say plainly that USO is “not a proxy for investing in the oil markets”. USO may also use over-the-counter swaps.
Energy stocks and funds. XLE holds companies, not oil. State Street’s XLE fund page says it follows the Energy Select Sector Index, the energy slice of the S&P 500. Our page on how indices work covers the idea. On 2 November 2026 the fund held 24.32% in ExxonMobil and 18.46% in Chevron. So you own two large businesses first and an oil price second.
How an oil fund works: the roll and the formula
A fund such as USO holds a near futures contract. That contract expires every month, so the fund sells it as expiry approaches and buys the next one. Traders call this the roll. USCF states the daily target like this:
fund's daily % change = benchmark future's daily % change + interest on collateral - expenses
USO only aims to keep its average daily change over 30 valuation days within plus or minus 10% of the benchmark’s average, so single days can stray.
The long-run drift comes from the roll. Each roll swaps one contract for another at a different price, so the same money buys a different amount of oil. Our arithmetic, before costs:
barrels after the roll = barrels before x (near price / next price)
When the next month costs more, the market is in contango and the fund ends up with fewer barrels. When it costs less, the market is in backwardation and the fund ends up with more. USCF says a portfolio that rolls each month “would be positively impacted by a backwardation market, and negatively impacted by a contango market”.
Why would later months cost more? The BIS authors split a futures price into spot plus a residual that includes storage until expiry. That residual shrinks as expiry nears. So a fund that keeps buying the costlier month keeps paying for a premium that fades.
How we tested
We pulled bars from the TradingView web chart on 3 November 2026 for AMEX:USO, AMEX:BNO, AMEX:XLE and TVC:USOIL. Return figures use daily closes: USO from 10 April 2006, BNO from 2 June 2010 and XLE from 27 December 2002, the first dates we have, all to 2 November 2026. Correlations use daily changes since 2023. The captures are monthly for USO, USOIL and XLE, weekly for BNO, and daily for April 2020.
Every figure measures price only, before spread, swap, financing, commission and dividends. We placed no trades. TradingView adjusts USO for its reverse split, so its old axis values are not prices anyone paid at the time. We measured the gap between each fund and USOIL, not the futures curve itself. Two data charts are our own, and our method follows the site’s editorial testing policy.
The routes compared, parameter by parameter
This table uses closes from 2 November 2026. The future’s unit value uses USOIL’s 96.25 as a stand-in. We did not test the first two rows.
| Route | What you hold | Roll | Running costs | Correlation with USOIL since 2023 | One unit |
|---|---|---|---|---|---|
| WTI future | 1,000-barrel contract | You roll | Commission, spread | Not tested | About $96,250 |
| Oil CFD | Contract with a provider | Provider’s terms | Spread, financing | Not tested | Provider’s terms |
| USO | Fund share, WTI futures | The fund rolls | Expenses, roll effect | 0.97 | 156.87 |
| BNO | Fund share, Brent futures | The fund rolls | Expenses, roll effect | 0.95 | 65.95 |
| XLE | Fund share, energy companies | None | 0.08% gross expense ratio | 0.60 | 67.25 |
One line deserves a second look. USO’s daily correlation of 0.97 looks close to perfect, yet its long-run result sits far from USOIL’s. Both are true, because correlation ignores a small drift that compounds.
Reading USO, USOIL and XLE on a chart
Compare levels, not shapes. First, ignore the O, H, L, C row, the SELL and BUY boxes and the orange pre-market tag on these captures: they show capture day, not the bars in view. That includes USOIL’s right-hand label of 97.30, so we use the 96.25 close.
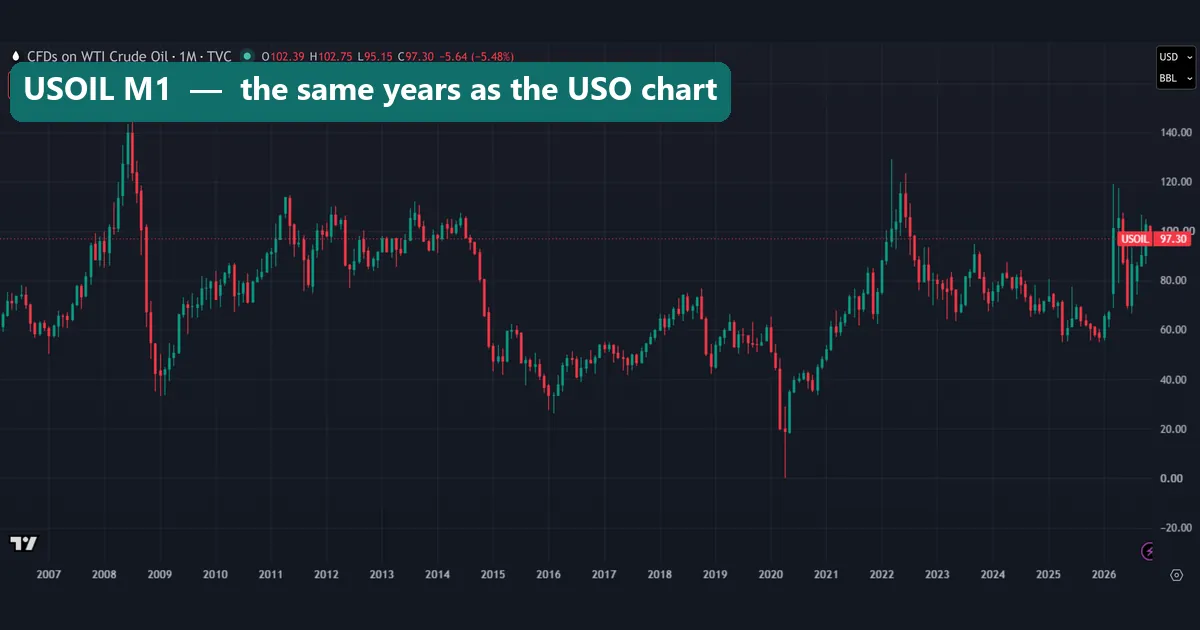
USOIL traded near 100 on the axis in mid-2014 and closed at 96.25 on 2 November 2026. Now look back at the USO chart at the top. The fund sat near 300 on its axis in mid-2014 and closed at 156.87. Nearly the same oil price, about half the fund.
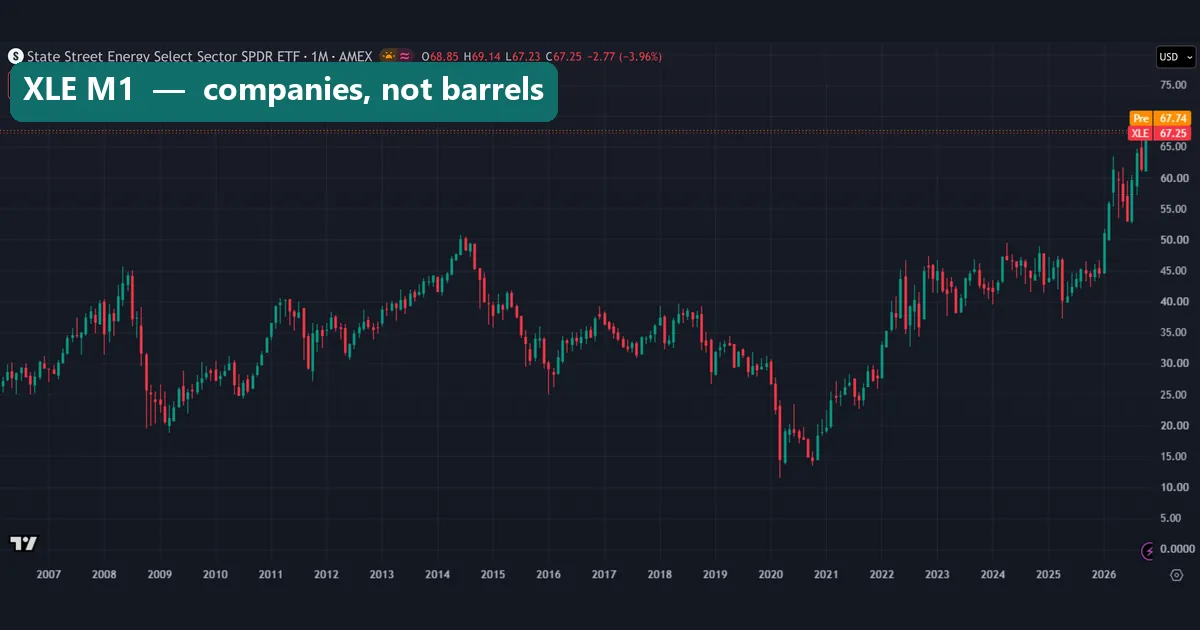
XLE tells a different story. It peaked near 50 in 2014, dropped to about 11 in 2020 and closed at 67.25, well above that old high. USOIL, by contrast, remains far below its 147.27 high of July 2008. So energy shares can reach new highs while oil does not.
Worked example: the USO gap in numbers
Start with four closes from our data, then follow the arithmetic.
- USO went from 544.16 on 10 April 2006 to 156.87 on 2 November 2026: -71.2%.
- USOIL went from 68.74 to 96.25 on the same dates: +40.0%.
- Rebase both to 100. USO ends at 28.8 and USOIL at 140.0, which is 4.86 times the fund.
- Annualize over 20.56 years. USO comes to about -5.9% a year and USOIL to about +1.7%, a gap of roughly 7.5 points a year.
That gap is not all contango. Most of it is the cost of rolling futures, but it also holds expenses, interest on collateral and the difference between USOIL and the contracts USO held. Price data alone cannot split those parts.
Now the futures route, in dollars. One contract is 1,000 barrels, so a $1 move is worth $1,000. With USOIL’s 96.25 as a stand-in, one contract controls about $96,250 of oil. Our USOIL guide measured a 2026 median daily range of 4.74%, which is about $4,560 on one contract at that price. So the futures route starts as a sizing problem. Our page on position sizing and the futures position size calculator work it through.
The gap runs both ways
Our first data chart draws the gap day by day, rebased to 100 on 10 April 2006. The split widens in steps, mainly in 2008 to 2009, 2015 to 2016 and above all 2020. It then narrows from 2021.
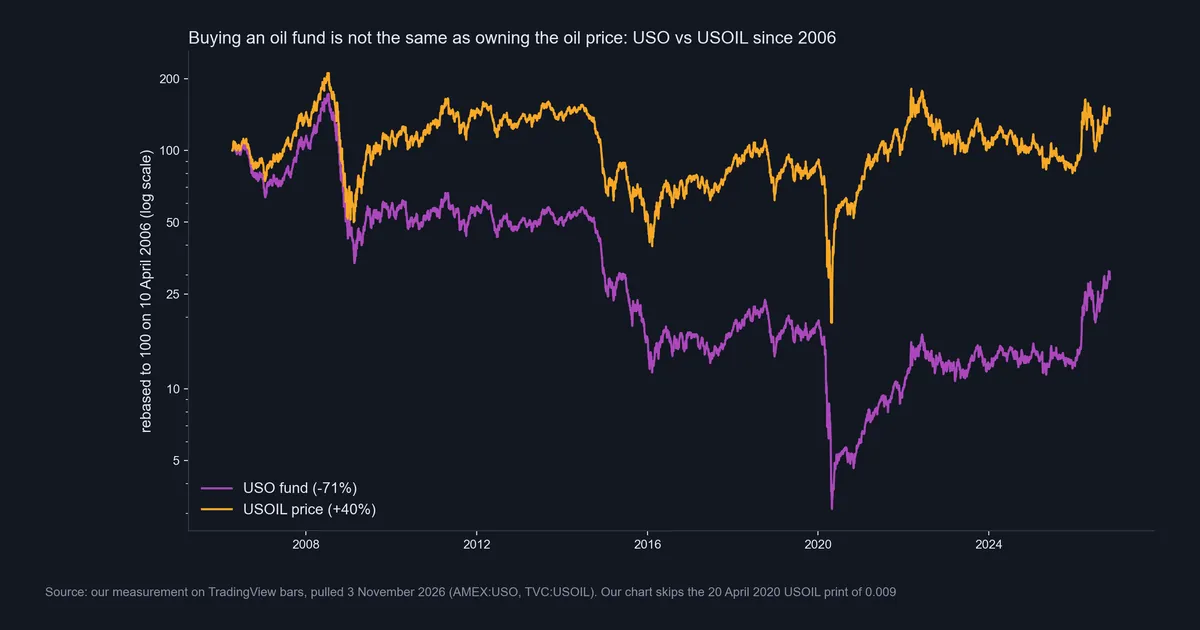
Next, a second chart uses four windows that we chose around big oil swings, so treat them as examples, not a sample. Below it, a table adds BNO and XLE.
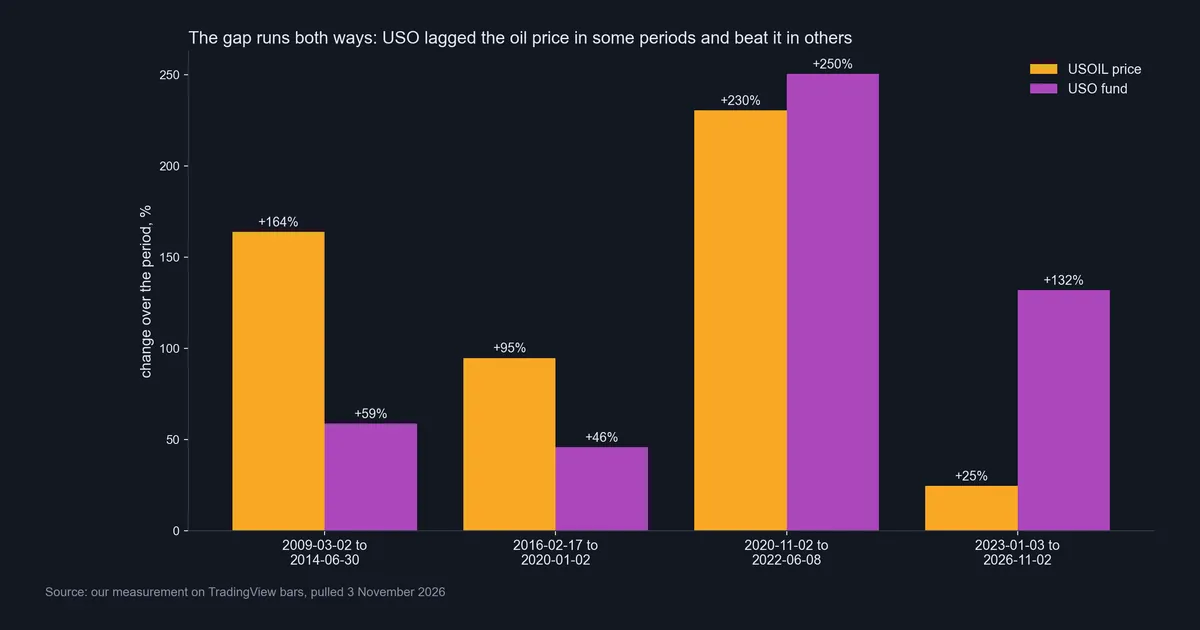
| Window | USOIL | USO | BNO | XLE |
|---|---|---|---|---|
| 2 Mar 2009 to 30 Jun 2014 | +163.8% | +58.8% | No data | +162.6% |
| 17 Feb 2016 to 2 Jan 2020 | +94.7% | +45.9% | +93.3% | +5.1% |
| 2 Nov 2020 to 8 Jun 2022 | +230.3% | +250.3% | +268.8% | +210.7% |
| 3 Jan 2023 to 2 Nov 2026 | +24.7% | +131.9% | +143.1% | +59.4% |
USO lagged in the first two windows and led in the last two. So a fund can beat spot, and in backwardation the roll works for it. The sign depends on the curve’s shape, but we measured the gap, not the curve. Also, USCF says USO moved into later-month contracts in spring 2020 and returned mainly to its benchmark contract by January 2024, so these windows do not compare one unchanged portfolio.
Download the complete indicator database
Put these concepts on your charts. One email unlocks the full library of 1,380+ indicators with compiled MT4 and MT5 files, plus my TradingView scripts. No paywall, no spam, unsubscribe any time.
Get free access to my indicator database
One email unlocks 1,380+ free MT4, MT5 and TradingView indicators — the complete library. No single-tool download; you get the whole database.
Where it fails
No route here gives you the oil price, and our test has limits of its own.
- USOIL is not a product. Every gap above compares a real fund with a chart line. That line stopped at 0.009 on 20 April 2020, while the May future settled at -$37.63.
- We did not measure the curve. USCF’s text gives the mechanism and our figures give the gap. The link between them is reasoning, not a test.
- Dates drive the result. We chose the windows, and moving them changes the numbers.
- XLE is understated. Our figures leave out its dividends, and State Street listed a 2.18% fund distribution yield as of 30 October 2026.
- USO does not cut losses. USCF says the fund is not actively managed by conventional methods. In the ordinary course, it keeps positions that are falling.
- Tax can bite. USO generally pays no cash to holders. USCF says not to invest if you would need distributions to pay tax on your share of its income and gains.
- Oil itself rose slowly. USOIL’s +40.0% over 20.56 years is about 1.7% a year, and the July 2008 high still stands. No route fixes that.
BNO: the same structure on Brent
BNO is USCF’s Brent fund, with the same contango and backwardation warning in its disclosures. From 2 June 2010 to 2 November 2026 it rose 157.7%, against 30.9% for USOIL. However, USOIL is a WTI line, so this compares two grades as well as a fund and a price.
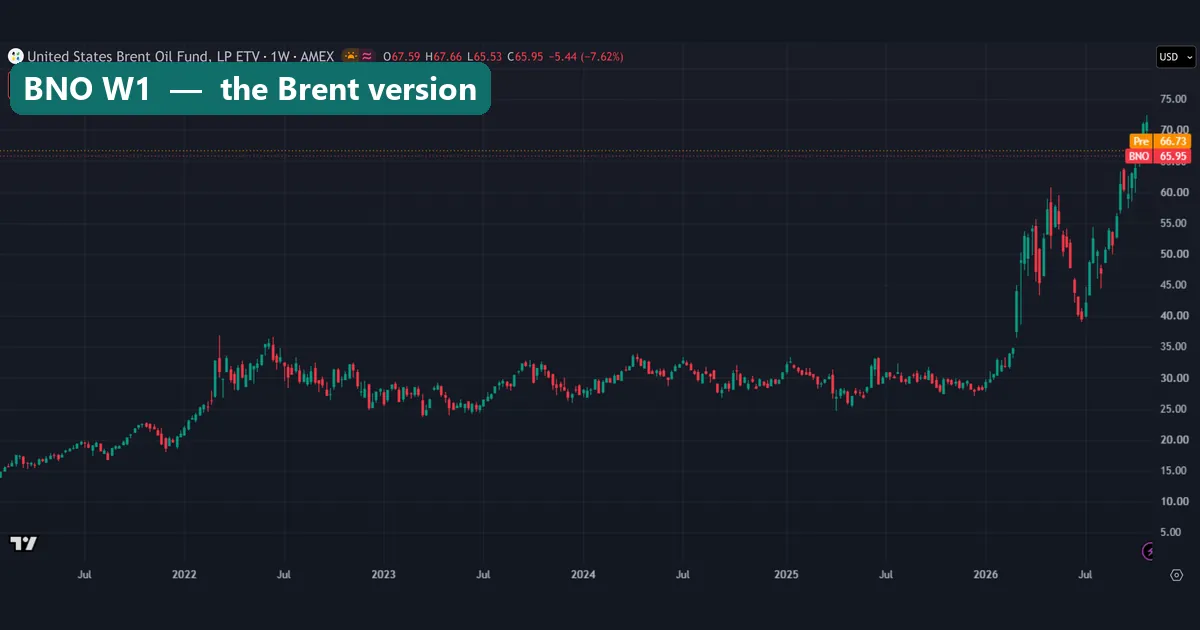
The weekly chart starts in 2021. BNO climbed to about 37 in 2022 and spent most of 2023 to 2025 between 25 and 33. Then 2026 brought a surge past 70 on the axis, and it closed at 65.95. Meanwhile, USOIL’s 2026 wick near 120 stayed below its 2022 wick near 130. Some of that difference may be the curve and some may be Brent against WTI. Prices alone cannot split them.
20 April 2020: what USO did when the front month went negative
Marker 1 sits on 20 April 2020. The CFTC report says the May WTI contract settled at -$37.63 that day, after an intraday low of -$40.32. USO did not follow it below zero. The fund stood near 85 on the axis in late February and about 30 on 20 April, then fell below 20 by 28 April. The S icon near that date is TradingView’s split mark, so these are adjusted prices.
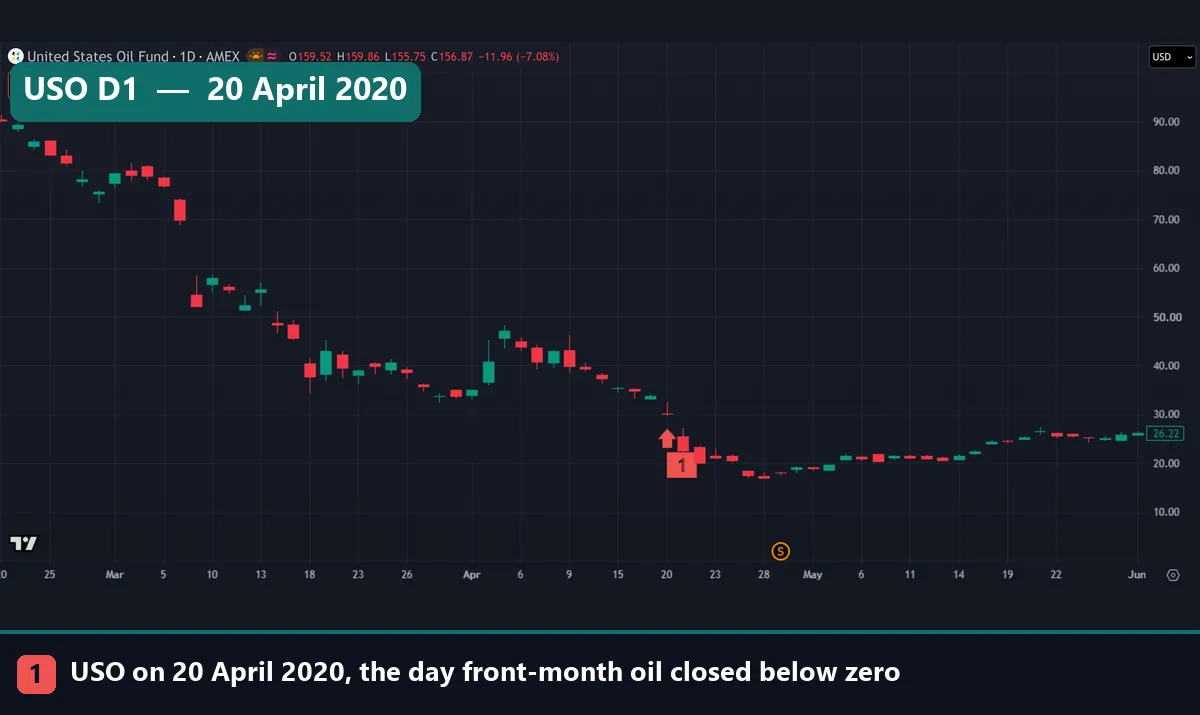
USCF says USO moved into later-month contracts that spring. Meanwhile, the BIS authors report that money flowed into WTI funds as storage at Cushing tightened, and they think small investors betting on a rebound probably played a significant role. They say “possibly” about the link to negative prices, so it remains a hypothesis.
The rebound trade also had a cost. On our rebased chart, USOIL passed its early 2020 level during 2021, but USO did not get back there until 2026. So a rise in oil and a rise in the fund were different events.
Common mistakes
- Reading a fund chart as an oil chart. USO’s axis shows a fund after years of rolling and a split adjustment, not what oil did.
- Assuming the gap always hurts. USO made +131.9% against +24.7% for USOIL from January 2023. Yet the opposite rule fails 2009 to 2014.
- Treating XLE as an oil position. Its correlation with USOIL is 0.60, and from 2016 to 2020 it made +5.1% while USOIL made +94.7%.
- Sizing a contract on its margin. The deposit may look small, yet the exposure is about $96,250 per contract. Read our page on leverage risk first.
Where to go next
For chart work, our crude oil TradingView guide sets up the symbols, and the USOIL guide explains the reference line. If contracts are new to you, read the difference between forex and futures first. Forex traders may also want commodity currencies and how commodities and forex correlate. For falls like these, see our page on drawdowns.
The fund and contract facts above come from USCF, State Street, the CFTC and the BIS, each linked where we use it. Fund terms change, so read the current prospectus first.
FAQ: how to invest in oil
Can a small investor buy oil directly?
Not as barrels, in practice. One WTI future covers 1,000 barrels and calls for delivery at Cushing if you hold it to expiry. Funds give smaller investors easier access, but each route brings its own gap from the price.
Why did USO fall while oil rose?
From 10 April 2006 to 2 November 2026, USO lost 71.2% while USOIL gained 40.0%. Most of that gap is the cost of rolling futures in contango, plus expenses. We cannot give each cause a number.
What is contango in plain terms?
Contango means later delivery months cost more than the near month. A fund that rolls then sells the cheaper contract and buys the costlier one. Backwardation is the reverse.
Can an oil fund beat the oil price?
Yes, in some windows. USO made +131.9% against +24.7% for USOIL from January 2023. Still, it lagged badly from 2009 to 2014, so the sign depends on the curve.
Do USO and BNO track the same oil?
No. USO follows WTI and BNO follows Brent. Long windows can differ widely, such as +45.9% against +93.3% from 2016 to 2020.
Is XLE the same as investing in oil?
No. XLE holds energy companies, and two of them made up about 43% of the fund on 2 November 2026. Our price figures also exclude its dividends.
Can an oil fund lose everything?
USCF warns that investors could lose part or all of their investment. Also, the BIS authors note that such funds could, in theory, see a negative net asset value.
Is oil a good long-term investment?
Our data cannot settle that. USOIL rose about 1.7% a year over 20.56 years, and the route you choose changes the outcome a great deal. This page is not advice, and results are not guaranteed; past performance is not indicative of future results.
Last updated: 3 November 2026.

About the author
Written by Dominic Walsh, a Forex trader and MT4/MT5 indicator, Expert Advisor and script developer. Every tool on forexmt4systems.com is tested on live charts before release and ships with ready-to-use compiled MT4 (.ex4) and MT5 (.ex5) files. Learn more about the trader and developer behind this site.
How we build, test and correct every tool: Editorial & Testing Policy. Trading carries risk; see the disclaimer.