
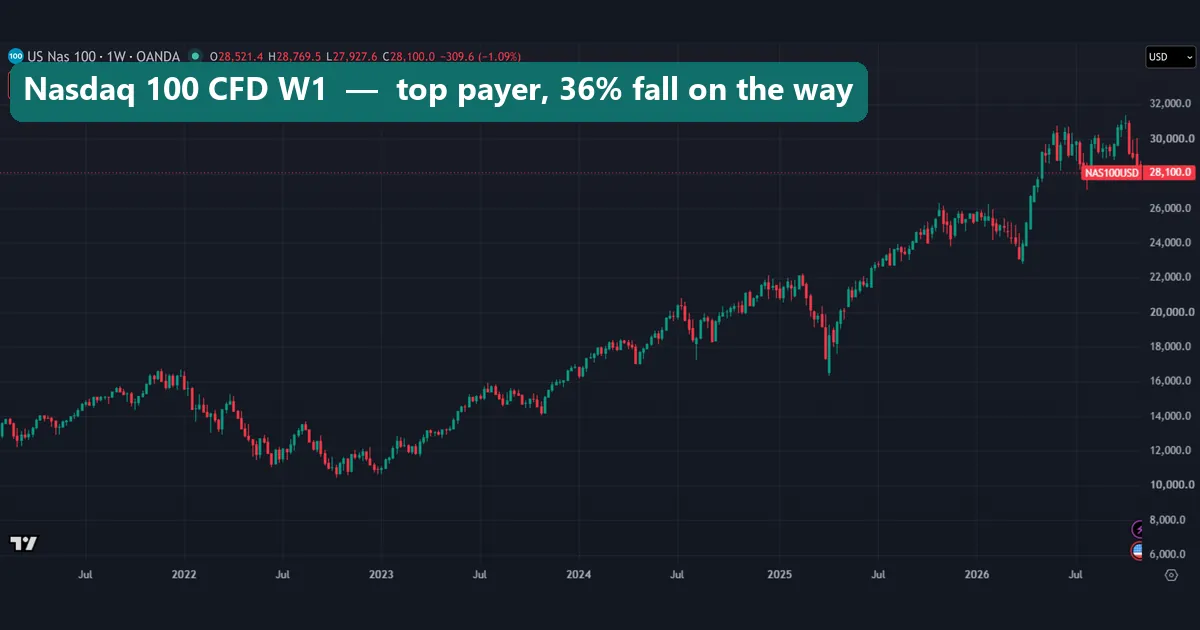
The phrase higher risk higher reward sounds like a law of markets, but it describes what investors ask for, not what they receive. So we put numbers on it. Across 12 markets from January 2015 to November 2026, the link between volatility and price change was weak: a correlation of +0.26. This guide settles what the idea claims, what our figures show, and why 12 markets can neither prove it nor kill it. The first chart is the Nasdaq 100 CFD, the best payer in our table, and even it fell 36% by late 2022.
What higher risk higher reward actually means
It is a claim about expectations. Investors will only hold a riskier asset if they can expect more from it, so prices settle at a level where that extra return is possible. The SEC’s What is Risk? page at Investor.gov puts it plainly: as risks rise, investors seek higher returns to compensate themselves. Note the verb. Investors seek. Nobody says they get it.
The same page defines risk as uncertainty and potential financial loss in an investment decision. A higher expected return cancels neither one.
Keep this apart from the risk-reward ratio on a single trade, which is a different idea. That ratio compares your stop with your target on one position, and you choose both numbers. Our topic is whole markets over many years.
How the idea works: pay for risk you cannot spread
The formal version comes from portfolio theory. Harry Markowitz showed that what counts is how much an asset adds to the risk of a whole portfolio, not its risk in isolation. William Sharpe used that work to build the Capital Asset Pricing Model. Both shared the 1990 economics prize with Merton Miller, and the prize press release at NobelPrize.org lays out the logic.
The model’s formula is short:
expected return = Treasury bill rate + beta x (expected market return - Treasury bill rate)
Here, beta measures how an asset moves with the whole market. According to the model, expected return rises in direct proportion to beta, not with total volatility. A stock can swing hard for its own reasons, yet those private swings can be spread across many holdings. So, in theory, nobody pays you for risk you could have spread away.
Our test cannot check that theory, because we measured past price changes, not expected returns, and no betas. Instead, we show how loosely the slogan fits the prices traders actually saw.
How we tested
We pulled daily bars from the TradingView web chart on 3 November 2026. Each market’s window runs from 2 January 2015 to 3 November 2026. The 12 markets are USOIL (TVC) and these OANDA symbols: the Nasdaq 100, S&P 500, Dow, Germany 30, UK 100, Japan 225 and Hong Kong 33 CFDs, then gold, EUR/USD, GBP/USD and USD/JPY. We calculated from D1 closes and took the charts on W1.
For currency pairs we added a second source: MetaTrader 4, build 1471, using Capital Point Trading history. That gives D1 closes on 21 pairs, each with 6.0 to 8.0 years of data. The terminal has been offline since late August 2026, so those windows end there.
Every figure is prices only, before spread, swap, financing, commission and dividends. The weekly charts start in early 2021, so they show part of the window: the tables carry the numbers. Our wider rules are in our editorial testing policy.
The parameters behind our numbers
Five measures do the work here, and each has a blind spot. The first rests on standard deviation, which NIST’s handbook section on measures of scale defines as the square root of the variance. We scale it up with 260 trading days a year.
| Measure | How we calculate it | Blind spot |
|---|---|---|
| Annualised volatility | Standard deviation of daily log returns x square root of 260 | Counts a sharp rise the same as a sharp fall |
| Annualised price change | Compound yearly rate from first close to last close | Ignores dividends, swap and financing |
| Change per unit of volatility | Annualised change / annualised volatility | Only as good as the window |
| Worst fall | Deepest drop from any earlier daily closing high | Says nothing about recovery time |
| Correlation | Standard correlation of volatility with change across the 12 markets | Weak evidence on so few points |
On USOIL, we skip TradingView’s 0.009 print of 20 April 2020, because that single bar would swamp the result. Also, our ratio is not a Sharpe ratio, because we deduct no cash rate.
Reading risk on a weekly chart
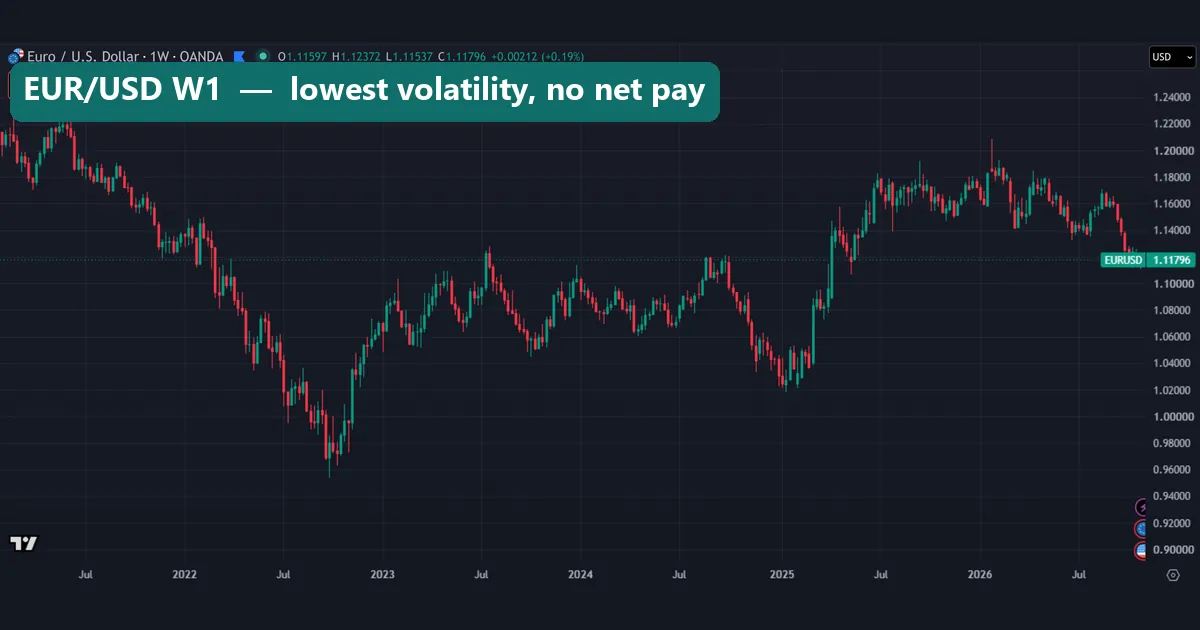
A chart can show you volatility, but it can also fool you. EUR/USD fell from about 1.22 early in this view to under 0.96 in late 2022, then climbed back above 1.20 in early 2026. That looks like plenty of action. Yet its volatility of 7.8% is the lowest in our table, and its price change since 2015 is -0.6% a year.
Gold rose from about 1,800 in 2021 to a wick above 5,500 in early 2026, then dropped back towards 4,000. Its volatility is 16.1%, about twice that of EUR/USD, and its change is +10.6% a year. The fall from that high is the -28% in our table. Its low came at the very end of our window, so we cannot call that figure final.
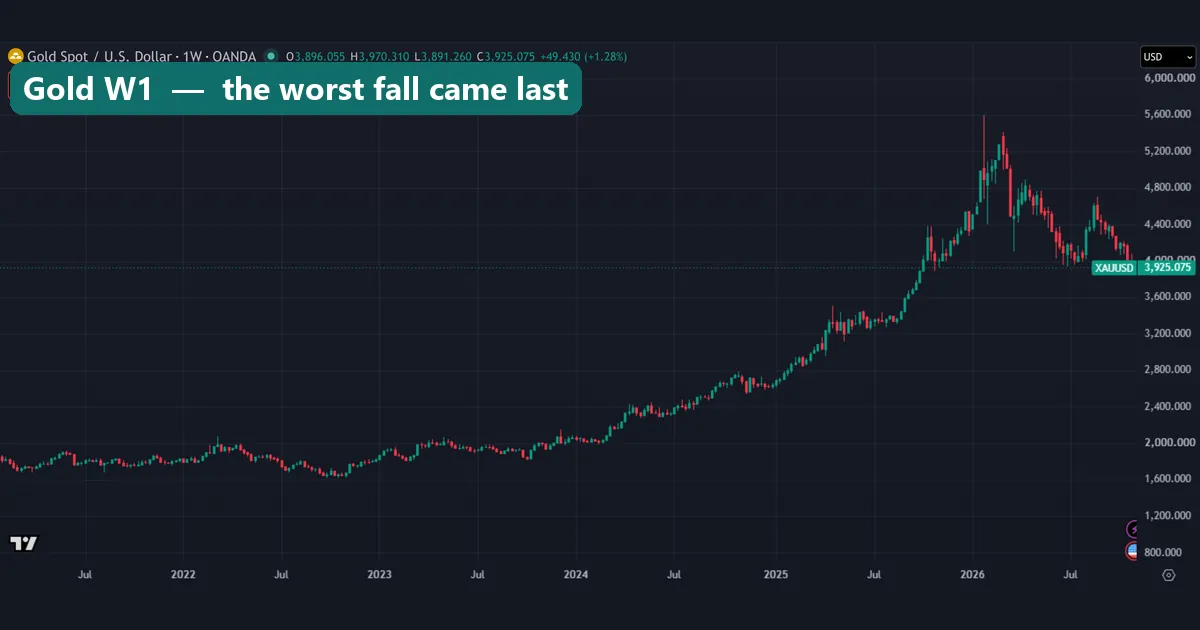
Both charts fill the same height, because each price axis fits its own range. So you cannot compare risk by eye. You need a number, and our guide to measuring forex pair volatility with ATR shows one way to get it on your own feed.
What the 12 markets paid
The table sorts the markets from most to least volatile. If the slogan worked as a rule, the change column would fall steadily as you read down. It does not. Our guides to stock indices and CFDs explain those instruments if they are new to you.
| Market | Volatility | Change a year | Change per unit | Worst fall |
|---|---|---|---|---|
| USOIL | 45.6% | +5.4% | 0.12 | -83% |
| Hong Kong 33 CFD | 23.3% | -0.1% | 0.00 | -56% |
| Nasdaq 100 CFD | 22.0% | +17.4% | 0.79 | -36% |
| Japan 225 CFD | 21.9% | +11.4% | 0.52 | -32% |
| Germany 30 CFD | 19.8% | +8.5% | 0.43 | -39% |
| S&P 500 CFD | 17.5% | +11.6% | 0.66 | -34% |
| Dow CFD | 17.1% | +9.4% | 0.55 | -37% |
| UK 100 CFD | 16.2% | +4.3% | 0.26 | -37% |
| Gold | 16.1% | +10.6% | 0.66 | -28% |
| GBP/USD | 9.2% | -1.1% | -0.12 | -33% |
| USD/JPY | 9.2% | +2.3% | 0.25 | -20% |
| EUR/USD | 7.8% | -0.6% | -0.08 | -23% |
Oil took the most risk and paid little. Gold paid the same per unit of volatility as the S&P 500 CFD, with a shallower worst fall. The correlation of +0.26 is weak, and on 12 points it can neither prove nor disprove a rule.
Worked example: same volatility, three different results
Take three markets with nearly the same volatility: Hong Kong 33 at 23.3%, the Nasdaq 100 CFD at 22.0% and Japan 225 at 21.9%. If risk alone set the pay, all three should have paid about the same.
- First, divide annual change by volatility. Nasdaq 100: 17.4 / 22.0 = 0.79. Japan 225: 11.4 / 21.9 = 0.52. Hong Kong 33: -0.1 / 23.3 = 0.00.
- Next, check the worst fall. The Nasdaq 100 fell 36%, Japan 225 fell 32% and Hong Kong 33 fell 56%. So the market that paid nothing also fell deepest.
- Then repeat with a second group. Gold and the UK 100 CFD have almost equal volatility, at 16.1% and 16.2%. But gold changed +10.6% a year and the UK 100 only +4.3%, so the ratios are 0.66 and 0.26.
- Finally, test the extreme. USOIL ran at 45.6%, about twice the Nasdaq’s volatility. Yet 5.4 / 45.6 gives only 0.12.
In short, equal risk did not bring equal pay. Nor did volatility predict the depth of a loss. GBP/USD has about half the S&P 500 CFD’s volatility, yet their worst falls nearly match: -33% and -34%. The S&P’s fall came in a few weeks of early 2020, while sterling’s took years. So we read volatility and drawdown as two separate costs.
What the scatter and the bars show
The scatter plots each market once: volatility across, price change up. A rising straight line would back the slogan. Instead, you get a loose cloud, with USOIL alone on the far right and Hong Kong 33 on the zero line.
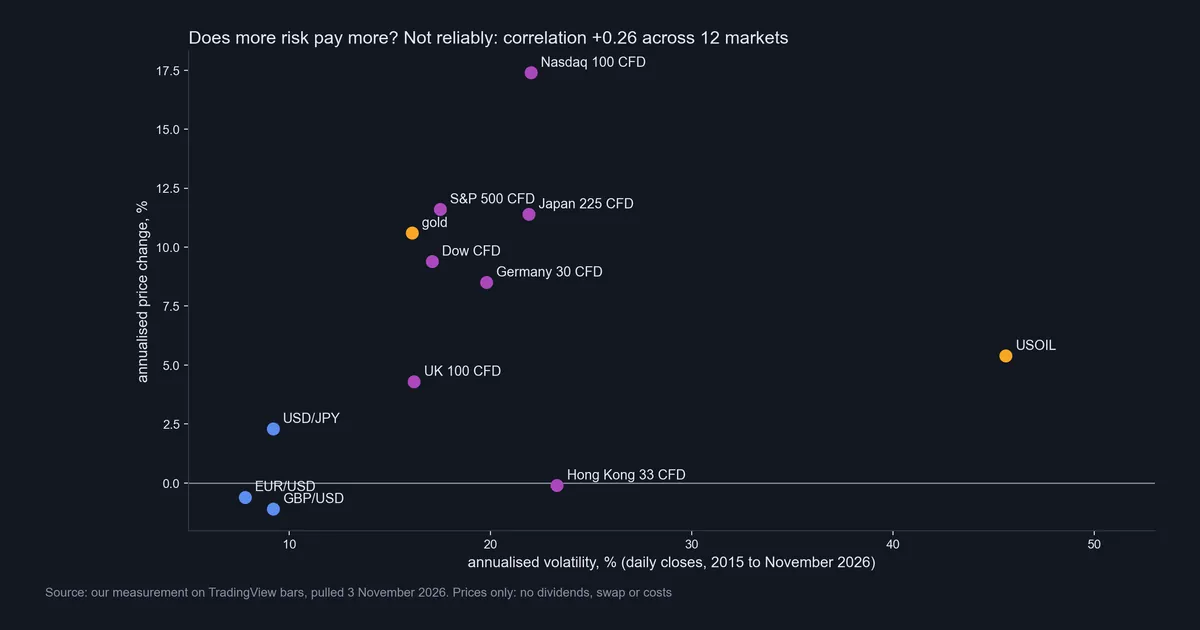
The result is also fragile. Take oil out of the 12 and the correlation more than doubles. Take Hong Kong out as well, and the pattern starts to look like a law. Yet among the seven stock index CFDs alone, the link nearly vanishes. So one or two markets decide the story, which is the classic problem with a small sample.
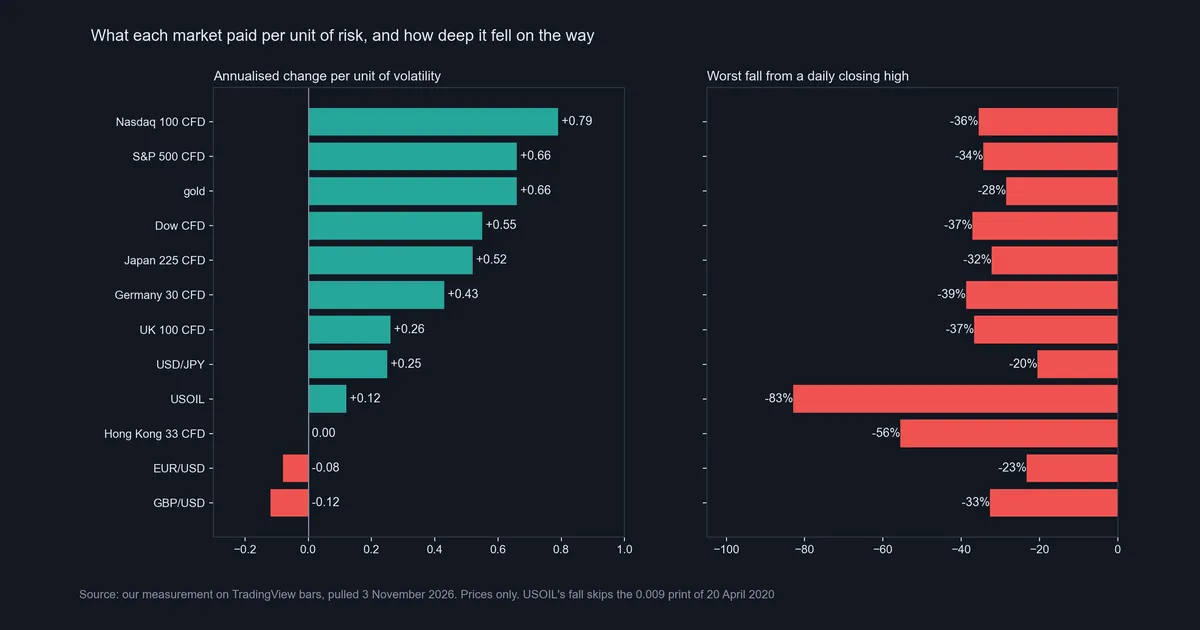
The bars split pay from pain. Look at the Nasdaq 100 CFD: it tops the left panel and still fell 36%. By contrast, the UK 100 CFD fell about as far, at 37%, for about a third of the pay per unit. A fall that deep also takes far more than the same percentage to repair, as our guide on recovering from drawdown explains.
Download the complete indicator database
Put these concepts on your charts. One email unlocks the full library of 1,380+ indicators with compiled MT4 and MT5 files, plus my TradingView scripts. No paywall, no spam, unsubscribe any time.
Get free access to my indicator database
One email unlocks 1,380+ free MT4, MT5 and TradingView indicators — the complete library. No single-tool download; you get the whole database.
Why the currency pairs tell us little
Our MT4 test covers 21 pairs. There, volatility’s correlation with the size of the annual move is +0.49, which looks stronger than +0.26. However, it counts size only, because direction depends on which currency is quoted first: a fall in EUR/USD is a rise in USD/EUR. So a bigger move is not a bigger reward.
Carry is also missing. A position in a pair pays or earns swap each night, and a carry trade lives on that flow. We counted none of it.
The rows still teach something. AUD/JPY was the most volatile pair at 11.1% and moved 3.86% a year. CHF/JPY ran at 8.1% and moved 9.41% a year. All six yen pairs rose, which is one story about one currency rather than six rewards for risk. So FX tells us little here.
Where it fails
Our test has plain limits, and the slogan has worse ones.
- Too few points. Twelve markets cannot prove or disprove a rule.
- Survivorship. We chose markets that still exist and that traders know. Failed companies and closed funds are missing, and survivorship bias on Wikipedia explains how that skews results upwards.
- The window. The years from 2015 to 2026 were kind to US stocks, and changing the dates can flip the sign. EUR/USD shows -0.6% a year on our TradingView window and +0.96% on our shorter MT4 window. GBP/USD goes from -1.1% to +1.56%. Yet volatility hardly moves: 7.8% against 7.4%, and 9.2% against 8.4%. The feeds and end dates differ too, but the lesson holds.
- Prices only. Dividends are missing, so stock index figures understate what a holder of the stocks received. Financing on a CFD pulls the other way. We also did not convert currencies, so Hong Kong 33 is in Hong Kong dollars and Germany 30 in euros.
- Volatility is not all of risk. It counts a sharp rise as risk, and it says little about gaps.
- One path. A past change is one outcome, not an expected return.
Two markets that took the risk and paid little
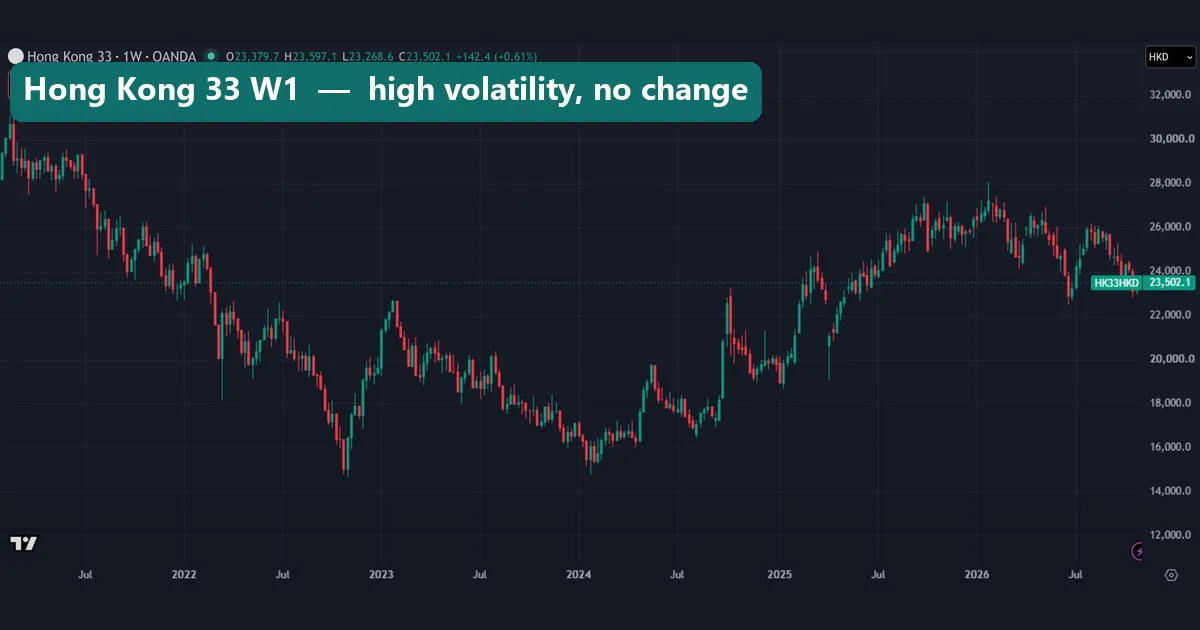
Hong Kong 33 shows the plainest case. It stood near 31,000 early in this view, near 15,000 in late 2022 and again in early 2024, then about 28,000 in early 2026. That is a lot of travel, on 23.3% volatility. Yet its change since 2015 is -0.1% a year. Its worst fall of 56% began before this chart starts and ended at the late 2022 low.
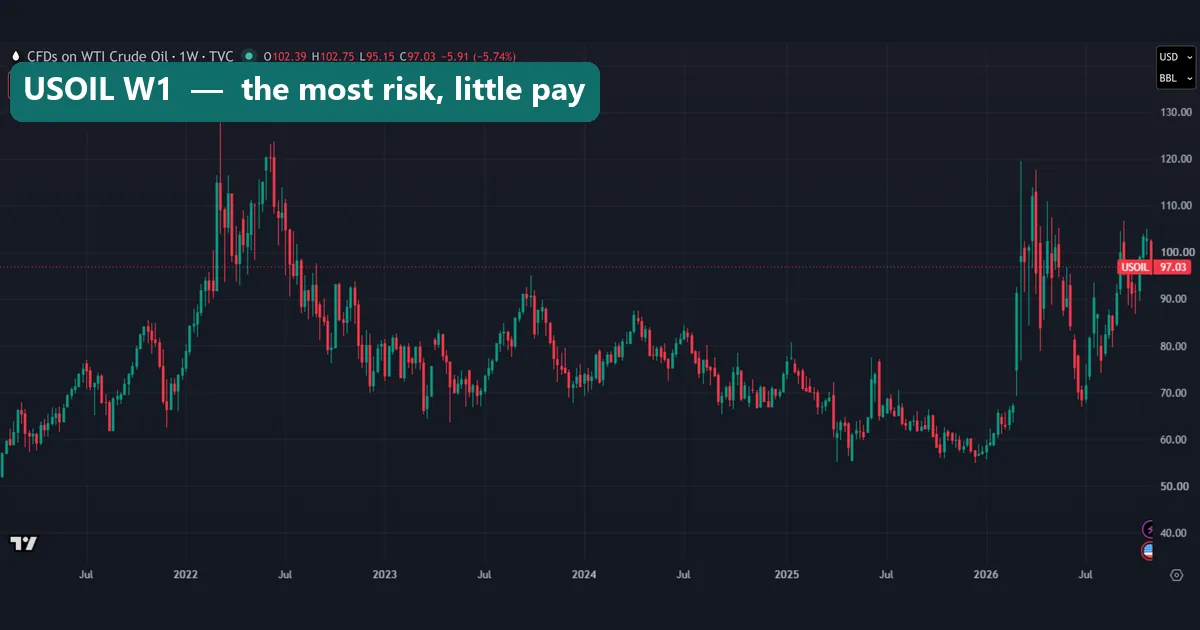
USOIL took the most risk of all. In this view alone it swung between the 50s and about 130, and its volatility is about twice that of the next market. Its worst fall of 83% ended in April 2020, before this chart starts. The end date also flatters its +5.4% a year: around the start of 2026 this chart still sat near 55. Our USOIL guide covers what happened in April 2020.
Common mistakes with this idea
- Reading it as a promise. The slogan describes what investors seek. A risky market owes you nothing, and Hong Kong 33 paid nothing over nearly 12 years.
- Treating all volatility as paid risk. Theory pays, at most, for risk you cannot spread. Oil’s swings came with 0.12 per unit, while gold’s came with 0.66.
- Adding leverage to chase the reward. Leverage scales volatility and change together, and then financing takes a cut. So it cannot lift the ratio, but it can turn a bearable fall into a wiped account.
- Chasing the top of the table. The Nasdaq 100 CFD’s 0.79 looks back over a kind window. It is not a forecast.
Where to go next
If this matters to your own account, start with size rather than a forecast. Volatility held steadier than change across our two windows, so it is more useful for sizing a position than for predicting a result. Our guide to position sizing shows the method, and the forex volatility calculator gives you a number to start from.
For the single-trade version of this idea, read our risk-reward ratio guide. Our outside sources are the SEC’s Investor.gov, NobelPrize.org, NIST and Wikipedia, all linked above.
FAQ: risk, volatility and pay
Is higher risk higher reward true?
It is true as a statement of what investors seek. It fails as a rule about outcomes: across our 12 markets, the correlation between volatility and price change was +0.26, which is weak.
Which market paid the most per unit of volatility in your test?
The Nasdaq 100 CFD led at 0.79, then the S&P 500 CFD and gold at 0.66. Those figures cover January 2015 to November 2026, prices only.
Which market took the most risk for the least pay?
USOIL had the highest volatility at 45.6% and paid 0.12 per unit. Hong Kong 33 ran at 23.3% and paid 0.00.
Does higher volatility mean a deeper worst fall?
Often, but not reliably. USOIL and Hong Kong 33 had the highest volatility and the deepest falls. However, GBP/USD fell 33% on 9.2% volatility, while gold fell 28% on 16.1%.
Is this the same as the risk-reward ratio?
No. A risk-reward ratio compares the stop and the target on one trade, and you set both. This guide looks at whole markets over many years.
Why are currency pairs a poor test of this idea?
A pair’s direction depends on which currency is quoted first, and we did not count carry. That is why the +0.49 across 21 pairs measures only the size of the move.
Can leverage raise my reward for the same risk?
No. Leverage raises the risk too, so the change per unit of volatility stays the same at best. After financing it tends to drop, and the worst fall gets deeper.
Can I use these figures to choose a market?
We would not. The table covers one window and 12 markets picked after the fact, before all costs. It shows what happened and forecasts nothing: results are not guaranteed; past performance is not indicative of future results.
Last updated: 3 November 2026.

About the author
Written by Dominic Walsh, a Forex trader and MT4/MT5 indicator, Expert Advisor and script developer. Every tool on forexmt4systems.com is tested on live charts before release and ships with ready-to-use compiled MT4 (.ex4) and MT5 (.ex5) files. Learn more about the trader and developer behind this site.
How we build, test and correct every tool: Editorial & Testing Policy. Trading carries risk; see the disclaimer.