
The University of Michigan consumer sentiment index is a monthly US survey of how households feel about their money and the economy. This guide settles what the survey asks, how the preliminary and final readings differ, and how much markets move at the 10:00 New York release. We measured 20 releases from January to October 2026 on nine symbols. In short, it is a small mover: the 10:00 bar ran 0.96 to 1.35 times the same bar on other Fridays. By contrast, the Fed’s 14:00 bar ran 4 to 7 times normal in our FOMC meeting guide.
What the University of Michigan consumer sentiment index is
The index comes from the Surveys of Consumers, run by the University of Michigan’s Survey Research Center. George Katona founded the surveys in 1946. The Survey Information page at the University of Michigan links the survey description, index calculation, FAQ and 2026 release dates we use below.
The sample aims to represent American households, excluding Alaska and Hawaii, with about 1,000 interviews a month. Each survey holds about 50 core questions on personal finances, business conditions and buying conditions. However, only five of them feed the headline index.
So the number measures mood and expectations, not spending. For spending, the BEA’s consumer spending page reports the value of goods and services bought by, or for, US residents. One records what people say, and the other records what they bought.
The survey also asks about prices. A 2020 Federal Reserve FEDS Note on common inflation expectations lists the Michigan survey among its inputs. For measured inflation, see our guide to CPI in forex. The survey description adds that its expectations measures feed leading indicators, which our business cycle guide covers.
How it works: five questions and one formula
Five questions build the headline. In plain terms:
- Are you better or worse off financially than a year ago?
- Will you be better or worse off a year from now?
- Will the country see good or bad times over the next twelve months?
- Over the next five years or so, continuous good times, or periods of widespread unemployment or depression?
- Is now a good or bad time to buy major household items?
Each question gets a relative score: the percent of favorable replies, minus the percent of unfavorable replies, plus 100. So a score above 100 means more favorable replies than unfavorable ones. Next, the headline sums the five rounded scores, divides by the 1966 base period total, and adds a 2.0 constant that corrects for sample design changes from the 1950s. The headline and its two sub-indexes look like this:
Consumer Sentiment = (X1 + X2 + X3 + X4 + X5) / 6.7558 + 2.0Current Economic Conditions = (X1 + X5) / 2.6424 + 2.0Consumer Expectations = (X2 + X3 + X4) / 4.1134 + 2.0
Questions 1 and 5 describe today, while the other three look ahead. None of the five asks for an amount: they only count good and bad answers.
Preliminary and final: two Fridays a month
Each month has two releases, both on Fridays in the 2026 schedule: the preliminary mid-month and the final at month end. According to the survey’s FAQ, the preliminary targets about 420 interviews, while the final typically reflects about 1,000.
Each set of interviews runs through the Monday before its release, so a Friday reading holds no answer given after that Monday. November and December shift a little for holidays.
The survey’s main site lists each release at 10am ET, so the slot is 10:00 New York. The next releases are 6 and 20 November 2026, then 4 and 18 December. US clocks changed on 1 November, so 10:00 New York is now 15:00 UTC, not the 14:00 UTC on our charts. Our page on forex news release times covers the shift, and our economic calendar lists upcoming slots.
How we tested
First, we took the 20 releases from January to October 2026 in the University of Michigan’s published schedule: 10 preliminary and 10 final. Then we pulled M15 bars from the TradingView web chart on 3 November 2026 for OANDA EURUSD, GBPUSD, USDJPY, USDCAD, AUDUSD, XAUUSD, the S&P 500 CFD and the Nasdaq CFD, plus TVC:USOIL.
For each symbol we took the M15 bar opening at 10:00 New York. We compared its range with the same bar on 23 or 24 other Fridays, and with the 09:45 bar before it. We also compared the size of the move from that open to the close one hour later. All figures are medians, and a ratio above 1 means bigger than the comparison.
As a cross-check, we repeated the test in MetaTrader 4, build 1471, on M15 history from July 2025 to August 2026. The window ends there because the terminal has been offline since late August 2026. It holds 21 EURUSD releases, fewer on some symbols, and several 2025 dates are missing from our list.
These are chart feeds, not broker fills, and every figure comes before spread, swap and commission. Other US data can share the 10:00 slot, and we did not remove those days. Our editorial testing policy explains how we run these checks.
Release facts and test settings
The survey has no inputs to adjust, so here are the release facts and our test settings.
| Item | Value |
|---|---|
| Release slot | 10:00 New York, Fridays |
| Preliminary interviews | Target of about 420 |
| Final interviews | Typically about 1,000 |
| Comparisons | Same bar on other Fridays; the 09:45 bar |
| First-hour move | 10:00 open to the close one hour later, size only |
Reading a release on a chart
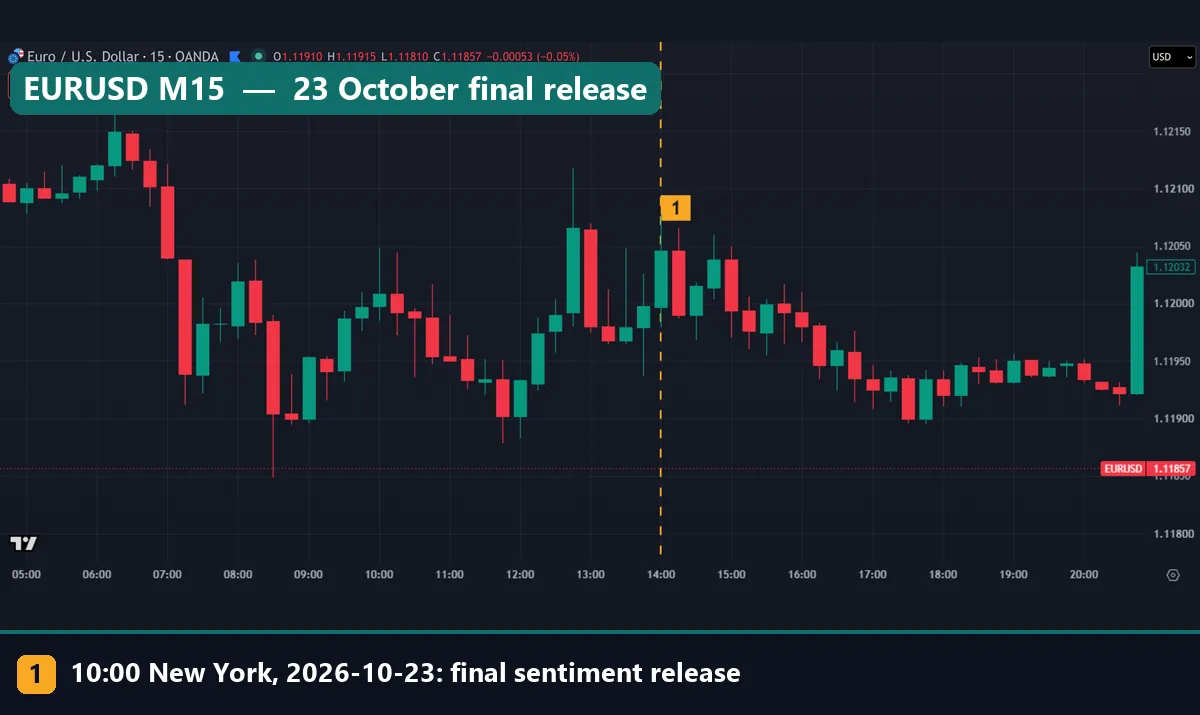
Start with the first chart in this guide, EURUSD on 23 October 2026. Our captures show UTC on the time axis, so the dashed line sits at 14:00. Do not read that axis as New York time. Also ignore the header and the price tags, because they show the live quote from the day of the capture. On that chart, the falling bars near 07:15 UTC and the rising bar at the right edge have longer bodies than the marked bar.
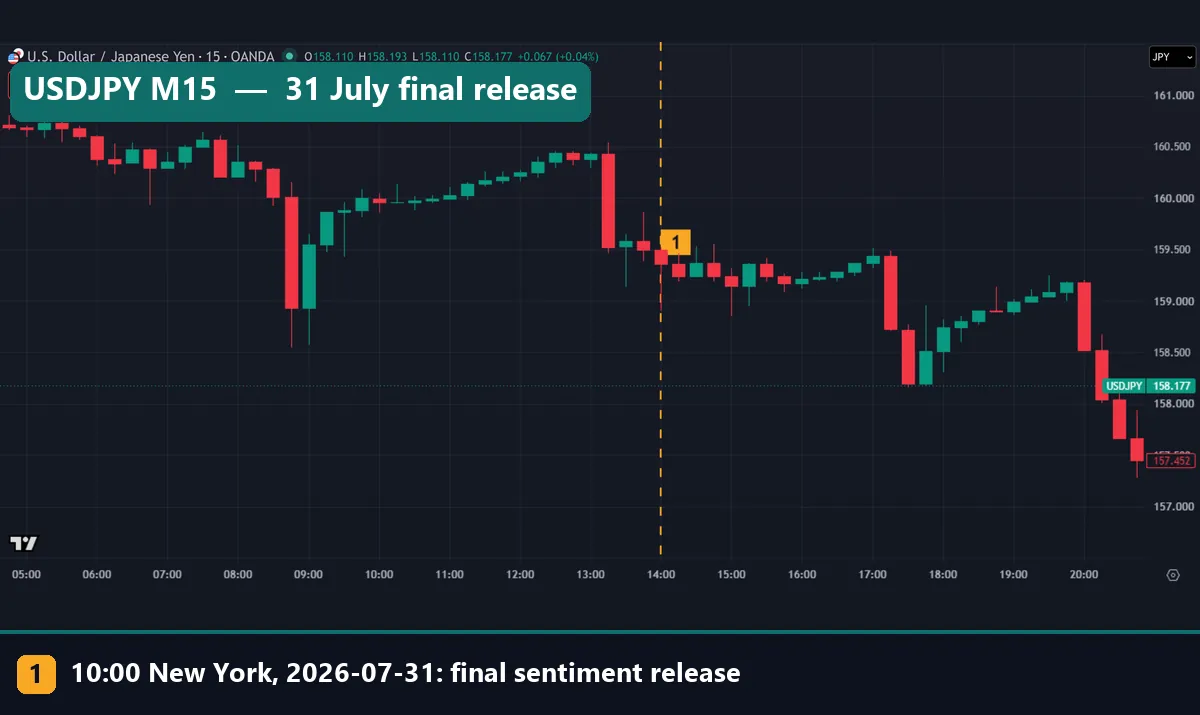
On USDJPY on 31 July 2026, the marked bar opened at 159.498, reached down to 158.908 and closed at 159.363. That is a wide range with a small body. Meanwhile, the longest bodies sit near 08:45, 13:15 and 17:15 UTC. So a long wick at 10:00 does not make the survey the day’s main event.
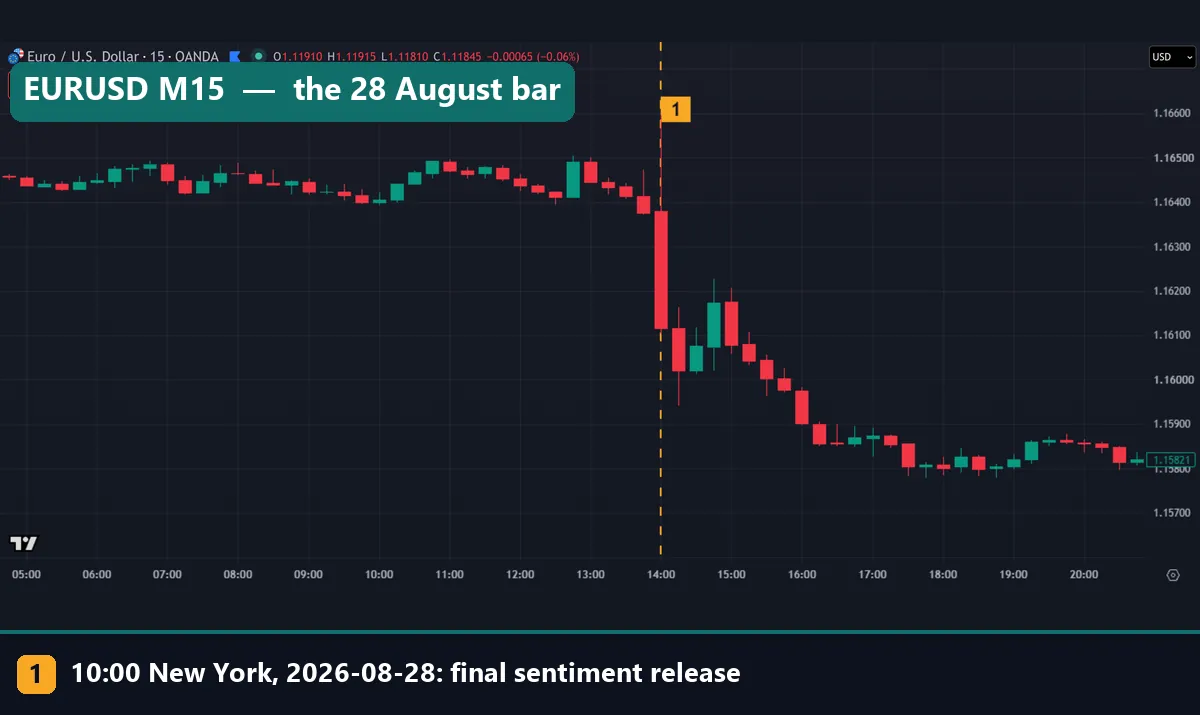
EURUSD on 28 August 2026 looks very different. The bar opened at 1.16380, touched 1.16596 and 1.16101, and closed at 1.16116. That range of 49.5 pips is the largest EURUSD bar across our 20 releases. Even so, we measured the move, not its cause.
Worked example: eight EURUSD releases in pips
Here are the last eight EURUSD releases in our test. Range is the 10:00 bar’s high minus its low. The last column runs from the bar’s open to the close one hour later.
| Date (2026) | Release | Range (pips) | One-hour move (pips) |
|---|---|---|---|
| 17 July | Preliminary | 4.5 | +3.5 |
| 31 July | Final | 12.4 | +38.0 |
| 14 August | Preliminary | 6.6 | +0.6 |
| 28 August | Final | 49.5 | -20.6 |
| 11 September | Preliminary | 7.6 | +1.7 |
| 25 September | Final | 7.5 | +0.4 |
| 9 October | Preliminary | 7.7 | +2.2 |
| 23 October | Final | 9.9 | +4.1 |
Take 23 October. The bar opened at 1.11997, with a high of 1.12078 and a low of 1.11979. High minus low is 0.00099, or 9.9 pips. One hour after the open, price closed at 1.12038, which is 4.1 pips above the open.
Seven of the eight ranges sit at 12.4 pips or less, but 28 August prints 49.5 pips, about four times that. That same bar ran 53.6 pips on GBPUSD, 48.7 on USDJPY, $88 on gold and 33.8 points on the S&P 500 CFD. One bar like this is why we report medians.
A range is not a profit, though. Costs come on top, and our page on why spreads widen explains how they can rise around scheduled news. Seven of the eight hourly moves ended higher, but eight bars prove nothing about direction.
What the 20 releases show
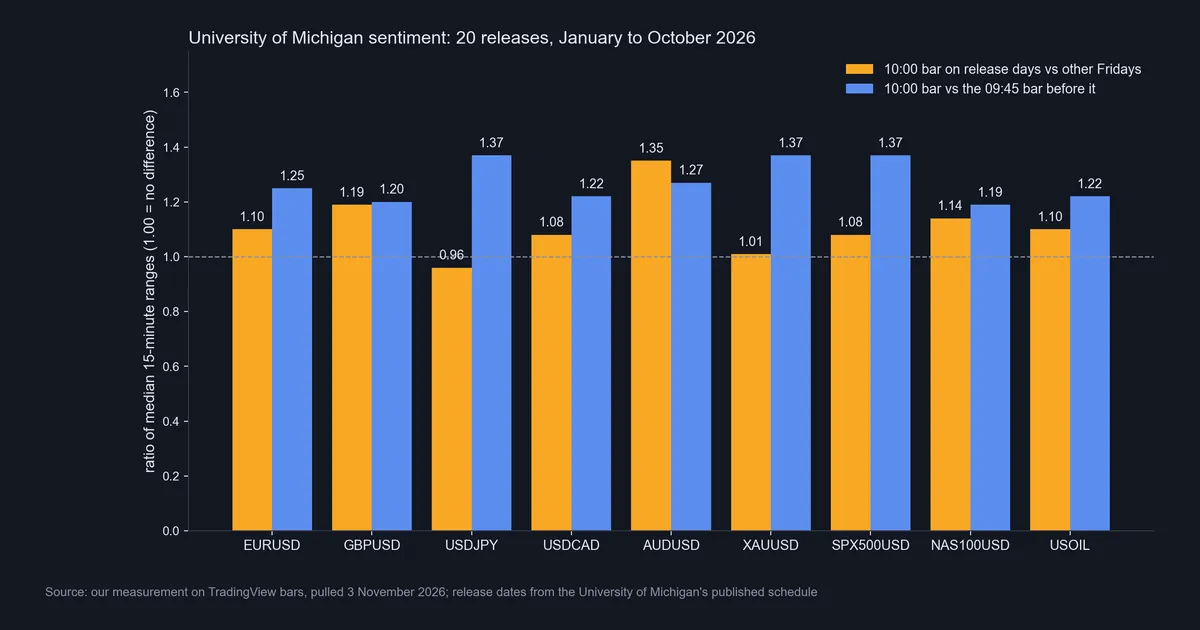
We drew this chart from our own measurements. The orange bars compare the 10:00 bar with the same bar on other Fridays. They run from 0.96 on USDJPY to 1.35 on AUDUSD, and the median of the nine is 1.10. So on a typical symbol, the release bar is about a tenth wider than normal. For scale, our initial jobless claims guide measured 1.26 to 1.49 times, against Monday to Wednesday.
The blue bars compare it with the 09:45 bar. Those run from 1.19 to 1.37, so the 10:00 bar does step up a little. But 10:00 is a busy slot anyway, and other US data can share it.
The MT4 cross-check agrees: EURUSD 1.01, USDCAD 1.04, GBPUSD 1.09, USDCHF 1.10 and XAUUSD 0.90 against other Fridays.
Preliminary against final, and the first hour
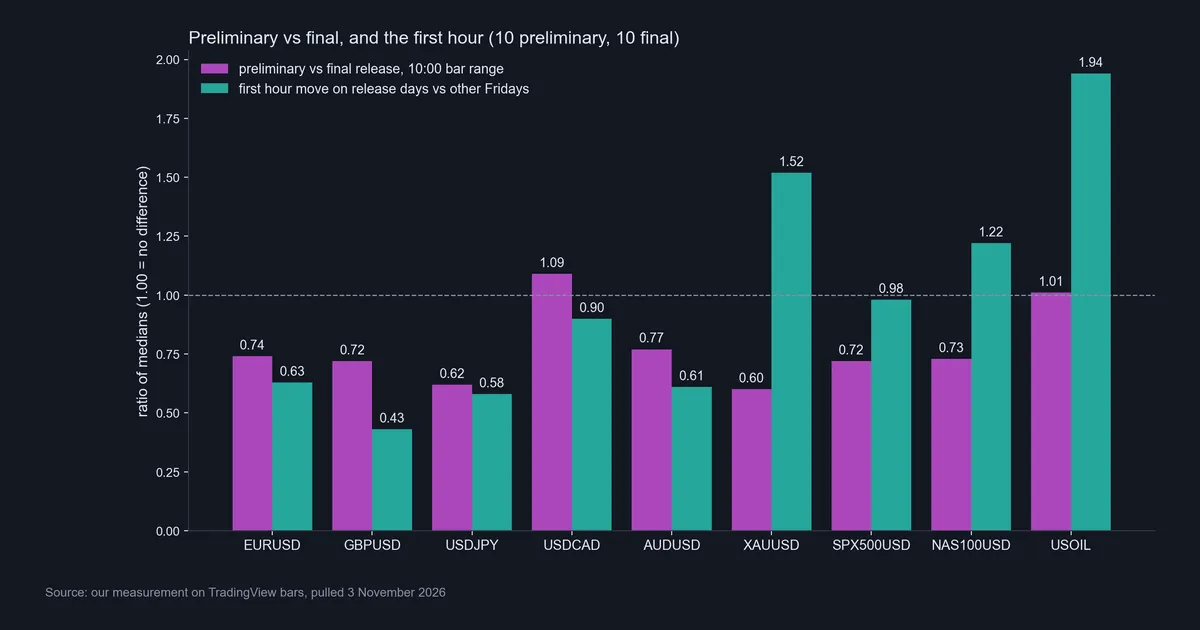
The purple bars divide the preliminary bar’s range by the final bar’s. Many traders assume the preliminary matters most, but our numbers go the other way. The preliminary bar was smaller on seven of nine symbols, from 0.60 on gold to 0.77 on AUDUSD. USOIL sat level at 1.01, and USDCAD came in at 1.09.
Treat that as weak evidence. We have only 10 of each, and the final group holds the 28 August bar. The MT4 check also disagrees on some pairs: EURUSD 1.12 and GBPUSD 1.17 over a different window, although gold stayed at 0.56. So we cannot say which release moves more.
The teal bars compare the first-hour move with other Fridays. All five FX pairs came in smaller, from 0.43 on GBPUSD to 0.90 on USDCAD. Yet XAUUSD reached 1.52, the Nasdaq CFD 1.22 and USOIL 1.94, while the S&P 500 CFD sat at 0.98. The result points both ways, so it gives no rule. It also measures size, so it says nothing about up or down.
Download the complete indicator database
Put these concepts on your charts. One email unlocks the full library of 1,380+ indicators with compiled MT4 and MT5 files, plus my TradingView scripts. No paywall, no spam, unsubscribe any time.
Get free access to my indicator database
One email unlocks 1,380+ free MT4, MT5 and TradingView indicators — the complete library. No single-tool download; you get the whole database.
Where it fails
Few releases. We have 20 in ten months, only 10 of each kind, and all from 2026 on TradingView. The MT4 window stops in August 2026. On EURUSD, two final bars, 20 February and 28 August, stand far above the rest.
A shared slot. Other US data can land at 10:00, and we did not remove those days. So part of the small bump may belong to something else.
Size, not surprise. We compared bar ranges, not each reading against its forecast. So we cannot say how a big surprise behaves, or whether a weak reading pushes the dollar one way.
Mood is not price. The survey’s own description recalls October 1987, when stock prices plunged but consumers responded calmly. So the two can disagree.
Gold and the S&P 500 on release days
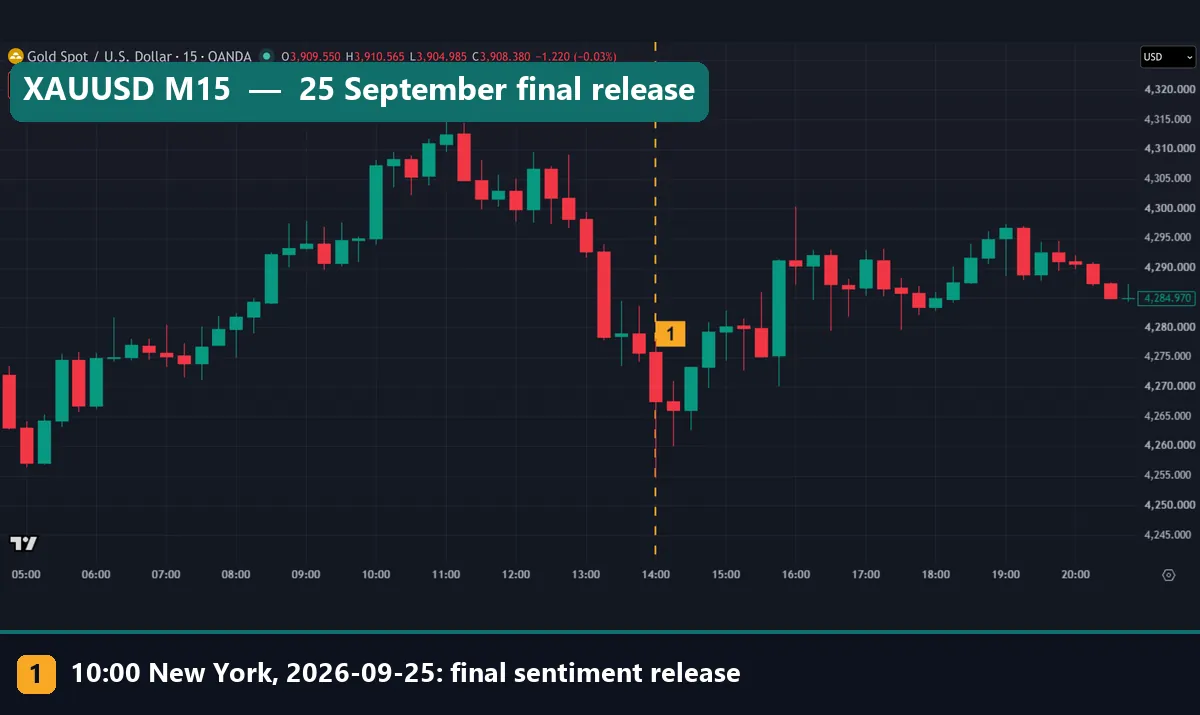
Gold on 25 September 2026 shows a more typical day. The marked bar opened at 4,275.875, dipped to 4,254.58 and closed at 4,267.545, a range of $23.48. One hour after the open, price closed at 4,279.265. Yet the longest bodies sit before the line and near 15:45 UTC.
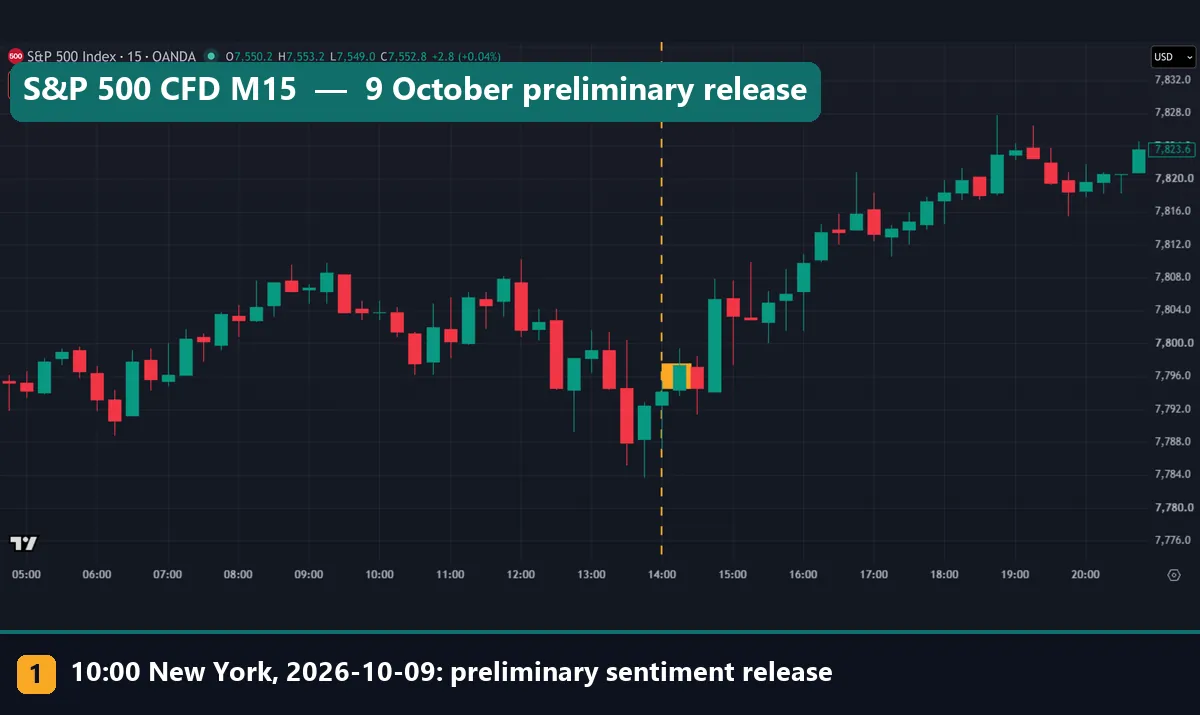
The S&P 500 CFD on 9 October 2026 shows a preliminary release, with a range of just 8.3 points. Nothing about the bar stands out. The marker’s box sits behind the candles here, so use the dashed line to find it. Also, 10:00 falls 30 minutes after the cash open in the New York session, so this slot is active with or without a survey.
Common mistakes
Treating it like a Fed day. The release bar ran about 1.10 times normal at our median, against 4 to 7 times for the Fed’s 14:00 bar. So do not treat it like the top releases on our high-impact news page.
Expecting a direction from the first hour. The ratio ran from 0.43 on GBPUSD to 1.94 on USOIL. That measures size, and it points both ways.
Assuming the preliminary is the big one. It was smaller on seven of nine symbols in 2026, yet the MT4 check reversed that on EURUSD and GBPUSD.
Blaming every 10:00 bar on the survey. Other US data can share the slot. Check the day’s events first, as our guide to reading an economic calendar shows. A chart can tell you when a bar moved, but not why.
Where to go next
These pages cover the releases and ideas around the survey:
- NFP in trading, for the monthly US jobs report.
- Forex news spikes, for what happens when a release hits hard.
- Sentiment vs fundamentals, for market sentiment, a different idea from a household survey.
For a second US survey, the Conference Board’s consumer confidence page says its index comes out at 10 a.m. ET on the last Tuesday of every month, from an online sample with a 1985=100 base.
FAQ
What is the University of Michigan consumer sentiment index?
It is a monthly measure of how US households see their finances and the economy, built from five survey questions.
When is it released?
Twice a month at 10:00 New York, on Fridays in the 2026 schedule. The next releases are 6 and 20 November 2026.
What is the difference between the preliminary and final reading?
The preliminary comes mid-month and targets about 420 interviews. The final comes at month end and typically reflects about 1,000.
How is the index calculated?
Each question gets a relative score: favorable replies minus unfavorable replies, plus 100. The index sums the five scores, divides by 6.7558 and adds 2.0.
Does consumer sentiment move forex?
Only a little in our test: 1.10 times other Fridays on EURUSD, 1.19 on GBPUSD and 0.96 on USDJPY. Other US data can share the slot, so that proves no cause.
Does the preliminary reading move markets more than the final?
Not in our 2026 test, where it was smaller on seven of nine symbols. But with only 10 of each, that is weak evidence.
How is it different from the Conference Board index?
They are separate surveys. The Conference Board publishes on the last Tuesday of each month, and Michigan on two Fridays.
Should I trade the release on its own?
Our numbers give no reason to. The bar is small, the first-hour result points both ways, and our figures leave out trading costs. Test any idea on your own broker’s data first; results are not guaranteed; past performance is not indicative of future results.
Last updated: 3 November 2026.

About the author
Written by Dominic Walsh, a Forex trader and MT4/MT5 indicator, Expert Advisor and script developer. Every tool on forexmt4systems.com is tested on live charts before release and ships with ready-to-use compiled MT4 (.ex4) and MT5 (.ex5) files. Learn more about the trader and developer behind this site.
How we build, test and correct every tool: Editorial & Testing Policy. Trading carries risk; see the disclaimer.