
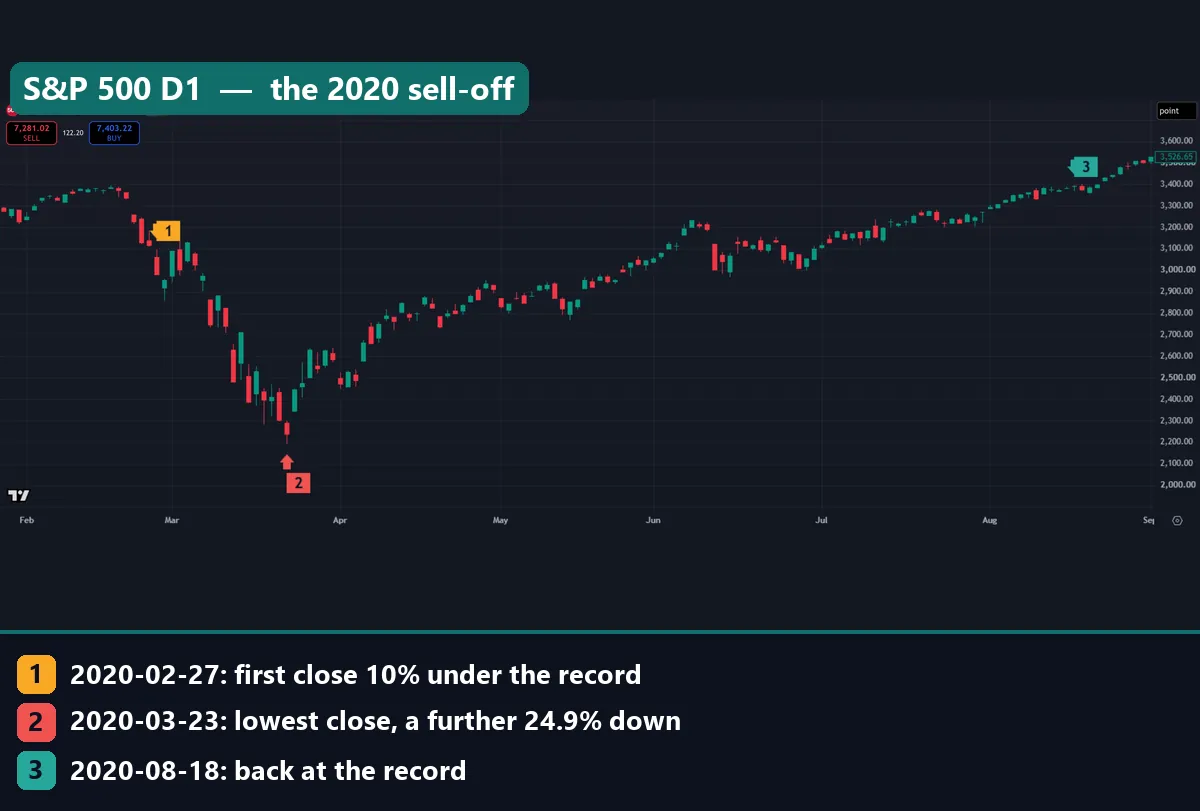
Paper hands is trading slang for selling at the first sign of trouble, usually in a sharp fall. This article settles what that habit did on the S&P 500 since 1937 and on Bitcoin since 2013. Our rule was simple: sell at the first close 10%, 20% or 30% under the record, then compare with holding. On the index, holding came out ahead in most episodes, though not in all. On Bitcoin, the price more often stood lower months later. The chart below shows the 2020 case.
What paper hands means
Paper hands describes a holder who sells as soon as a price starts to slide. The opposite is diamond hands: holding through the fall. Dictionary.com’s slang entry for diamond hands says paper hands refers to an investor “who will abandon an investment at the first sign of a decrease”. It adds that diamond hands can also be a jab at a stubborn holder.
So both labels are judgments, and people hand them out after the fact. A sale looks like paper hands if the price recovers, and wise if it keeps falling. Our guide to trading slang covers more terms like these. The phrase also makes a claim, that selling into a fall is a mistake, and closing prices can test it.
Paper hands or a planned exit?
Not every sale in a fall counts as paper hands. A trader who set a stop loss before the entry and lets it fill is following a plan. Paper hands is the other kind of sale: no exit rule, then a sudden urge to get out.
That urge has a known source. A loss tends to hurt more than an equal gain pleases, as our page on loss aversion in trading explains. Add a steep red chart, and selling starts to feel like relief. Our guide to fear and greed in trading covers that pull. So our question is narrow: if you sold at a fixed depth with no plan, how did that compare with holding?
How a paper hands sale works: the drawdown and the round trip
Our rule needs two numbers. First comes the drawdown on each close:
drawdown % = (close / highest close so far - 1) x 100
An episode starts at the first close at or below the trigger, such as -10%. It ends at the first close back at or above the old record.
Second comes the cost of getting back in. Sell 10% under a record, wait for the record, and you pay at least 1 / 0.9 = 1.111 times your sale price. So the round trip costs at least 11.1%, and deeper triggers cost more:
- Sell 10% under, buy back at the record: at least 11.1% dearer.
- Sell 20% under: at least 25.0% dearer.
- Sell 30% under: at least 42.9% dearer.
- Sell 50% under: at least 100% dearer.
We say “at least” because a close can land past the trigger. In February 2020 the first such close sat 12.0% under the record. Our gain and loss percentage calculator runs the same sums. In short, the seller comes out ahead only by buying back below the sale price, and that takes a second, well-timed call.
How we tested
We pulled daily bars for SP:SPX and BITSTAMP:BTCUSD from the TradingView web chart on 6 November 2026. Bars dated 6 November were still forming, so we dropped them. Both windows end on 5 November 2026, as the table below shows.
The oldest stretch needs a warning. Britannica’s entry on the S&P 500 says the index began small in 1923, tracked 90 stocks from 1926 and grew to 500 in 1957. So our bars before March 1957 follow that narrower predecessor.
We read the close 252 sessions after each trigger as one year, and 756 sessions as three years. Bitcoin trades every day, so its 252 bars cover about 8.3 months. All figures use prices only, with no dividends, spread, commission, financing or tax. Our editorial testing policy explains how we run tests like this.
The parameters behind our numbers
| Setting | S&P 500 (SP:SPX) | Bitcoin (BITSTAMP:BTCUSD) |
|---|---|---|
| Daily window | 21 Jun 1937 to 5 Nov 2026 | 1 Jan 2013 to 5 Nov 2026 |
| Trigger depths | -10%, -20%, -30% | -30%, -50% |
| Episodes found | 29, 13, 7 | 8, 6 |
| “One year” later | 252 sessions | 252 bars, about 8.3 months |
| “Three years” later | 756 sessions | 756 bars, about 2.1 years |
| Episode ends | First close at or above the old record | Same rule |
We set deeper triggers on Bitcoin because it moves far more. From 7 September 2021 to 5 November 2026, it moved 5% or more on 7.1% of days. The depths are our choice, and others would give other counts. They also overlap: the 2008 slide appears at each S&P 500 level.
Reading a sell-off on a chart
Marker 1 is the trigger close, marker 2 the lowest close after it, and marker 3, where shown, the first close back at the record. Ignore the quote row and the SELL and BUY boxes at the top left. They show the latest bar on capture day, not the bars in view.
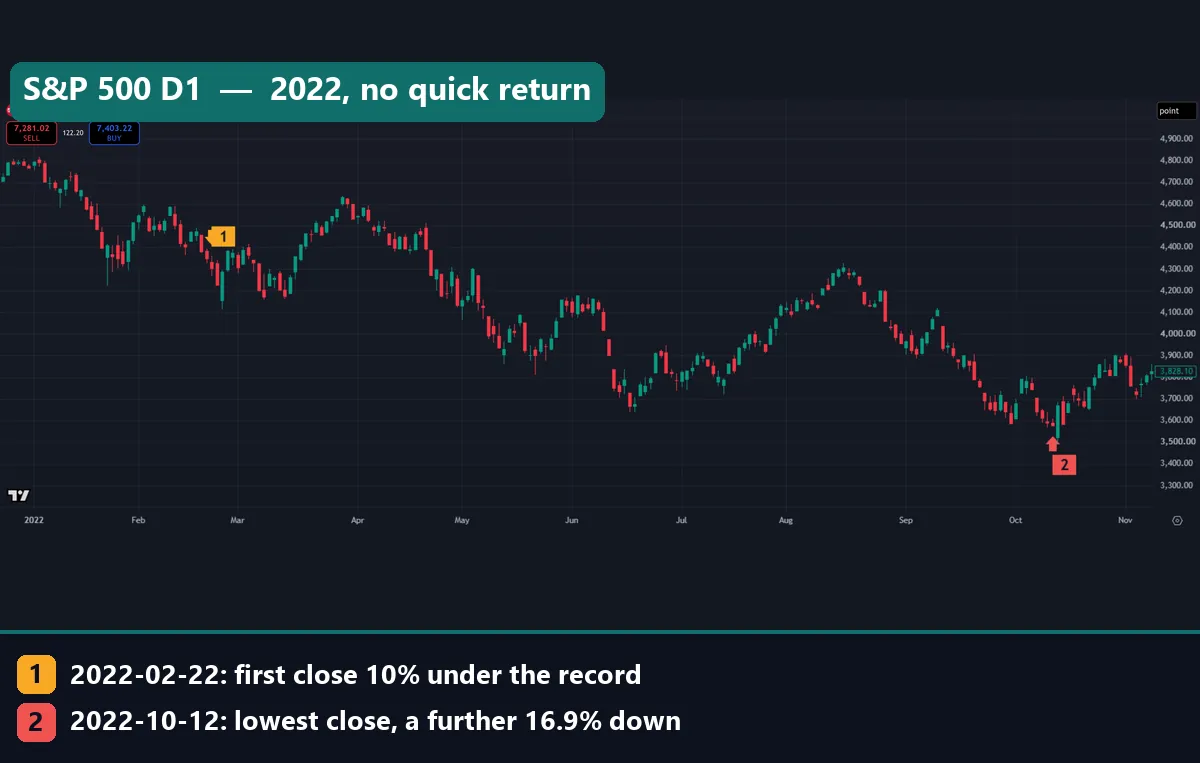
In 2022 the fall was slow. The record close was 4,796.57 on 3 January, and the trigger fired on 22 February at 4,304.77. By 29 March the index had climbed back near 4,632, only 3.4% short. That rally faded, and so did a second one in August near 4,305. The lowest close came on 12 October, a further 16.9% down. The record only returned on 19 January 2024, 479 sessions after the trigger.
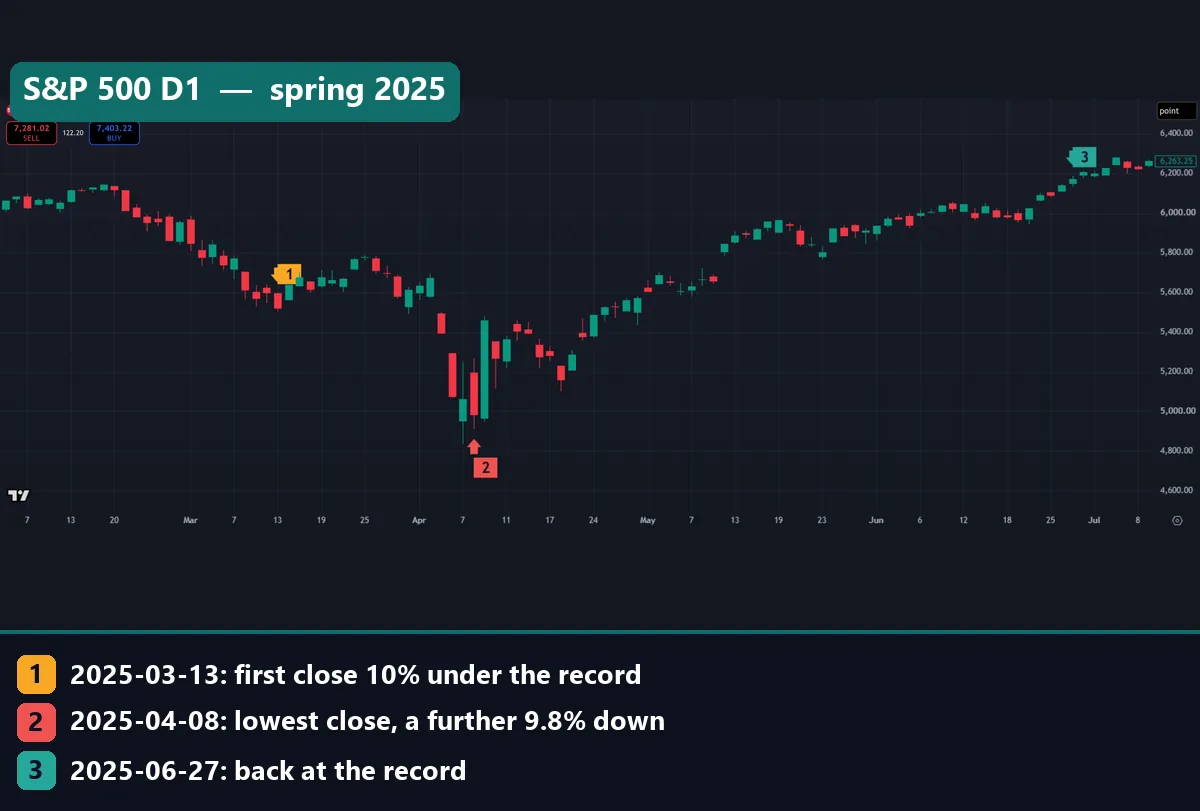
Spring 2025 moved far faster. After the 13 March trigger at 5,521.53, the lowest close came on 8 April, a further 9.8% down. Our rule reads closes, so the long lower wick on 7 April does not count. Then, just 73 sessions after the trigger, the index closed back at the record on 27 June.
Worked example: the 2020 sell-off, close by close
Take the top chart, with one seller and one holder. Both owned the index at the record close on 19 February 2020.
| Step | Date | S&P 500 close | Against the record |
|---|---|---|---|
| Record close | 19 Feb 2020 | 3,386.15 | 0.0% |
| Trigger: first close 10% under | 27 Feb 2020 | 2,978.76 | -12.0% |
| Lowest close | 23 Mar 2020 | 2,237.40 | -33.9% |
| First close back at the record | 18 Aug 2020 | 3,389.78 | +0.1% |
The seller got out at the 27 February close, already 12.0% under the record. For three weeks that looked smart. By 23 March the index had fallen a further 24.9%, leaving the holder 33.9% under the record.
Then the picture flipped. Say the seller waited for the record before buying again. That came on 18 August, 120 sessions after the trigger, so the seller paid at least 13.7% more than the sale price. The holder simply stood back at the record. A year after the trigger, the index closed 27.9% above the trigger close.
Buying back near the 23 March low would have beaten holding. Yet that low looks obvious only in hindsight. In short, the sale paid only if a second, lucky call followed it.
What 29 S&P 500 episodes show
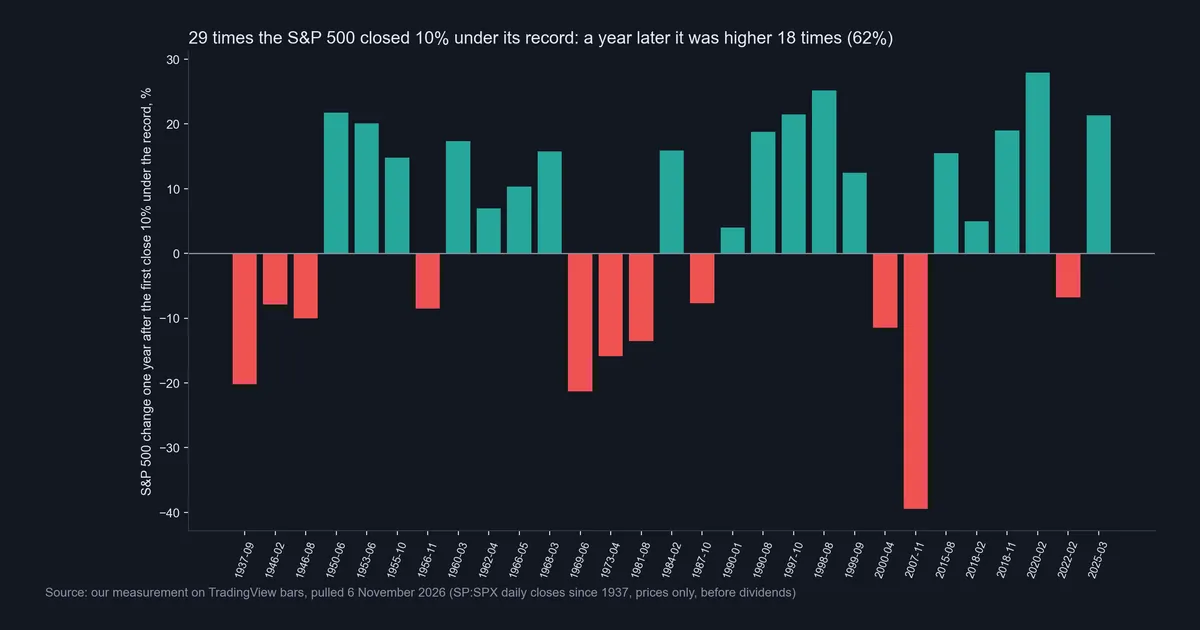
Each bar is one -10% episode, read 252 sessions later: teal for higher, red for lower. Eighteen of 29 stood higher a year on, or 62.1%, and 20 of 28 stood higher after three years, or 71.4%. The March 2025 episode has no three-year result yet.
The median one-year change was +10.3%. Still, the fall rarely stopped at the trigger. The median further fall was 9.9%, and 48.3% of episodes fell at least another 10% first. The median wait for the record was 221 sessions, close to a year.
| Trigger | Episodes | Higher 1 year on | Higher 3 years on | Fell another 10% first | Median sessions to record |
|---|---|---|---|---|---|
| S&P 500 -10% | 29 | 62.1% | 71.4% | 48.3% | 221 |
| S&P 500 -20% | 13 | 69.2% | 84.6% | 38.5% | 447 |
| S&P 500 -30% | 7 | 71.4% | 85.7% | 57.1% | 1,126 |
| Bitcoin -30% | 8 | 37.5% | 42.9% | 75.0% | 208 |
| Bitcoin -50% | 6 | 40.0% | 40.0% | 66.7% | 665 |
Deeper triggers favoured holding a little more, but with far fewer cases. At -30% only seven episodes exist, and the median wait was 1,126 sessions, about four and a half years.
Deeper falls, and Bitcoin beside them
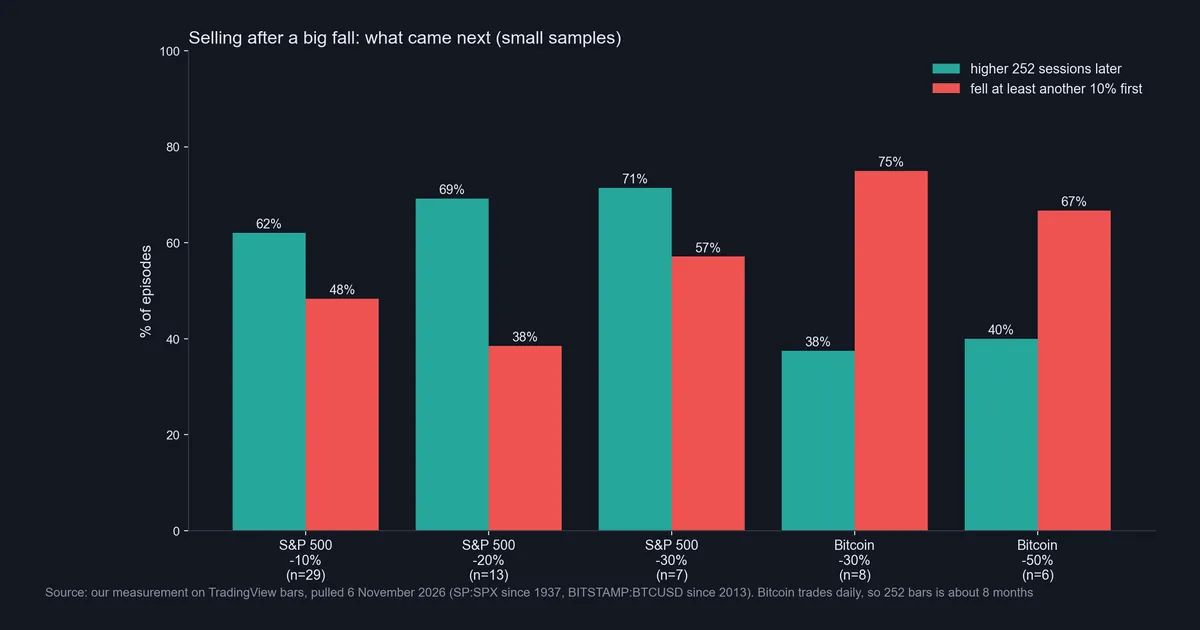
On the S&P 500, the teal bar beats the red one at every depth. On Bitcoin the order flips. At -30%, only 3 of 8 episodes stood higher 252 bars later, and 75.0% fell another 10% first. At -50%, 2 of the 5 with a full 252 bars stood higher. A sixth began on 5 June 2026 and has not ended: Bitcoin has not closed back at its 6 October 2025 record of 124,728. One -30% episode, from 20 November 2025, also remains open.
So a rule that favoured holding an index failed on Bitcoin. Five or eight cases prove little, and we draw no law from them.
At the last close in our pull, 5 November 2026, the S&P 500 sat 5.95% under its record close, after a 4.4% fall that day. No episode has started on our rule, and we make no forecast.
Download the complete indicator database
Put these concepts on your charts. One email unlocks the full library of 1,380+ indicators with compiled MT4 and MT5 files, plus my TradingView scripts. No paywall, no spam, unsubscribe any time.
Get free access to my indicator database
One email unlocks 1,380+ free MT4, MT5 and TradingView indicators — the complete library. No single-tool download; you get the whole database.
Where it fails
First, the sample is small. Twenty-nine episodes in 89 years is not much, and the three depths share the same crashes. Overlapping windows also mean the results do not count as independent tests.
Second, holding did fail, and badly. The April 2000 trigger stood 11.5% lower a year later and 32.3% lower after three years. November 2007 stood 39.5% and 14.8% lower. The record took 1,789 and 1,343 sessions to return, and after September 1937 the wait ran to 2,053 sessions.
Third, holding needs money you will not need. Investor.gov’s page on assessing your risk tolerance ties riskier holdings to a longer time horizon. A holder who must pay rent, or who gets a margin call, becomes a forced seller. Our page on leverage risk shows how fast borrowed money ends a hold.
Fourth, an index changes its members, and the same Britannica entry mentions additions to and deletions from the list. One stock or one coin has no such reset.
Fifth, we used prices only. Dividends would have helped the holder, while costs and tax hurt both sides. We measured neither.
Bitcoin in 2022 and the index in 2018: two more cases
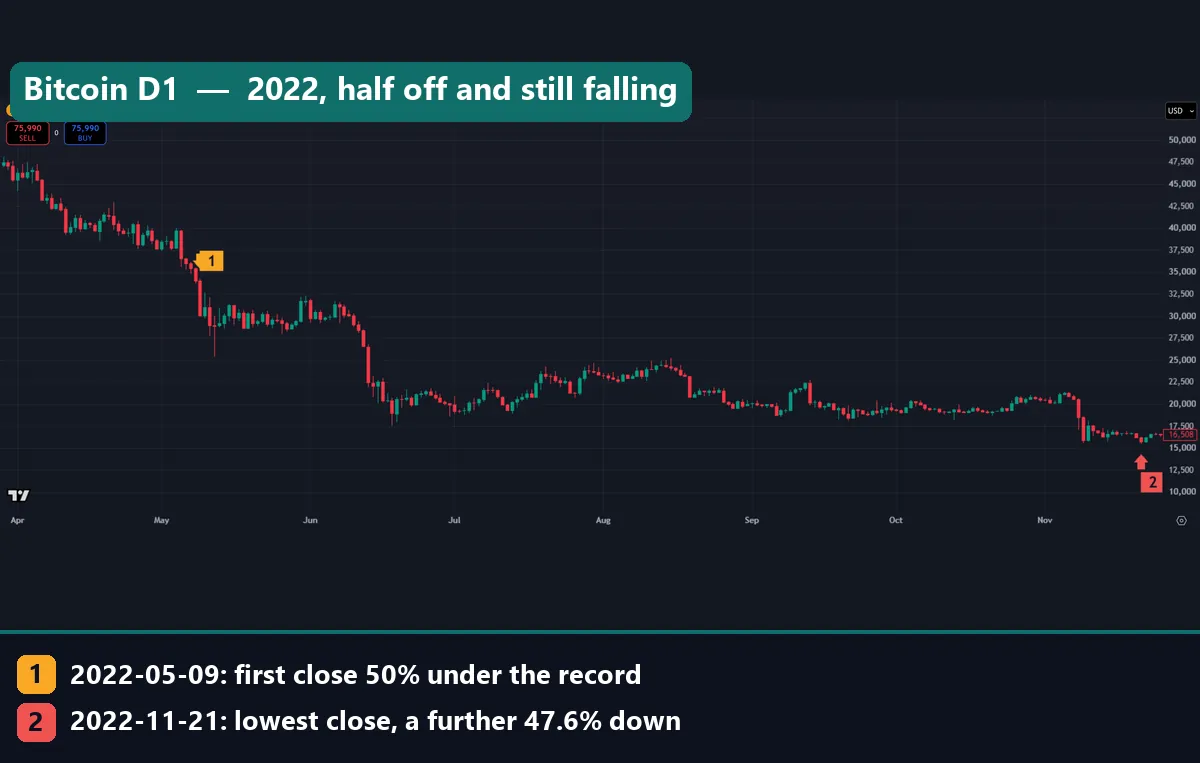
Bitcoin in 2022 shows why the index result does not travel. The record close was 67,559 on 8 November 2021. On 9 May 2022 the coin closed at 30,082, the first close 50% under it. A holder then sat through a further 47.6% fall, to 15,766 on 21 November, or 76.7% under the record. The chart shows two steep legs, in mid-June and early November.
About 8.3 months after the trigger, the price stood 29.6% lower. The CFTC’s advisory on the risks of virtual currency warns of volatile swings and flash crashes in these cash markets. Bitcoin regained the record on 4 March 2024, 665 bars after the trigger.
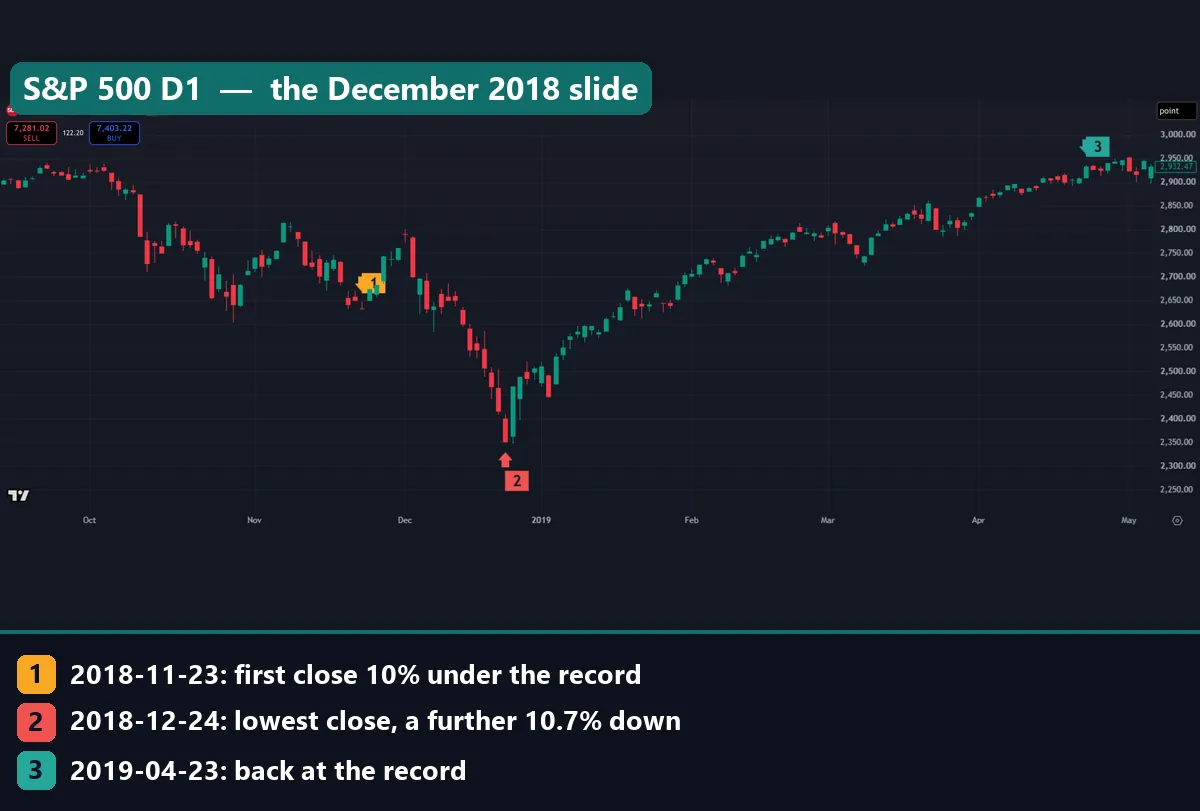
The 2018 index case sits at the other end. After the 23 November trigger at 2,632.56, the lowest close came on 24 December, a further 10.7% down. A late-October dip near 2,641 stopped 9.9% under the record, so our rule missed it. On 23 April 2019 the index closed back at the record, 101 sessions after the trigger.
Common mistakes behind paper hands
- Selling with no way back in. At -10%, buying back at the record cost at least 11.1%. In 2020 it cost 13.7%.
- Reading the index record as true for everything. At -30%, Bitcoin stood higher 252 bars later in only 3 of 8 episodes.
- Chasing the rebound. Buying back in a rush near the record locks in the round-trip cost, as our page on FOMO in trading explains.
- Holding on borrowed money. Diamond hands on margin can end in a forced sale at the low. Our guide to drawdown in trading shows what a deep fall does to an account.
Where to go next
None of these pages tells you when to sell or buy.
- Market correction: what the 10% line means on a stock index.
- Bullish or bearish: the 20% rule, and why it names a turn only after it.
- BTFD meaning: the mirror image, buying right after a fall.
- Recovering from a drawdown: the climb back after a loss.
- Keeping a trading journal: write down why you sold.
- Forex vs crypto trading: how the two markets differ.
Our four outside sources sit in the sections above: Dictionary.com, Britannica, Investor.gov and the CFTC.
FAQ about paper hands
What does paper hands mean?
It is slang for selling at the first sign of trouble, often in a sharp fall. Diamond hands is the opposite: holding through the fall. Neither is a formal market term.
Where does the term come from?
Dictionary.com traces diamond hands to Reddit’s WallStreetBets forum, with use since at least 2018. It gives paper hands as the opposite term.
Is selling during a crash always a mistake?
No. In our S&P 500 test, 11 of 29 triggers at -10% stood lower a year later, including April 2000 and November 2007. On Bitcoin, most episodes stood lower 252 bars on.
How long did the S&P 500 take to regain its record?
The median wait was 221 sessions after a -10% trigger, 447 after -20% and 1,126 after -30%. The longest wait at -10% ran 2,053 sessions, from 1937 to 1945.
Does the paper hands test apply to forex?
We did not test currency pairs here. In a pair, one currency gains when the other loses, so the index’s long upward drift has no simple match.
Is a stop loss the same as paper hands?
No. A stop loss is an exit you choose before the trade, sized to your account. Paper hands means an unplanned sale in the heat of a fall.
Why did Bitcoin give a different answer?
Its falls ran deeper after the trigger. At -30%, the median further fall was 32.0%, and 75.0% of episodes fell another 10% first. A single asset also has no list of members to refresh.
Is holding through a fall a safe choice?
Not on its own. It needs money you will not need, no forced sale and a market that recovers. Our figures cover one rule on past prices, before costs and dividends, so results are not guaranteed; past performance is not indicative of future results.
Last updated: 6 November 2026.

About the author
Written by Dominic Walsh, a Forex trader and MT4/MT5 indicator, Expert Advisor and script developer. Every tool on forexmt4systems.com is tested on live charts before release and ships with ready-to-use compiled MT4 (.ex4) and MT5 (.ex5) files. Learn more about the trader and developer behind this site.
How we build, test and correct every tool: Editorial & Testing Policy. Trading carries risk; see the disclaimer.