
The descending triangle pattern is taught as a bearish setup: a flat bottom, falling highs, then a break lower. This guide settles whether that direction call survives when a fixed rule finds the patterns. Our rule found 62 daily patterns on 23 forex pairs, and only 46.8% broke down first. So the textbook direction came second, narrowly. Below are the rule, the count and five charts, plus the reasons 62 cases cannot close the question.
What a descending triangle pattern is
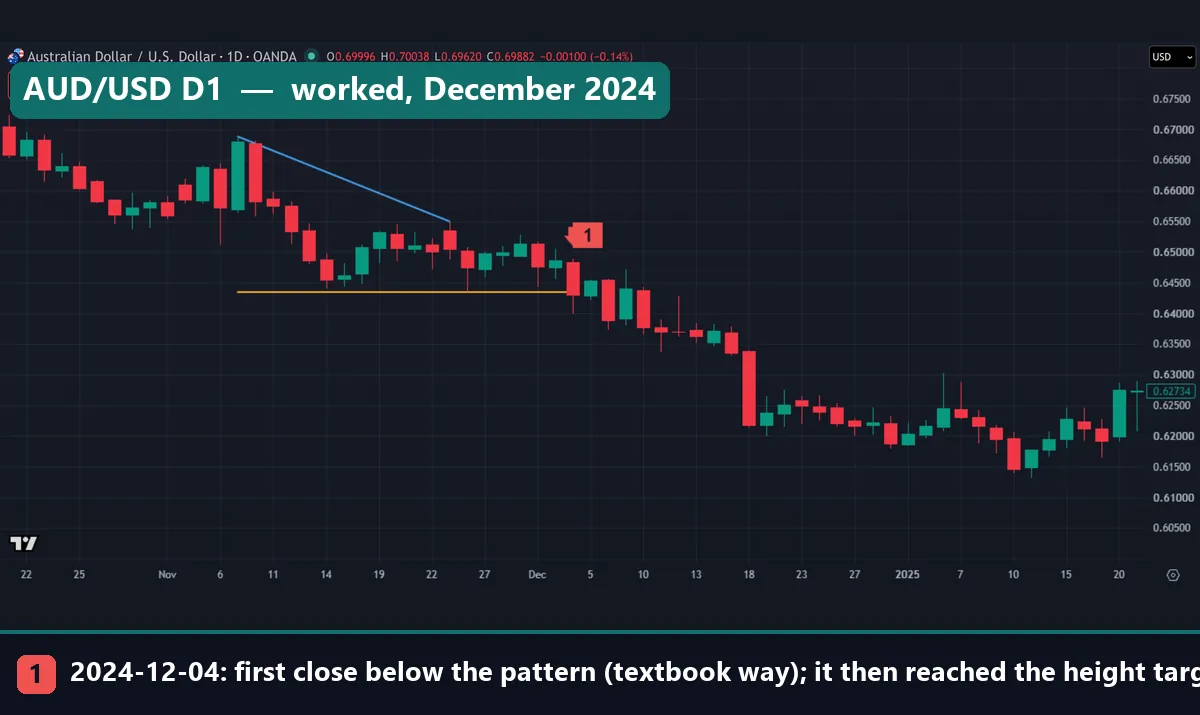
Picture a floor and a lowering ceiling. Price keeps stopping near one level on the way down, and that level forms the floor. Meanwhile, every rally peaks below the last, so the ceiling tilts toward it. In the AUD/USD chart above, the gold line is the floor and the blue line is the ceiling.
StockCharts ChartSchool’s descending triangle page gives the textbook view. It calls the shape a bearish formation, usually a continuation in a downtrend, and asks for two or more comparable lows and two or more declining peaks.
A bearish flag or a bull flag is also a pause, yet its edges stay parallel. Here the floor and ceiling must meet, which puts a clock on the range. Our page on triangle pattern types compares the whole family, and rising wedge versus ascending triangle handles a common mix-up. This guide is the measured one.
How the shape is meant to work
The textbook reads it as supply against demand. ChartSchool describes the floor as if a large buy order sat there and slowly got filled. Once that order runs out, support gives way. We can’t see such orders on a spot forex chart, so this stays a story.
The picture fits the opposite story too. A floor that holds several times shows buyers at that price. Also, each lower high brings the upside trigger closer, so a modest rally can clear it. Thomas Bulkowski’s descending triangle page on The Pattern Site says the breakout can go either way. He reports upward 53% of the time, with stocks in his examples.
The projection takes three lines:
height = first falling high - flat bottom
down break: target = break close - height; failure level = last falling high
up break: target = break close + height; failure level = flat bottom
ChartSchool subtracts the widest distance from the support break, whereas Bulkowski first scales the height by a published percentage. We start from the break close, because anyone can check a close. As with other measured move targets, the height describes the past, not the next move.
How we tested the pattern
Code found every pattern, so nobody could pick the tidy ones. Daily bars come from MetaTrader 4, build 1471: Capital Point Trading history on 23 FX pairs, 12 June 2018 to 24 August 2026 at its widest. That terminal has been offline since late August 2026, so the window ends there. Histories differ by pair, from 296 to 2,064 days. About 37,700 daily bars gave just 62 patterns, so the rule fires rarely.
The hourly set is far smaller: EUR/USD from 22 December 2025 to 26 August 2026, GBP/USD and USD/JPY to 13 August, and gold from 1 July 2025 to 20 August 2026. All figures exclude spread, swap, financing and commission. Our editorial testing policy explains how we report tests.
We drew the price charts on the TradingView web chart, using OANDA daily bars and the same rule. Every price quoted matches our stored bars. The box at the top of each capture shows the capture-day quote, so ignore it.
Only AUD/USD and USD/CHF are also among the 62. GBP/USD’s MT4 history stops on 14 August 2026, too soon for the follow-up bars. EUR/USD did not qualify on MT4, since that feed has no bar for 14 June 2024, one of its floor touches. Gold isn’t in the daily FX set at all.
The rule, setting by setting
A triangle stays a loose idea until someone writes it down. This table holds our reading, and it is only one reading. ATR(14) is the average true range over 14 bars: see what ATR is in trading, or the iATR entry in the MQL4 Reference for the platform’s own function.
| Setting | Our value | Why it is there |
|---|---|---|
| Swing | Extreme bar with 3 bars either side | Known only 3 bars later |
| Floor | Swing lows within 0.35 ATR(14) of the lowest | Lows rarely match exactly |
| Floor spacing | First and last touch 5 or more bars apart | One dip is not two tests |
| Look-back | 40 bars | Old swings drop out |
| Ceiling | 2 or more lower swing highs, down 0.5 ATR or more | Rules out a rectangle |
| Height | First falling high minus floor, 1.5 to 10 ATR | Screens out noise and huge ranges |
| Break | First close below the floor or above the last high | A wick changes nothing |
| Target | One height from the break close | The measured goal |
| Failure level | Last high after a down break, floor after an up break | The pattern’s other side |
| Time limit | 40 bars | Then it scores “neither” |
| Same-bar tie | Failure counts first | Doubt goes against the pattern |
Median height came to 4.05 ATR on daily bars and 5.28 ATR on hourly bars, so these are wide patterns. Change any setting and the list changes. Bulkowski, for one, wants three touches on one line and two on the other.
Reading it on a chart
Begin with the floor. Mark two or more lows close together, then check that the highs above them step down. After that, wait for a close outside the shape. Our blue line stops at the last high, so an up break means a close above that high’s price.
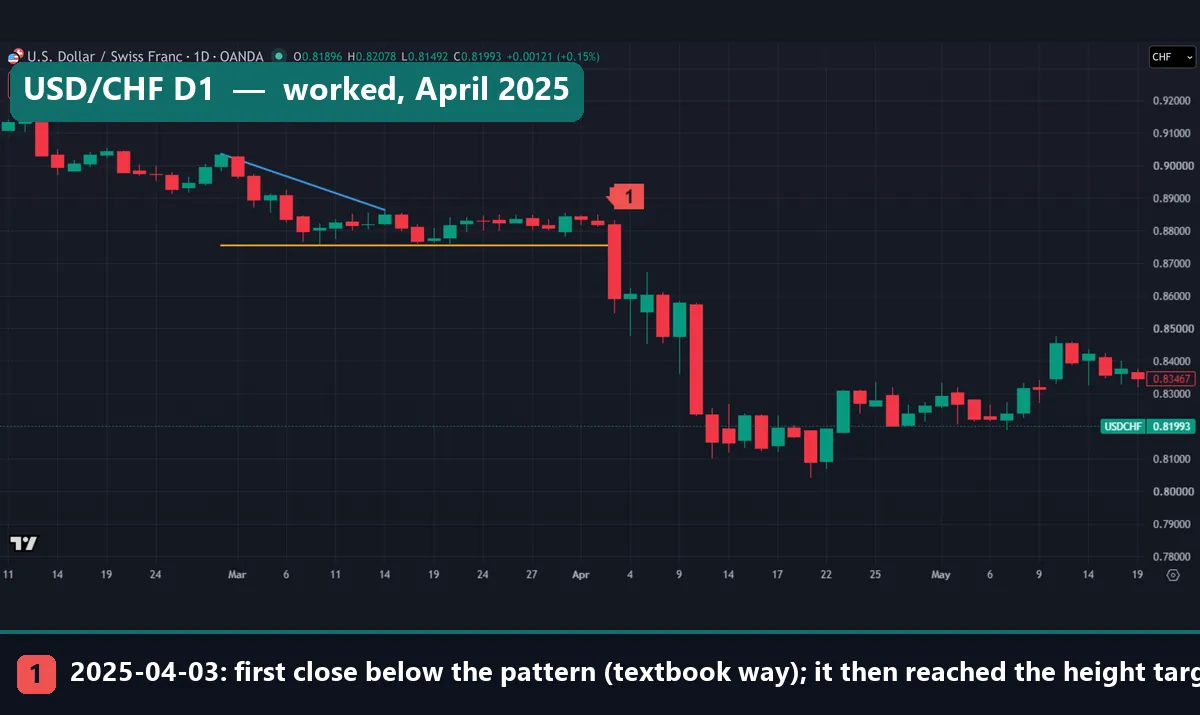
USD/CHF did what the textbook says. The floor sat at 0.87558, and the highs fell from 0.90362 to 0.88640. Then, on 3 April 2025, price opened at 0.88200 and closed at 0.85922. That put the target at 0.83118, and the low of 0.82314 passed it on 10 April, five bars later.
The Bank for International Settlements, in its December 2025 Quarterly Review article on FX markets, ties that month’s sharp dollar fall to US tariff announcements. The triangle gave no warning of that.
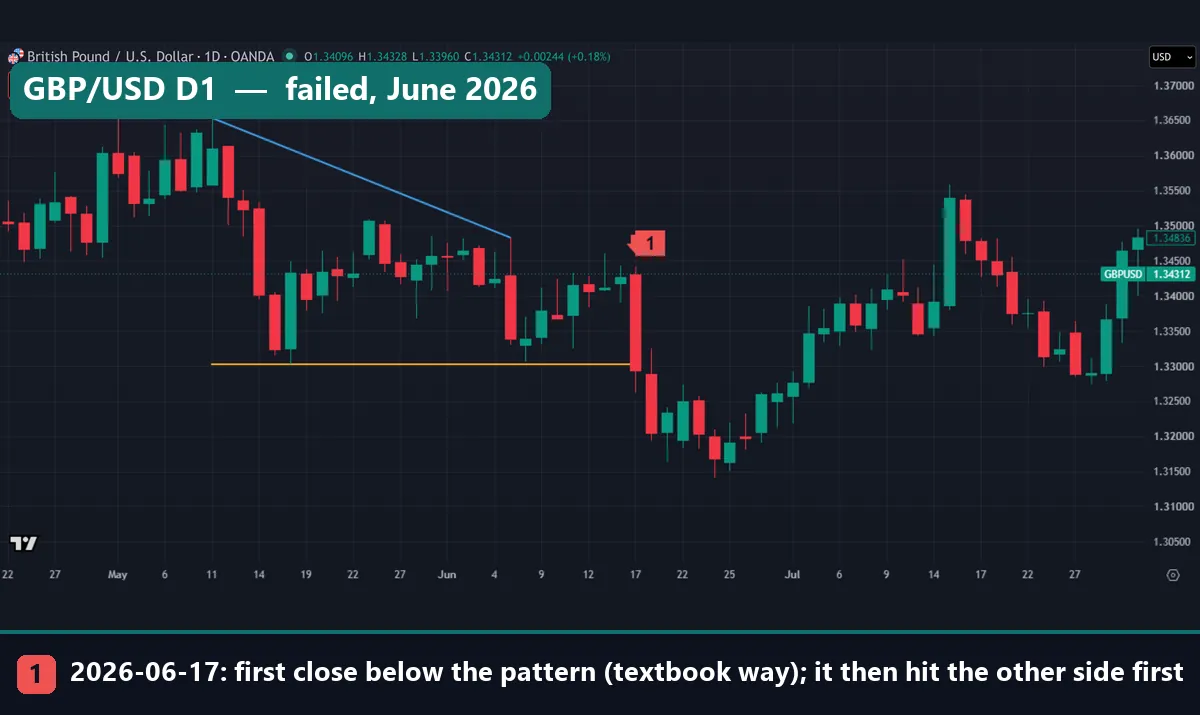
GBP/USD looked just as neat at first. Three highs stepped down from 1.36536 to 1.34832 above a floor at 1.33026. On 17 June 2026 price closed at 1.32942, which set a target of 1.29432. The low of 1.31402 on 24 June stopped well short. Then, on 15 July, 20 bars after the break, the high of 1.35582 went through the failure level.
Ten bars after the break, though, the close of 1.32758 was still lower. So this break counts as “further on” and also as “other side first”, and those two measures can disagree.
Worked example: AUD/USD, December 2024
Here is the first chart, step by step.
- Floor: 0.64342 on 26 November 2024, after 0.64408 on 14 November.
- Falling highs: 0.66880 on 7 November, then 0.65498 on 25 November.
- Height: 0.66880 minus 0.64342 gives 0.02538.
- Break: the close of 0.64300 on 4 December, only 0.00042 under the floor.
- Target: 0.64300 minus 0.02538 gives 0.61762.
- Failure level: 0.65498, which sat 0.01198 above the close.
The next bar closed back above the floor, at 0.64533, so the break looked feeble. That changes nothing here, because only the first close counts. Price then drifted lower, and the low of 0.61721 on 9 January 2025 passed the target, 24 bars after the break. The failure level stayed out of reach.
Now compare the distances. The target sat more than twice as far from the close as the failure level did. A market with no direction touches the nearer line more often, so “other side first” tends to lead here. That count alone can’t condemn the pattern. You also need how far against how often, which is what trading expectancy measures. We measured only which line came first, not profit.
What all 62 daily patterns did
Single charts prove little, so here is the whole set. Of 62 patterns, 29 closed below the floor first and 33 closed above the last high first. That is 46.8% against 53.2%, and one pattern moves either figure by about 1.6 points. So read it as a coin flip. Bulkowski’s 53% upward sits close, but he uses another rule on other markets, so we treat that as coincidence.
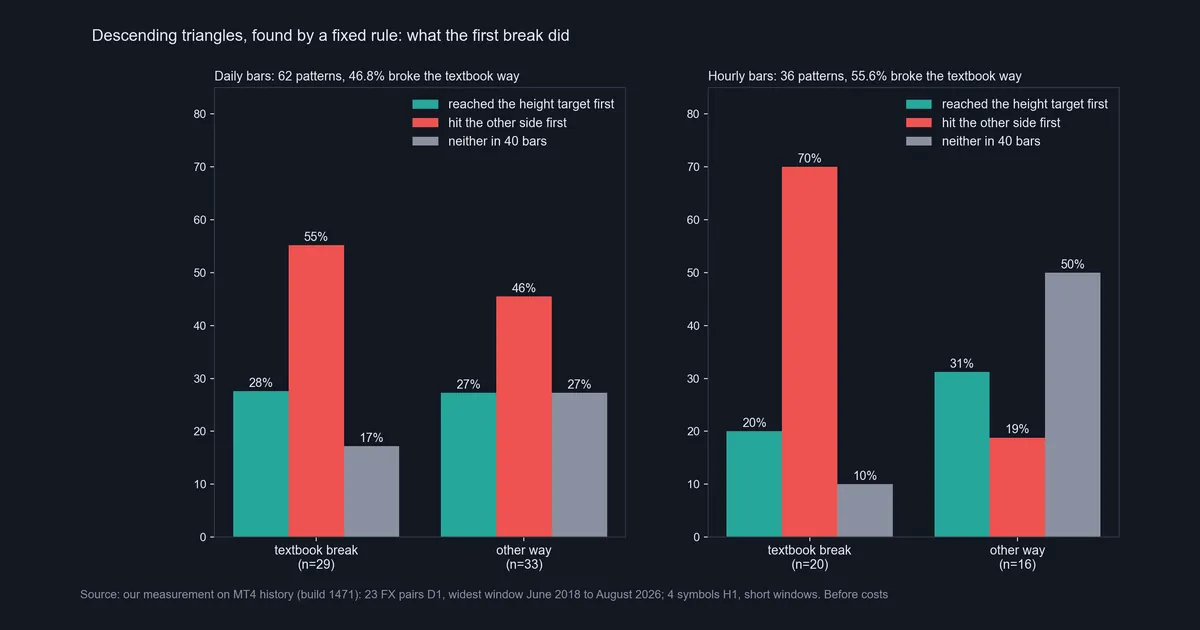
The left panel shows what came next. Of the 29 textbook breaks, the height target came first in 27.6%, the other side first in 55.2%, and neither within 40 bars in 17.2%. After 10 bars, 44.8% stood further on. Of the 33 breaks the other way, the target came first in 27.3%, the other side first in 45.5%, and neither in 27.3%. After 10 bars, 54.5% stood further on.
So down breaks reached their target about as often as up breaks, and fewer than half stood further on. On this rule, the shape told us little about what came next. Still, that isn’t proof the pattern is useless. This is one reading of a loose shape, on FX only, and 62 is a small number, as our page on backtest sample size explains.
Hourly bars and the mirror shape
The right panel uses 36 hourly patterns, and 55.6% broke down first. Those 20 down breaks reached the target first 20.0% of the time and the other side first 70.0%. The 16 up breaks reached the target first 31.2% of the time and the other side 18.8%, and 50.0% touched neither. Each case moves a figure by 5 points or more, so treat these as notes, not findings.
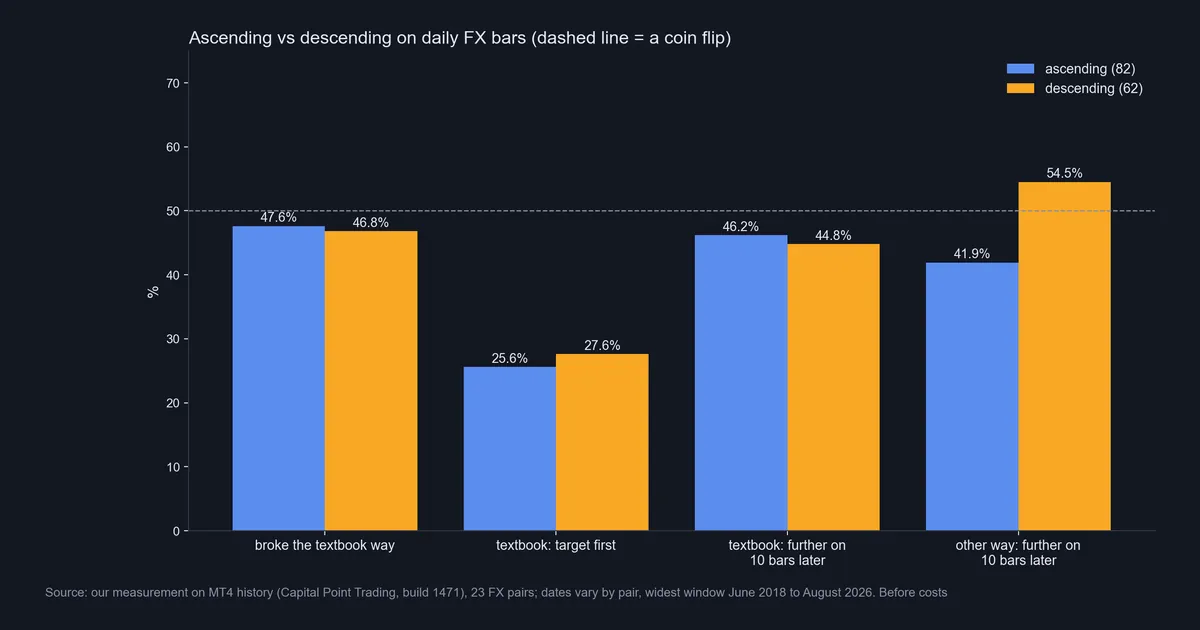
This chart sets the shape beside its mirror image, which our ascending triangle guide covers. The two line up closely: 47.6% and 46.8% broke the textbook way, and 25.6% and 27.6% reached the target first. Only one of the eight bars clears the dashed 50% line: this shape’s breaks against the textbook, at 54.5%.
Download the complete indicator database
Put these concepts on your charts. One email unlocks the full library of 1,380+ indicators with compiled MT4 and MT5 files, plus my TradingView scripts. No paywall, no spam, unsubscribe any time.
Get free access to my indicator database
One email unlocks 1,380+ free MT4, MT5 and TradingView indicators — the complete library. No single-tool download; you get the whole database.
Where it fails
The main weakness is the direction call: the shape says down, yet the first close went up more often than not. Bulkowski himself writes that he found descending triangles hard to trade. Four more limits:
- The shape exists only afterwards. A swing counts once three later bars confirm it, and no pattern has a direction until a close lands outside.
- The feed changes the list. On the US dollar pairs, most patterns matched between MT4 and OANDA bars, yet a few appeared on one feed only.
- Volume is missing. ChartSchool prefers a volume expansion on the break, but MT4 spot history offers tick counts, so we ran no volume test.
- Costs are left out. Holding for up to 40 daily bars adds swap to the spread, as our page on backtesting transaction costs explains.
When the floor held and price left by the top
Both charts below broke upward and then reached their height target. We picked them to show that outcome, so they say nothing about how often it happens.
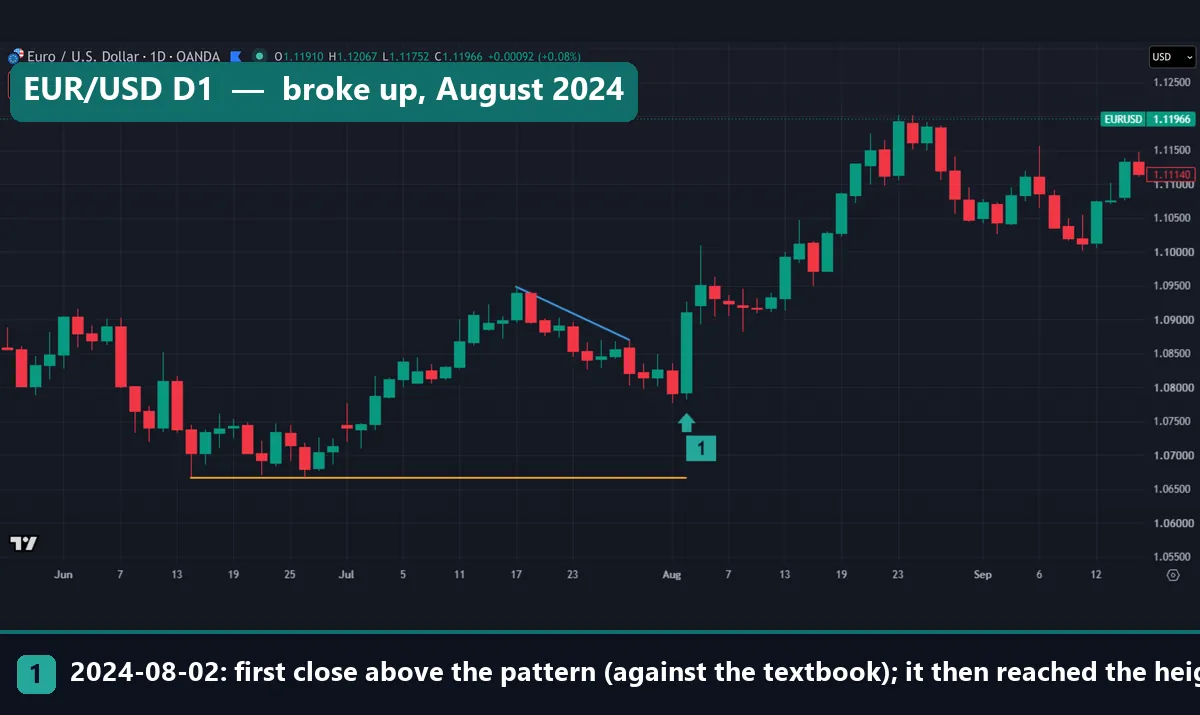
On EUR/USD the floor of 1.06660 dates from June 2024, and the highs fell from 1.09482 to 1.08700 by late July. A close of 1.09111 on 2 August cleared the last high and set a target of 1.11933. The high of 1.12009 passed it on 23 August, 15 bars later. Many traders wouldn’t call this a triangle, since price rallied far from the floor first. Bulkowski warns against that white space, yet our rule lets it through.
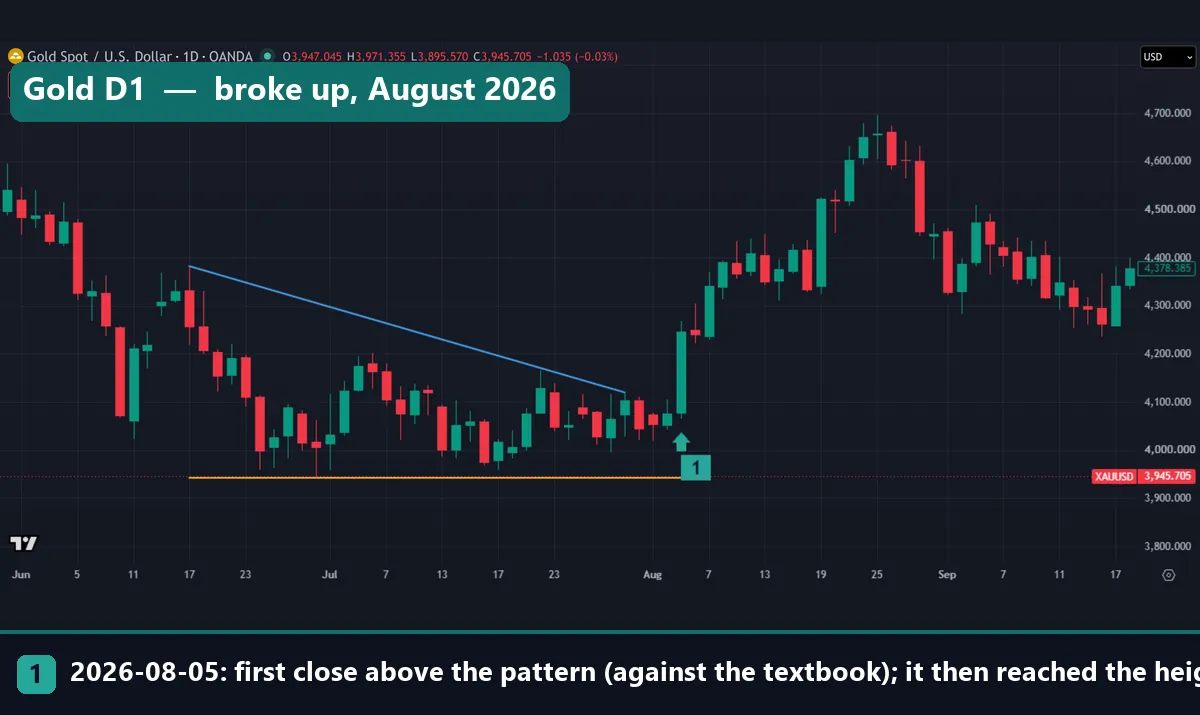
Gold looks far closer to the diagram. Lows near 3,942.10 held through June and July 2026, and four falling highs ran from 4,382.615 to 4,120.495. Yet on 5 August gold closed at 4,247.275, above the last high. Price then passed the target of 4,687.79 on 25 August, 14 bars later. So a neat drawing did not settle the direction.
Four common mistakes
- Selling on the shape alone. Falling highs look like pressure, so people act before any break. Yet 33 of our 62 first closes went up.
- Watching only the floor. EUR/USD and gold both left by the top. So note both exits before either one arrives.
- Treating the target as an appointment. The height target came first in only 27.6% of daily down breaks, and GBP/USD turned 0.01970 short of it.
- Skipping the failure level. A setup needs a price that says the idea was wrong. We used the last high or the floor, and position sizing decides what that distance costs you.
Where to go next
For the moment after a floor gives way, our break and retest strategy guide walks through one common approach. Our page on chart pattern failure covers the same problem across all shapes. Also read the Bulkowski page in full, because it reaches figures of its own.
Then test the rule yourself: write down your settings first, and mark every pattern you find, including those that break up.
FAQ: descending triangle pattern
Is a descending triangle bullish or bearish?
Textbooks call it bearish. On our 23 forex pairs, however, only 46.8% of 62 daily patterns broke down first, so in this test it was close to neutral.
How do you work out the target?
Subtract the flat bottom from the first falling high, then take that height from the break close. On AUD/USD, 0.64300 minus 0.02538 gave 0.61762.
How often does a down break reach its target?
Of 29 daily down breaks, 27.6% reached a one-height target first and 55.2% hit the last high first.
What happens when it breaks up instead?
That was the more common first break on daily bars. Of those 33 cases, 27.3% reached their target first, while 45.5% fell back to the floor first.
How does it differ from a falling wedge?
A descending triangle has a flat lower edge, whereas both edges slope down in a wedge. Our page on the falling wedge pattern covers that shape.
How long does one take to form?
ChartSchool puts the average at one to three months. Our daily rule allows 40 bars at most, which is about two months of trading days.
Is it more reliable on hourly charts?
We can’t say, because 36 hourly patterns over short windows are too few.
Should this pattern alone decide a trade?
We would not let it. Our count found no dependable direction and measured no profit, so treat it as one input with a defined failure level; results are not guaranteed; past performance is not indicative of future results.
Last updated: 3 November 2026.

About the author
Written by Dominic Walsh, a Forex trader and MT4/MT5 indicator, Expert Advisor and script developer. Every tool on forexmt4systems.com is tested on live charts before release and ships with ready-to-use compiled MT4 (.ex4) and MT5 (.ex5) files. Learn more about the trader and developer behind this site.
How we build, test and correct every tool: Editorial & Testing Policy. Trading carries risk; see the disclaimer.