
A break and retest strategy waits for price to close through a level, come back to it, and then hold on the new side before you enter. That is the whole idea. So this guide settles one plain question: does the wait for a retest give you an edge? We coded the rule, ran it on 23 currency pairs of daily MT4 history, and drew the results. The short answer is no clear edge. Still, the details show where the setup helps and where it hurts.
What a break and retest strategy actually is
Every chart has levels that price has respected before. A recent high caps rallies. A recent low holds dips. You can read the basics in our guide to support and resistance explained. A break happens when a candle closes beyond one of those levels. A retest happens when price later drifts back to the broken level and touches it from the other side.
The trade idea comes from role reversal. Old resistance should act as support once price has closed above it. Old support should act as resistance once price has closed below it. So a trader who missed the break gets a second chance at a better price. Also, the trader gets proof of sorts, because the level held on the first test from the new side.
The method has many names: breakout pullback, retest entry, flip trade. They all share the same three steps. First a level, then a close through it, then a return that fails to push back. Our supply and demand strategy guide covers a related idea with zones instead of single lines.
How the break and retest works, step by step
There is no single formula, so we had to pin one down. We used the highest high or lowest low of the last 20 bars as the level. That is the same line a 20-bar Donchian channel draws; see the Donchian Channels help page on TradingView. In code, MetaTrader finds that bar with a function like the one in the iHighest reference in the MQL4 docs.
Next, we needed a break. We asked for a daily close beyond the prior 20-day high or low. A wick through the line did not count.
Then came the retest. Within 10 bars, price had to come back to within 0.25 ATR of the broken level. It also had to close back on the break side. If any bar closed 0.5 ATR or more through the level, the setup was void. ATR is the average true range; our page on what ATR measures in trading explains it.
In short, the logic reads like this:
level   = highest high of prior 20 bars (or lowest low)
break   = close > level   (short: close < level)
retest  = within 10 bars, low <= level + 0.25*ATR
          and close > level   (no close 0.5*ATR through)
entry   = next bar open
stop    = retest bar low - 0.1*ATR   (short: high + 0.1*ATR)
target  = entry + 2 * (entry - stop)
How we tested the break and retest
We ran the rule on MetaTrader 4, build 1471, using daily history from Capital Point Trading. The test covered 23 forex pairs from 12 June 2018 to 24 August 2026. The list runs from AUDCAD to USDJPY and includes all the majors except NZDUSD. Every result is in R, where 1R is the distance from entry to stop. Every result is also before spread, swap and commission.
The chart examples come from the TradingView web chart with OANDA data. We used EURUSD, GBPUSD, XAUUSD and AUDUSD on the daily and hourly charts, plus USDJPY on the hourly. We took the shots on 9 October 2026. The dashed line on each chart is the broken 20-bar level. Marker 1 is the break bar and marker 2 is the retest bar. Our full method is on the editorial testing policy page.
One caveat applies to all of it. A single rule set is one version of the idea. Other traders use swing points, round numbers or trend lines as levels. However, any version still has to answer the same question we asked: does it beat random entries once costs come in?
The rules and settings we used
Here are the parameters behind every number on this page. If you build your own version, change one at a time and keep a log.
| Parameter | Our value | What it does |
|---|---|---|
| Level lookback | 20 bars | Sets the high or low that must break |
| Break rule | Daily close beyond the level | Ignores wicks that poke through |
| Retest window | 10 bars | How long price has to come back |
| Retest distance | Within 0.25 ATR of the level | How close counts as a touch |
| Void rule | Close 0.5 ATR through the level | Cancels a setup that fell back in |
| Entry | Next bar open | Avoids buying inside the retest bar |
| Stop | 0.1 ATR beyond the retest bar | Defines 1R |
| Target | 2R | Fixed reward for each trade |
| Time exit | 20 bars | Closes trades that go nowhere |
A 2R target means you need to hit it on just over one trade in three to break even. You can check that math with our risk reward calculator.
Reading a break and retest on the chart
The GBPUSD daily chart shows a textbook shape. The level sits at 1.33216. On 23 September 2026 a long red candle closed well below it. That is marker 1. Price then went sideways for a week. On 30 September a candle wicked up toward the dashed line and closed back under it. That is marker 2, the retest.
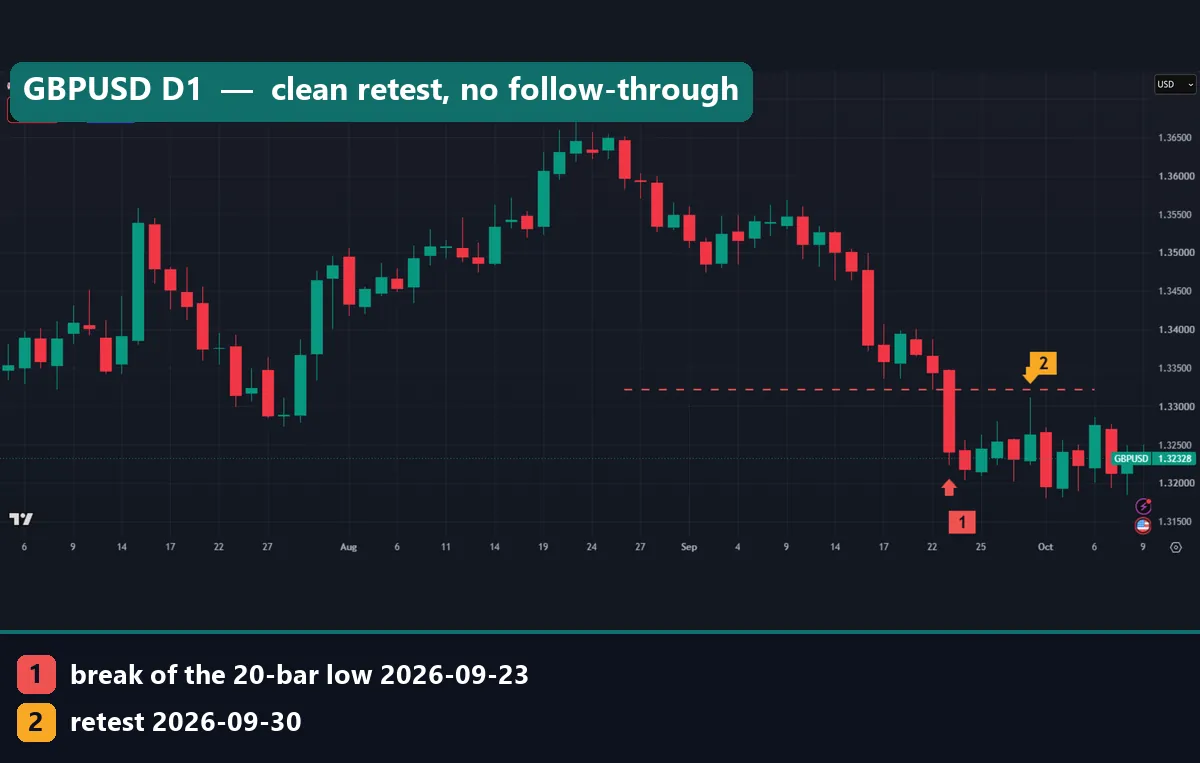
Look at what came next, though. Price did not fall away. Instead it chopped in a narrow band under the level. On 9 October the chart still showed 1.32328, not far below the line. So the shape was clean, but the follow-through never came. That is common, and our numbers later in the guide show why.
The hourly chart tells a faster story. On USDJPY the 20-bar low at 157.853 broke at 00:00 UTC on 8 October 2026. The very next hour retested it. Then a large green candle closed back above the level. The break failed within three bars.
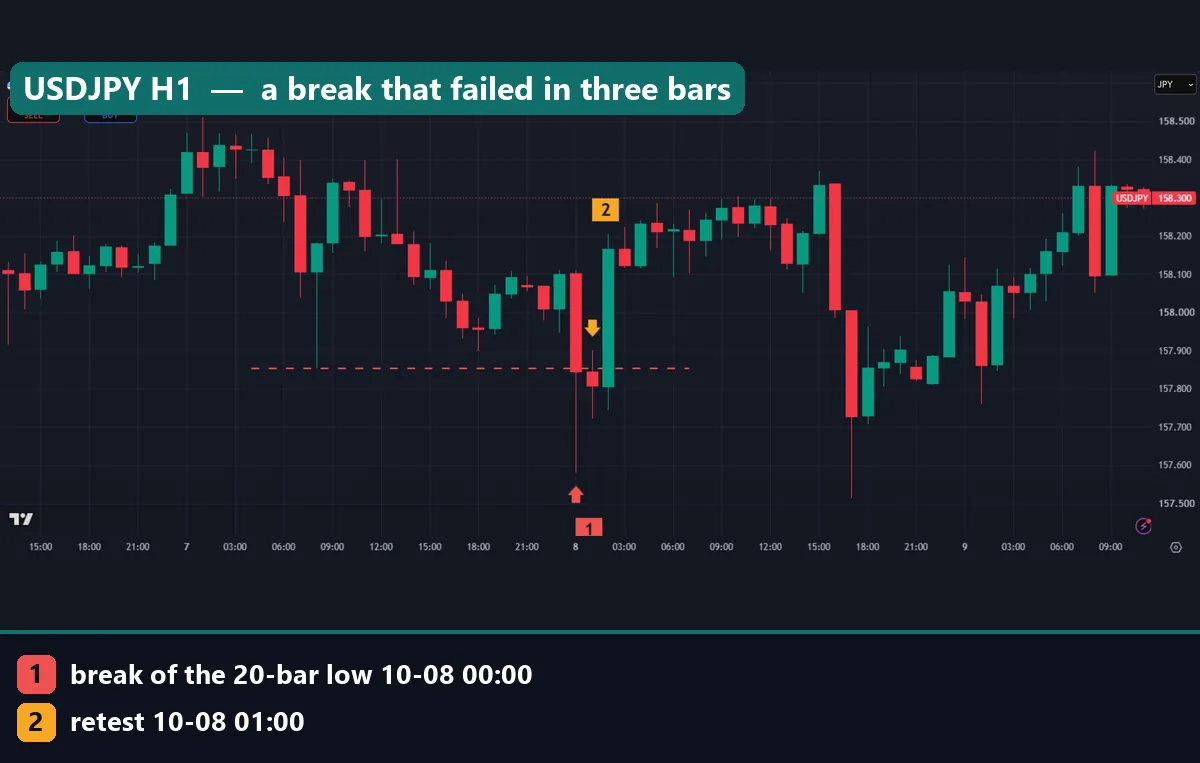
On this chart the yellow arrow points down at the 01:00 retest bar. The lesson is easy to see. On an hourly chart, a 20-bar level is only one day of trading. Breaks of such short levels are cheap, and they reverse often.
Worked example: EURUSD daily, September 2026
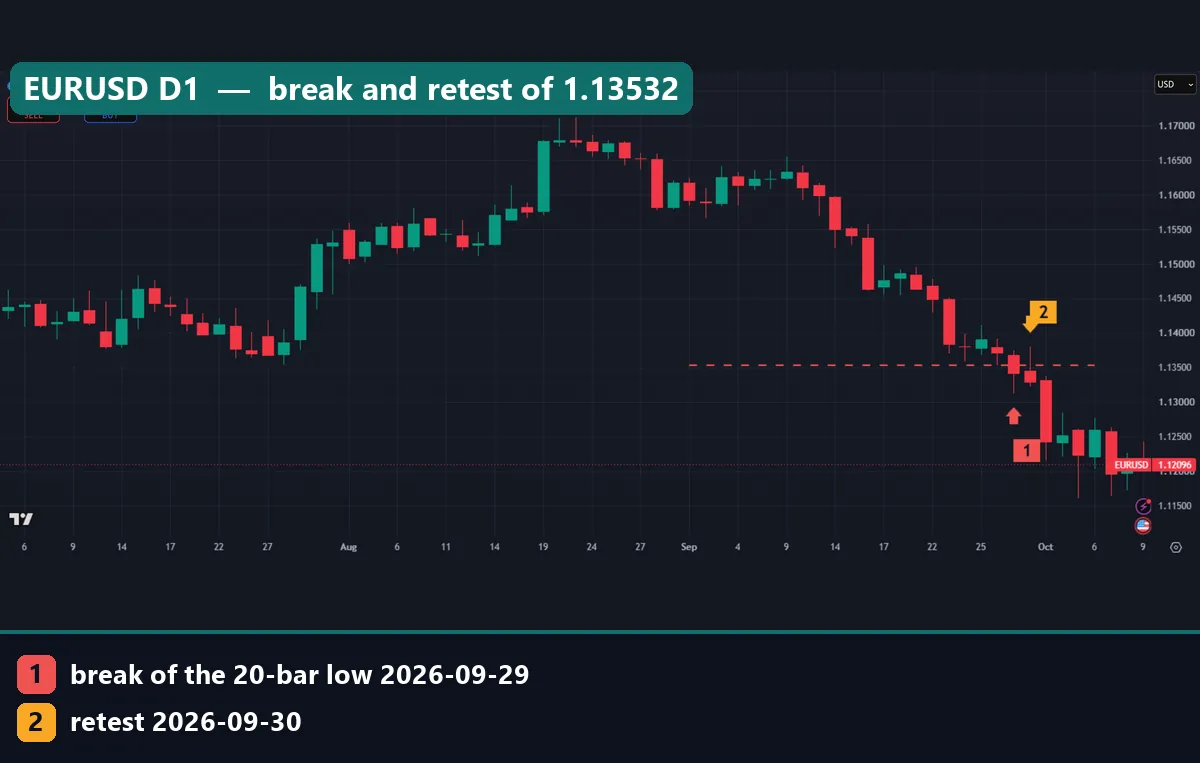
Now go back to the first chart, EURUSD on the daily. Here is how our rule would read it.
- The 20-bar low sat at 1.13532. Price had been falling since mid September.
- On 29 September 2026 a daily candle closed below 1.13532. That is the break, marker 1.
- On 30 September price pushed back up. The candle wicked above the dashed line, then closed below it. That is the retest, marker 2.
- The rule enters short at the next open, on 1 October.
- The stop goes 0.1 ATR above the high of the 30 September candle.
- The target sits two stop-distances below the entry.
On our chart, the 1 October candle fell hard and closed near the 1.125 gridline. Price then hovered around 1.12 into 9 October. So this one moved the right way fast. We do not print the exact R for this trade, because the stop depends on the ATR value on that day.
That said, one good example proves very little. The same EURUSD rule, over our full daily test, lost 9.9R across 76 trades before costs. The next section shows the full sample.
What 1,572 trades showed
Across 23 pairs, the rule took 1,572 trades. It made +25.9R in total before costs. That is about 0.016R per trade. In plain terms, it is close to zero.
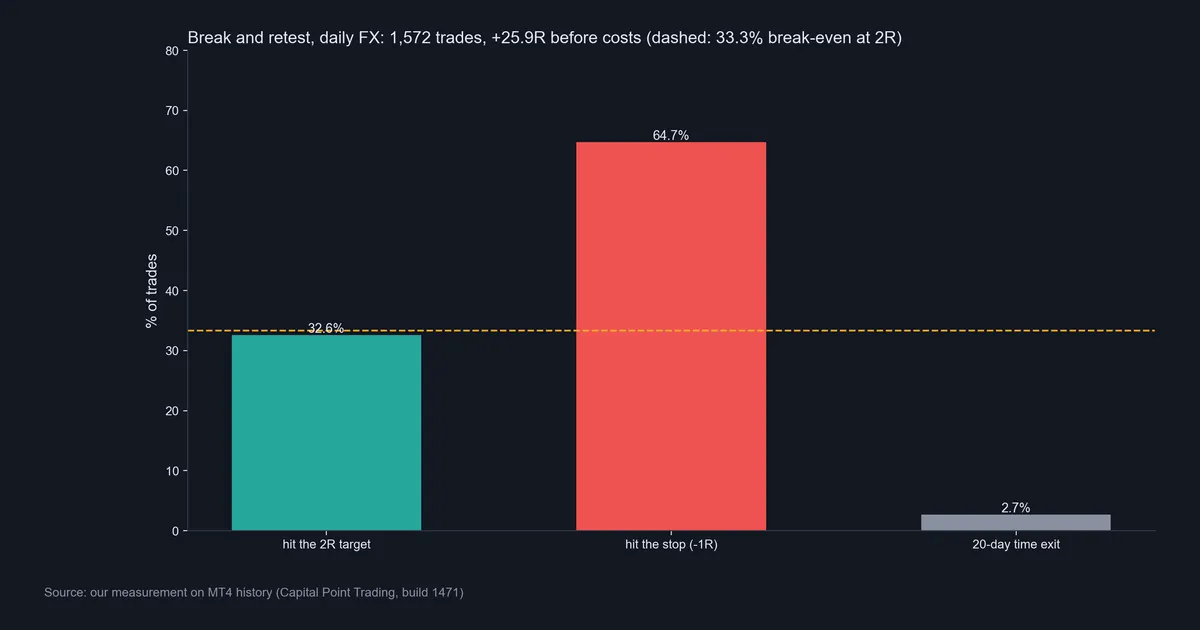
32.6% hit the 2R target. 64.7% hit the stop. The other 2.7% closed at the 20-day time limit. The dashed line marks 33.3%, the break-even point for a 2R target. So the target rate sat just under break-even. The small time exits kept the total slightly positive.
Next, the per-pair chart. Only 12 of 23 pairs finished positive. That is roughly a coin flip. AUDJPY made +20.4R over 80 trades and USDCAD made +20.0R over 70. At the other end, NZDJPY lost 33.4R over 69 trades and GBPUSD lost 16.4R over 78.
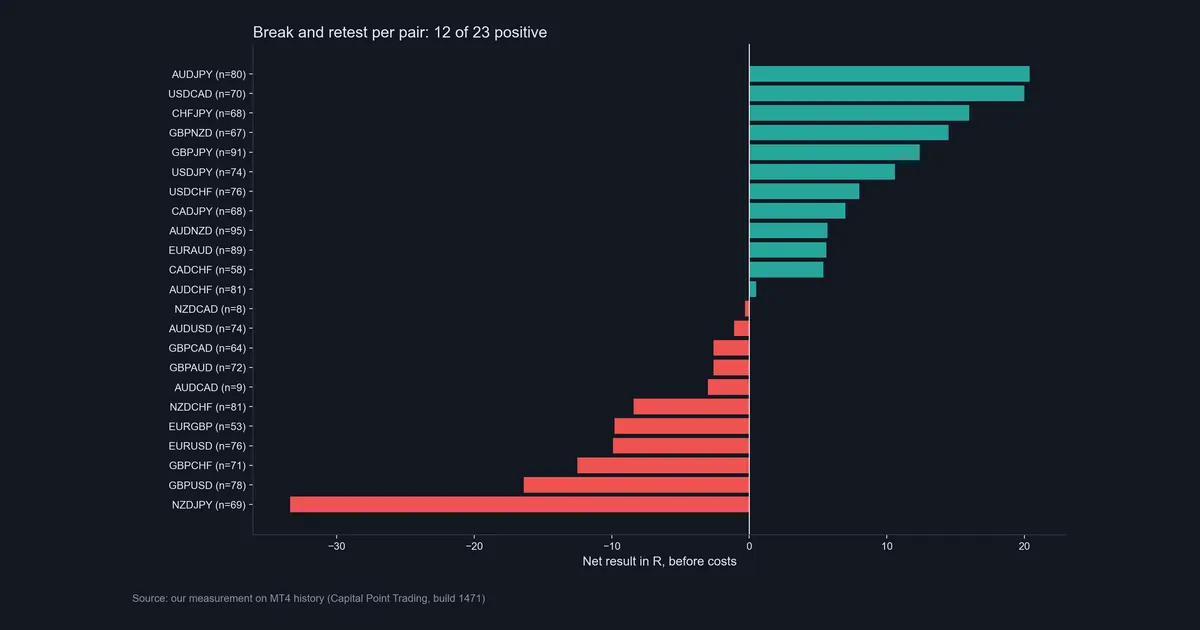
Notice how similar pairs split. AUDJPY and NZDJPY move together much of the time. Yet one sits at the top and one at the bottom. That points to noise, as our guide on backtest sample size explains. Trading only the top five pairs would just fit the past. Our page on curve fitting in trading explains the trap.
Download the complete indicator database
Put these concepts on your charts. One email unlocks the full library of 1,380+ indicators with compiled MT4 and MT5 files, plus my TradingView scripts. No paywall, no spam, unsubscribe any time.
Get free access to my indicator database
One email unlocks 1,380+ free MT4, MT5 and TradingView indicators — the complete library. No single-tool download; you get the whole database.
Where it fails
Here is the plain version. The break and retest strategy, as we coded it, showed no edge on daily forex. The result is close to flat before costs. So after spread and swap, it would likely be negative.
Costs matter more than they look. Our stop sits only 0.1 ATR past the retest bar. On a quiet retest candle, that can be a short distance. A short stop makes 1R small, so the spread eats a larger share of every R. Our guide to transaction costs in backtests walks through the effect.
Second, the retest is not rare. Price comes back to a broken level very often, because markets rarely move in straight lines. So the retest does not filter much. It mostly delays the entry.
Third, the retest can be the start of a full reversal. A move back to the level looks the same whether it will hold or not. You only know after the fact. That is why the stop got hit on 64.7% of trades.
Fourth, short levels fail more. A 20-bar level on the hourly chart is one trading day. Many such breaks are just noise, as the USDJPY chart showed. Finally, our test used fixed rules. Discretionary traders will argue that context improves it. Maybe so, but that claim needs its own test.
Two more charts where the retest led nowhere
Gold on the daily chart shows the stall pattern. The 20-bar low at $4,235.17 broke on 28 September 2026. Price closed near $4,110 that day. On 30 September a candle wicked up toward the line and closed back under it, the retest.
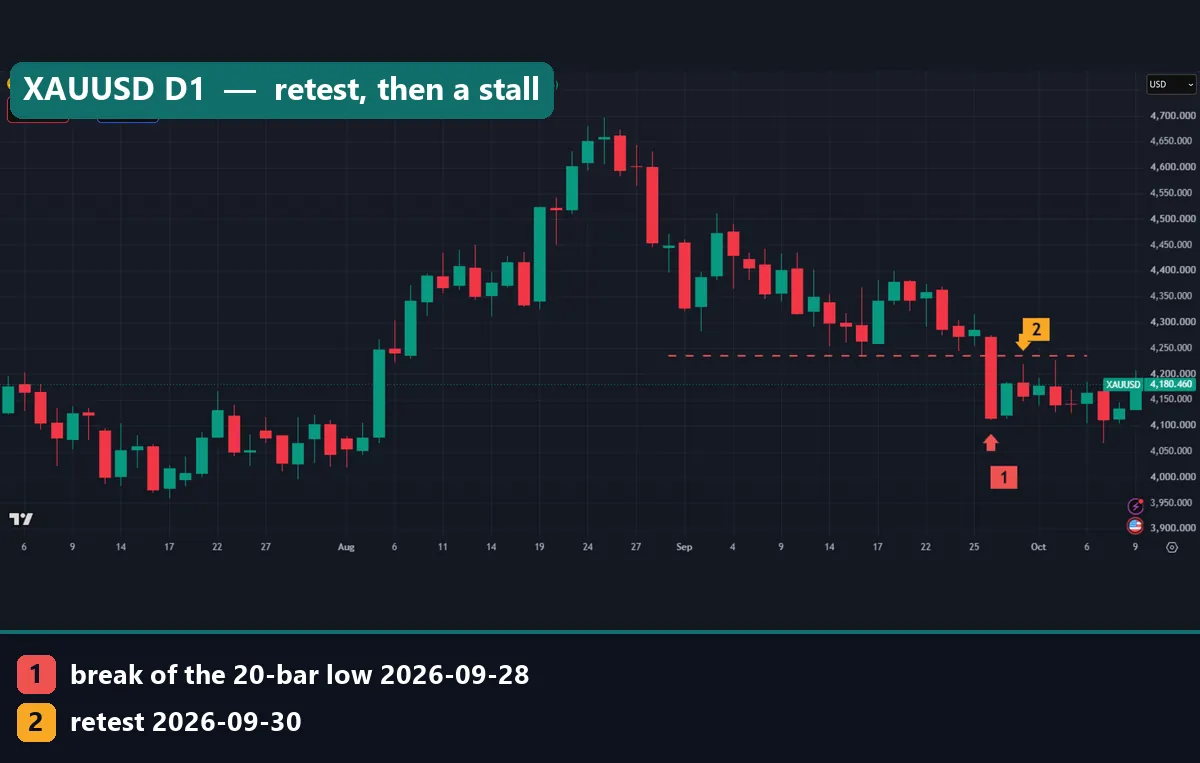
After that, gold went flat. It drifted between about $4,110 and $4,190 for the next week. On 9 October the chart showed $4,180.46. A short from the retest was not stopped on our chart, but it also did not reach anything close to 2R. Under our rule, a trade like this ends at the 20-bar time exit unless one side gets hit first.
The AUDUSD hourly chart shows the long side. The 20-bar high at 0.69789 broke at 05:00 UTC on 9 October 2026. The 06:00 bar came back to it and closed above it. But within a few hours, price sat at 0.69760, below the level again.
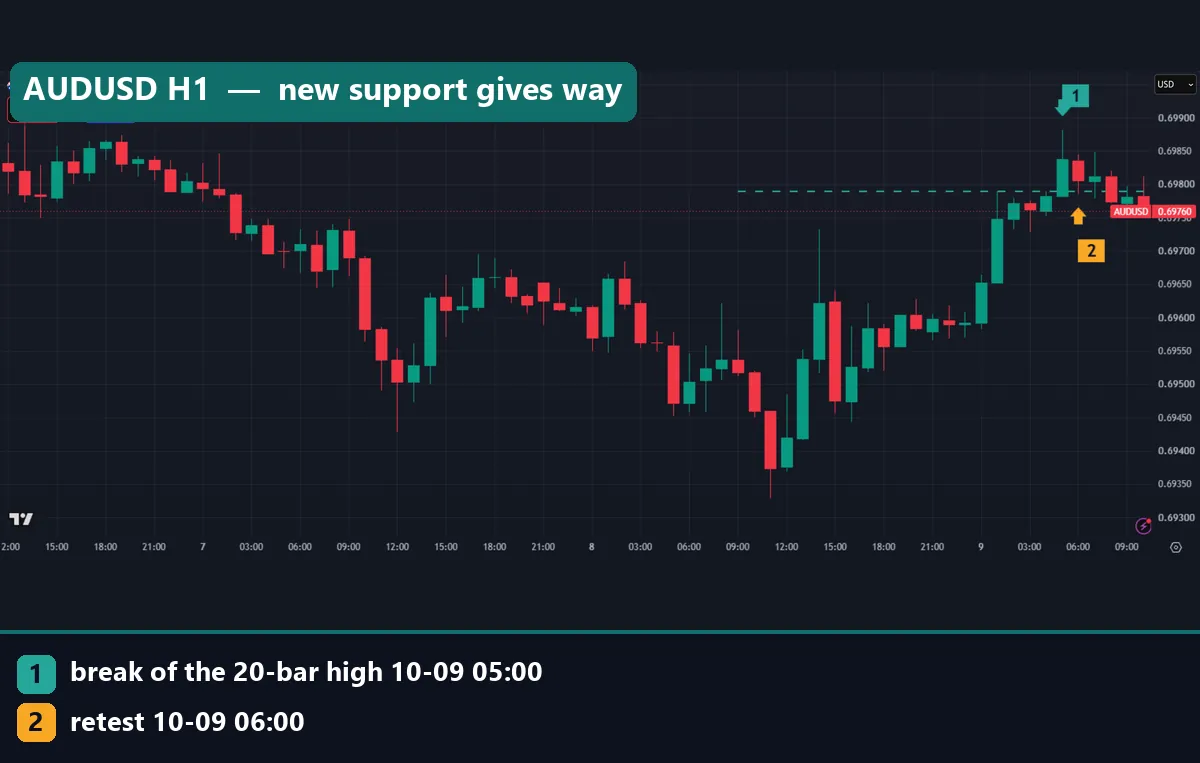
So in the space of five bars, the “new support” had already given way. A trader long from the retest would now be sitting under the entry level. That is the normal life of most retests: a touch, a bounce, and then more chop around the line.
Common mistakes with break and retest trades
These four errors show up again and again. Each one makes the weak raw result worse.
- Counting a wick as a break. A wick through a level shows that price tested it, not that it broke. Wait for the candle to close. Our rule ignored wicks for that reason.
- Calling every bounce a retest. If price closes back inside the old range, the break has failed. Then the setup is gone. Treat a deep close back through the level as a reason to step aside, not to add.
- Moving the stop to “give it room”. A wider stop shrinks the position, but it also changes the math. Decide the stop before entry. Our guide on how to use a stop loss covers the method.
- Trusting a handful of trades. Five clean examples from a chart feel convincing. Yet our 1,572 trades came out near flat. Always test a rule over years and many pairs before you trust it.
Break and retest vs a plain breakout entry
The retest is meant to give a better price than buying the break itself. Also, it lets the trader see the level hold once. Those are fair points. But a better price comes with a cost: many strong breaks never come back. So the retest trader misses some of the best moves and still catches many of the failures.
A plain breakout entry has the opposite problem. It catches every runaway move, but it also buys every fake. Neither entry fixes the core issue, which is that most breaks of a 20-bar level are not special. If you want to compare the two on your own data, our page on how to backtest a trading strategy sets out the steps. Then judge both by trading expectancy, not by how the best trades looked.
Where to go next
If you still want to trade levels, start with good levels. Our page on support and resistance vs supply and demand compares the two ways of drawing them. For a view of how breaks fit into trend structure, read market structure in forex. Also, our trend pullback strategy guide tests a close cousin of the retest idea.
For chart tools, the breakout and retest indicator page shows one way to mark these setups on a chart. The Donchian channel indicator draws the same 20-bar high and low we used.
For outside reading, the support and resistance article at StockCharts ChartSchool covers role reversal in depth. The support and resistance article on Wikipedia gives a short history of the idea.
FAQ about the break and retest strategy
Does the break and retest strategy work?
In our test it did not show a clear edge. Over 1,572 daily trades on 23 pairs, it made +25.9R before costs, about 0.016R per trade. After spread and swap, that small gain would likely vanish.
What timeframe is best for break and retest?
We tested the daily chart in full. On the hourly chart, our examples on USDJPY and AUDUSD failed within a few bars, because a 20-bar hourly level covers just one day. Shorter charts also mean smaller stops, so costs take a bigger share.
How far back should the broken level be?
We used the prior 20-bar high or low. You can test longer lookbacks, such as 50 bars. But change one setting at a time, and judge the result over many pairs, not one.
What counts as a retest?
In our rule, price had to come within 0.25 ATR of the broken level inside 10 bars. It also had to close back on the break side. A close 0.5 ATR or more through the level cancelled the setup.
Where should the stop go?
We placed it 0.1 ATR beyond the high or low of the retest bar. That keeps the stop tight. However, a tight stop makes spread a larger share of each trade, so check costs on your own account.
Which pairs did best in the test?
AUDJPY made +20.4R and USDCAD made +20.0R. But NZDJPY lost 33.4R and GBPUSD lost 16.4R. With only 12 of 23 pairs positive, we read the split as noise.
Is break and retest the same as a role reversal?
Yes, mostly. Role reversal is the idea that old resistance becomes support, and old support becomes resistance. The break and retest trade is one way to act on that idea with fixed entry rules.
Can I use an indicator to find break and retest setups?
Yes. A Donchian channel shows the 20-bar levels, and a breakout and retest indicator can flag the touches. Still, an indicator only marks setups, so test the rules first: results are not guaranteed; past performance is not indicative of future results.
Last updated: 9 October 2026.

About the author
Written by Dominic Walsh, a Forex trader and MT4/MT5 indicator, Expert Advisor and script developer. Every tool on forexmt4systems.com is tested on live charts before release and ships with ready-to-use compiled MT4 (.ex4) and MT5 (.ex5) files. Learn more about the trader and developer behind this site.
How we build, test and correct every tool: Editorial & Testing Policy. Trading carries risk; see the disclaimer.