
A bearish flag is a sharp drop, then a short bounce between two parallel lines. Textbooks say price should then break lower and fall about as far again. We tested that claim on 23 forex pairs. This guide settles how to spot one, how to tell it from a bear pennant or a falling wedge, and what price did after the break. In short, about two in three bear flags broke down, but most of those breaks soon reversed.
What a bearish flag is
A bearish flag, or bear flag, has three parts. First comes the pole, a fast and steep fall. Next comes the flag: a small channel that drifts up against the pole, with roughly parallel edges. Last comes the break, the first close outside that channel.
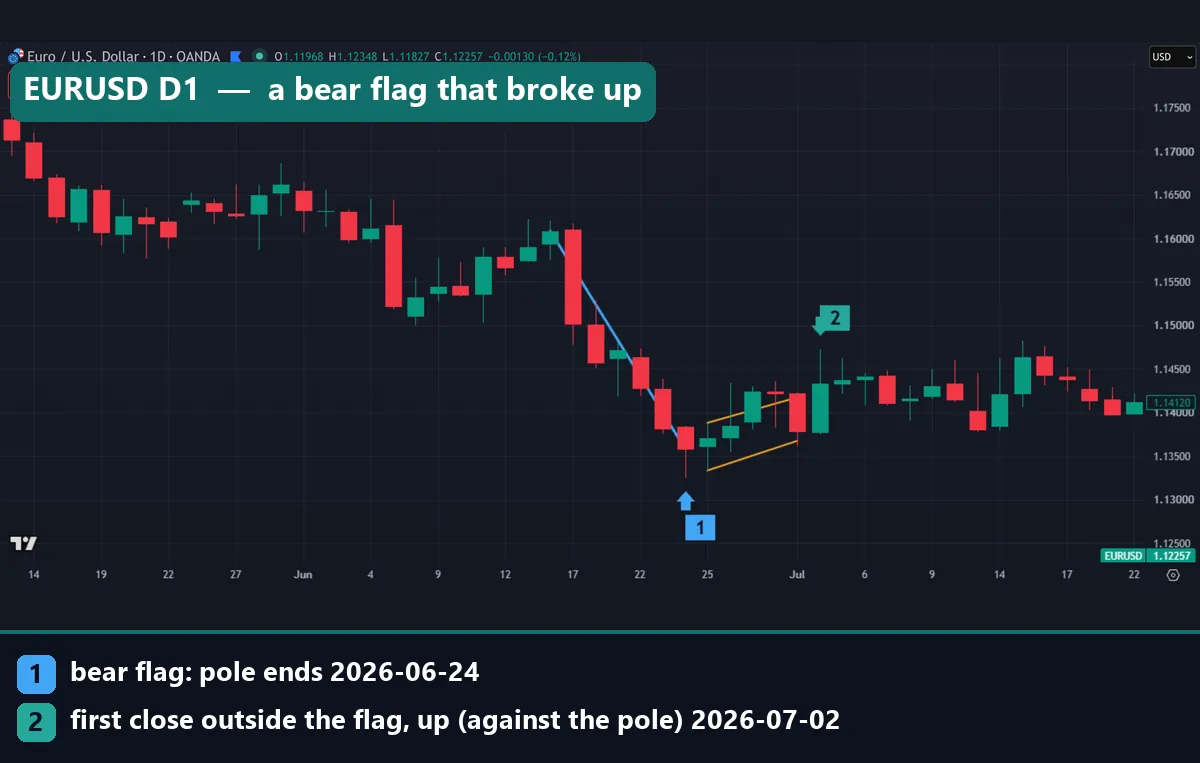
The chart above shows one on EURUSD daily. The blue line is the pole, from 16 to 24 June 2026, and the yellow lines are the flag’s edges. Marker 2 is the first close outside the flag, on 2 July, and it went up, not down.
Textbooks call it a continuation pattern: a pause in a downtrend before the next leg lower. Our flag pattern guide covers both directions, while this one tests only the bearish side.
Bear flag vs bear pennant vs falling wedge
Three shapes get mixed up after a drop, and the edges tell them apart.
- Bear flag. Both edges rise against the pole and run roughly parallel, like a short ascending channel hanging under a fall.
- Bear pennant. The highs fall and the lows rise, so the edges converge. Our bull pennant guide tests pennants in both directions, and our flag vs pennant comparison sets the shapes side by side.
- Falling wedge. Both lines slope down and converge, with no pole needed. Most texts read it as bullish. See our falling wedge pattern guide.
The line between them is thin. Our gold chart below shows a pause that this guide’s rule scored as a bear flag. Our bull pennant guide used a different rule and called the same pause a bear pennant. So write your rule down before you look at the chart.
How a bear flag should work
The usual story runs like this. Sellers drive price down hard. Some then take profit and a few buyers step in, so price drifts up in a tidy channel. When the bounce runs out, sellers return.
The textbook target comes from the pole:
pole = close at the start of the pole - close at its end
bear target = break close - pole
Our guide to measured move targets covers the method. The flag pattern entry at Investopedia puts the classic entry on the day after a close below the lower line. It also offers a nearer target, the flag’s own width, and notes that volume in a bear flag may hold level rather than fade. We tested only the full pole target.
How we tested the bearish flag
We wrote the rule first and let a script find every flag, so we could not pick the pretty ones.
Our statistics come from MetaTrader 4, build 1471, on Capital Point Trading terminal history. We scanned daily bars on 23 forex pairs from 12 June 2018 to 24 August 2026. We also scanned hourly bars on four symbols. EURUSD, GBPUSD and USDJPY start on 22 December 2025 and end between 13 and 26 August 2026. Gold (XAUUSD) runs from 1 July 2025 to 20 August 2026.
The charts come from the TradingView web chart with OANDA daily data, captured on 19 October 2026. We ran the same rule on those bars to find each example. The gold chart is only an illustration, since our daily statistics cover currency pairs.
We placed no trades; we counted what price did next. Every figure is before spread, swap and commission. Forex volume here is tick volume, so we left it out. The full method sits in our editorial testing policy.
Our bear flag rules and settings
A different rule would find different flags, so read our numbers as results for this rule only.
| Parameter | Our setting | Why it matters |
|---|---|---|
| Pole size | The close falls at least 3 ATR(14) | Only sharp drops count |
| Pole window | Within 10 bars | Keeps the drop fast |
| Pole end | The lowest close of the run | Fixes where the flag starts |
| Flag length | 5 to 20 bars, the first length that fits | Short pauses only |
| Flag depth | The whole flag within half the pole | A deeper bounce is not a pause |
| Below the pole | At most 0.25 ATR under the pole bar’s low | A new leg down is not a flag |
| Edge slope | Highs and lows both rise | The flag leans against the pole |
| Parallel test | Slope of the highs over slope of the lows, 0.5 to 2 | Converging edges make a pennant |
| Break | First close outside either extended edge, within 15 bars | Closes count, wicks do not |
| Target | Pole length below the break close, within 40 bars | The textbook measured move |
| Failure | A close above the flag’s highest high first | The setup is void |
ATR, the average true range, gauges normal bar size. See what ATR means in trading, or the iATR reference in the MQL5 documentation from MetaQuotes. Each edge starts at the first flag bar’s high or low and runs at the least-squares slope of the highs or lows. The least squares section of the NIST engineering statistics handbook explains that fit. A fitted line is not a fence, so single candles can poke through it.
Reading a bear flag on a chart
All charts here use the same marks. Blue is the pole and yellow marks the flag’s edges. Marker 1 ends the pole, and marker 2 is the first close outside the flag: green for up, red for down.
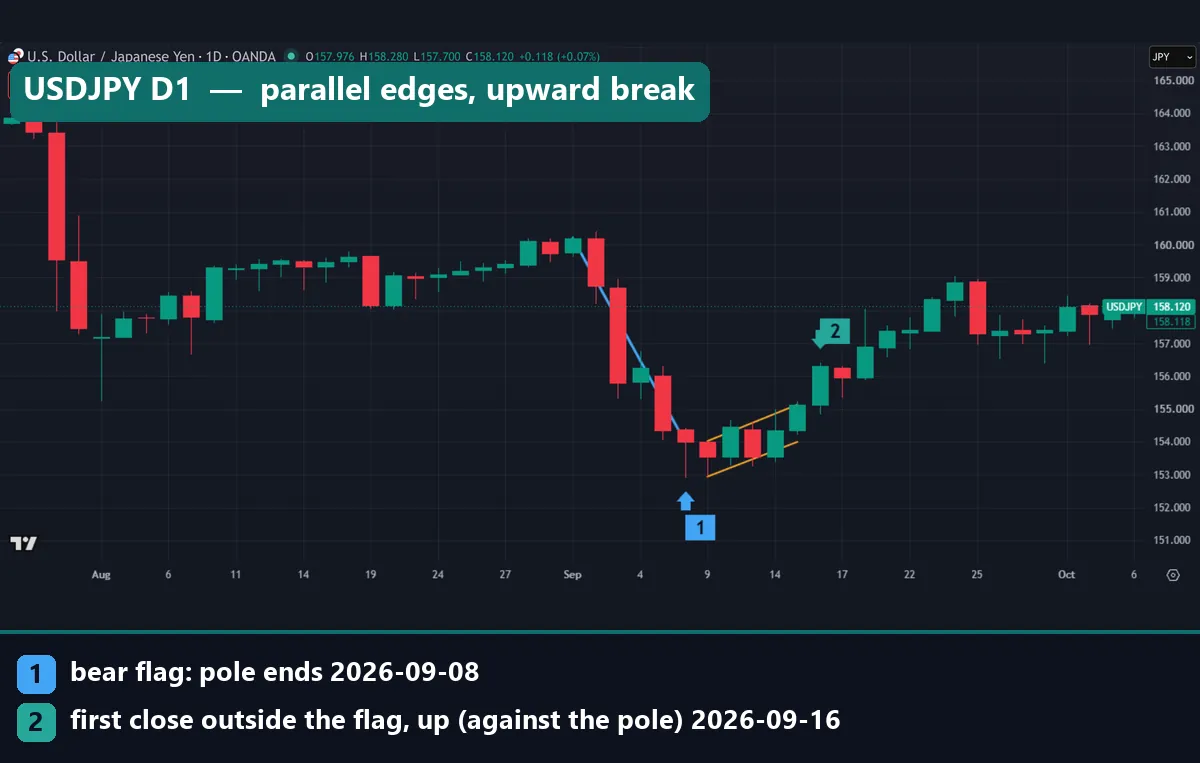
On USDJPY, the pole fell 619.8 pips in five sessions, from 160.198 on 1 September 2026 to 154.000 on 8 September. Over the next five sessions, the upper edge rose 110.8 pips and the lower 105.7, so the two ran almost parallel. Then, on 16 September, a close at 156.304 cleared the upper edge by about 90 pips. That is the wrong way for a bear, and price kept climbing toward 159 the next week.
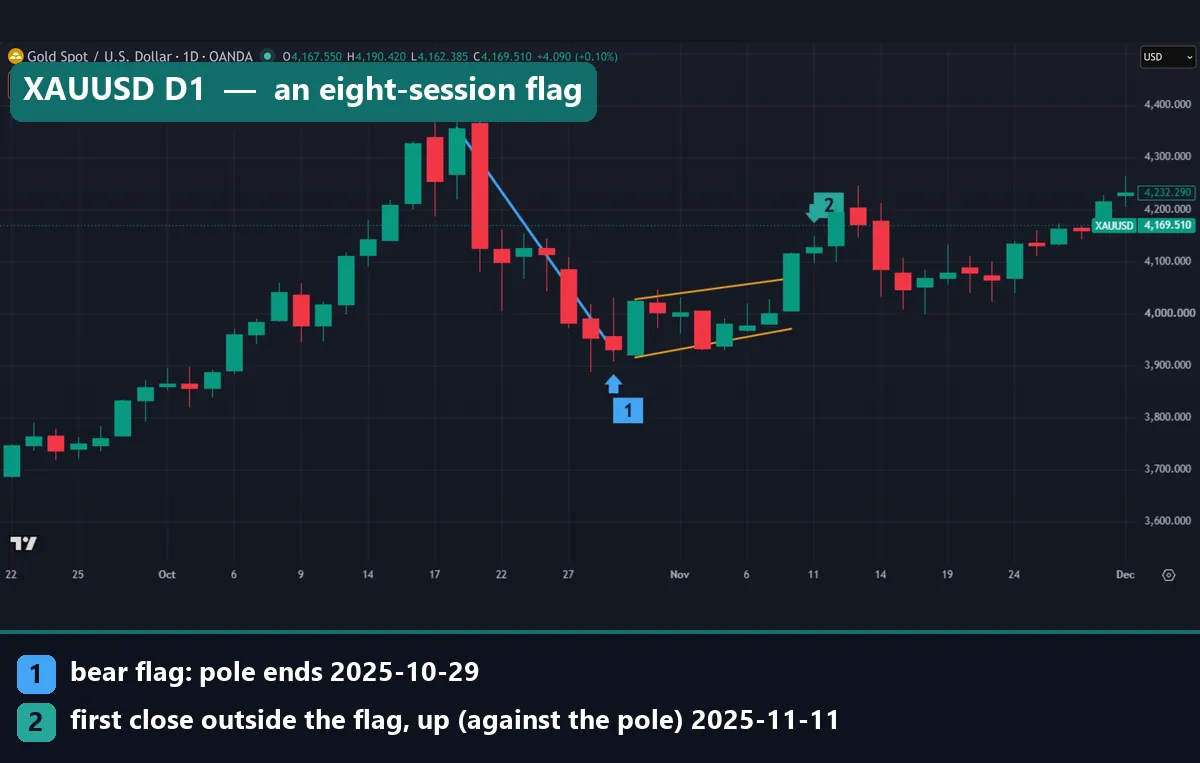
Gold shows a longer flag and a fitted edge at work. It fell $425.18 in seven sessions, from $4,355.795 on 20 October 2025 to $3,930.615 on 29 October. The flag then ran for eight sessions. Its last candle, on 10 November, already closes above the yellow line. Because our rule only tests closes after the flag, the break came a day later, at $4,126.505. Within days, gold traded above $4,200.
Worked example: the EURUSD daily bear flag
Here is the chart at the top of this guide, step by step.
- Pole: from a close of 1.16085 on 16 June 2026 to 1.13586 on 24 June (marker 1), a fall of 249.9 pips in six sessions.
- Flag: five daily bars, 25 June to 1 July. The upper edge rose from 1.13882 to 1.14174, the lower from 1.13335 to 1.13675.
- Parallel test: the upper edge climbed 29.2 pips and the lower 34.0, a ratio of 0.86.
- Depth: the upper edge ended 58.8 pips above the pole’s last close, about a quarter of the pole.
- Triggers for 2 July: a close under about 1.1376 for a down break, or over about 1.1425 for an up break.
- Result: a close of 1.14337, about 9 pips above the upper edge, against the pole.
So the textbook sell signal never came. A down break would have put the target at or below about 1.1126, some 250 pips lower.
The up break went nowhere either. For the three weeks our chart shows after it, price held between about 1.138 and 1.148. A trader who sold early, inside the flag, needed a stop above it. Our guide on how to use a stop loss covers where such exits go.
What 145 bear flags did after the break
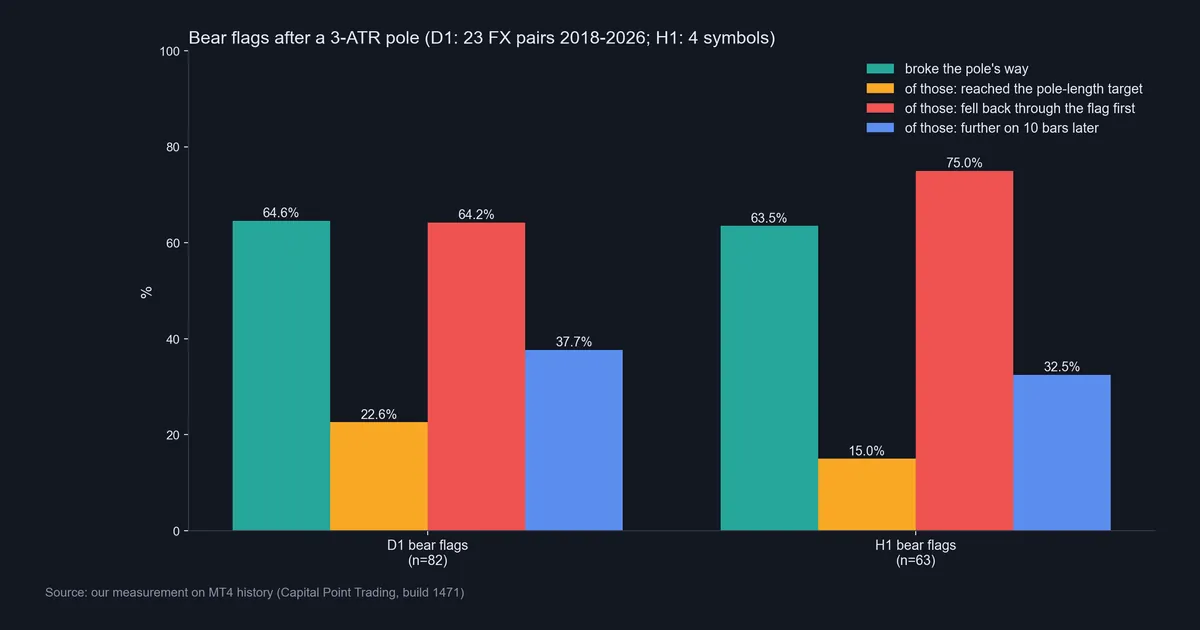
Our scan found 82 bear flags on daily charts and 63 on hourly charts. All of them broke within 15 bars.
On daily charts, 53 of the 82 broke down, the pole’s way (64.6%), and 29 broke up (35.4%). That much fits the textbook. The trouble comes after the break:
- Only 12 of the 53 down breaks reached the pole-length target within 40 bars (22.6%).
- In 34 of them, price closed back above the flag’s top first (64.2%).
- Ten days later, price was lower in only 20 of the 53 (37.7%).
That last figure is worse than chance. In the same data, 52.3% of all 10-day windows ended higher, so about 48% ended lower. The median close 10 days after a down break sat 0.41 ATR above the break.
Hourly flags broke down about as often and did worse afterwards. Of the 63, 40 broke down (63.5%). Only 6 of those reached the target (15.0%), and 30 closed back above the flag first (75.0%). Ten bars later, 13 of the 40 sat lower (32.5%).
These samples are small: each daily flag moves a percentage by about 1.2 points. Our guide to backtest sample size explains why that matters.
GBPJPY: the neatest bear flag broke upward
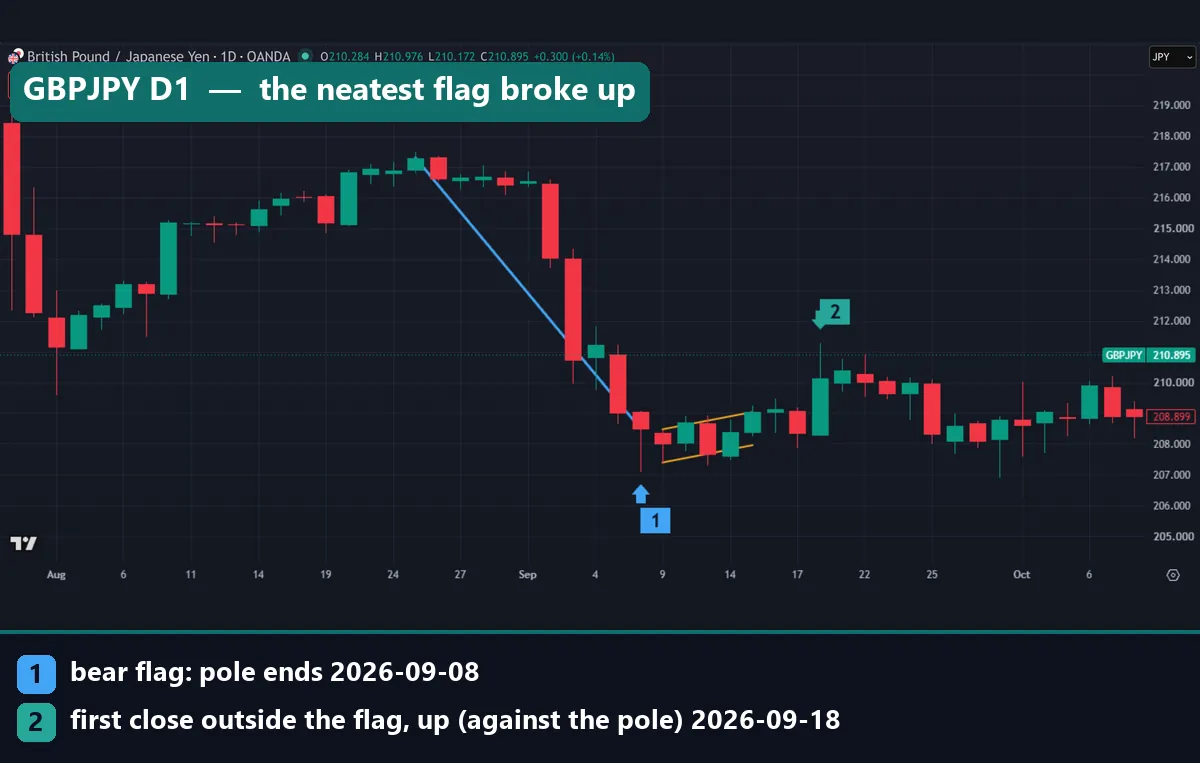
This is the tidiest flag in our set. Over five sessions, its upper edge rose 55.9 pips and its lower edge 56.1 pips, a slope ratio of almost exactly 1.
The pole is less tidy. It spans 878 pips in ten sessions, from 217.29 on 25 August 2026 to 208.51 on 8 September. But the first week was flat, and most of the fall came on 2 and 3 September. Our rule takes the highest close in the 10 bars before the low, so the blue line starts there, not where the selling began.
The two sessions after the flag both closed inside its extended edges. Then a close at 210.142 on 18 September cleared the upper edge by about 69 pips. By early October, price was back near 209.
Download the complete indicator database
Put these concepts on your charts. One email unlocks the full library of 1,380+ indicators with compiled MT4 and MT5 files, plus my TradingView scripts. No paywall, no spam, unsubscribe any time.
Get free access to my indicator database
One email unlocks 1,380+ free MT4, MT5 and TradingView indicators — the complete library. No single-tool download; you get the whole database.
Where it fails: weak follow-through and missed targets
In our data, the bear flag falls short in four ways.
- Follow-through. Ten days after a daily down break, price was lower only 37.7% of the time, against about 48% after any day.
- Targets. Just 12 of 82 daily bear flags went from pole to full target, about one in seven.
- Snap-backs. Two in three daily down breaks, and three in four hourly ones, closed back above the flag before the target. Ten bars after an hourly down break, the median close sat 0.89 ATR against the trade.
- Costs. Every figure is before spread, swap and commission, which only make it worse. See our note on backtesting transaction costs.
Also note that five of our six charts broke upward. That is not typical of the full test. These are recent cases on six symbols, not a fair sample.
USDCHF: the one chart that broke down
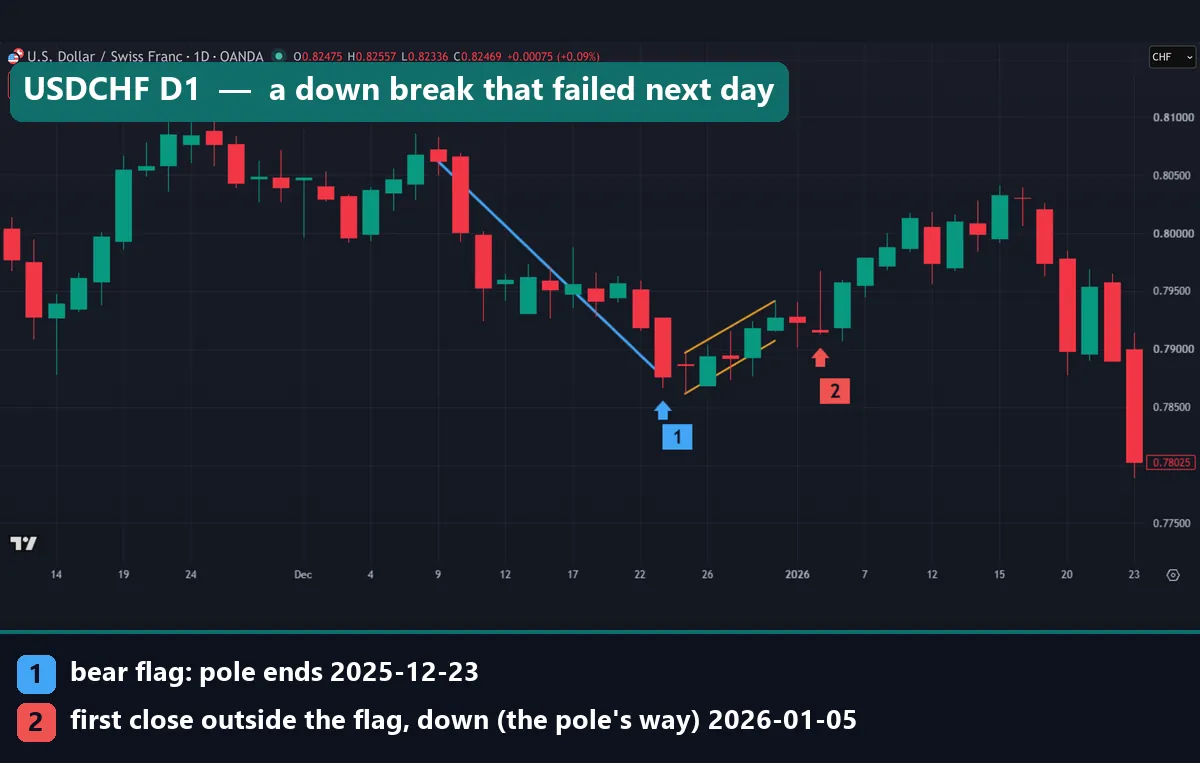
USDCHF fell 185.5 pips in ten sessions, from 0.8062 on 9 December 2025 to 0.78765 on 23 December. The flag ran from 24 to 31 December, and both edges rose by about 45 pips. On 5 January 2026, a close at 0.79152 broke below the rising lower edge.
That break came 38.7 pips above the pole’s last close, because a rising flag lifts its own trigger. The target sat at 0.77297, the break close minus the pole.
The next session closed above the top of the flag, so our rule scored a failure. Price climbed above 0.800 by mid-January. Later it did fall hard, to a close near 0.780 on 23 January, the last bar on our chart. Even so, it stayed above the target, and a short stopped out above the flag missed that drop.
AUDUSD: an upward break by 0.2 pips
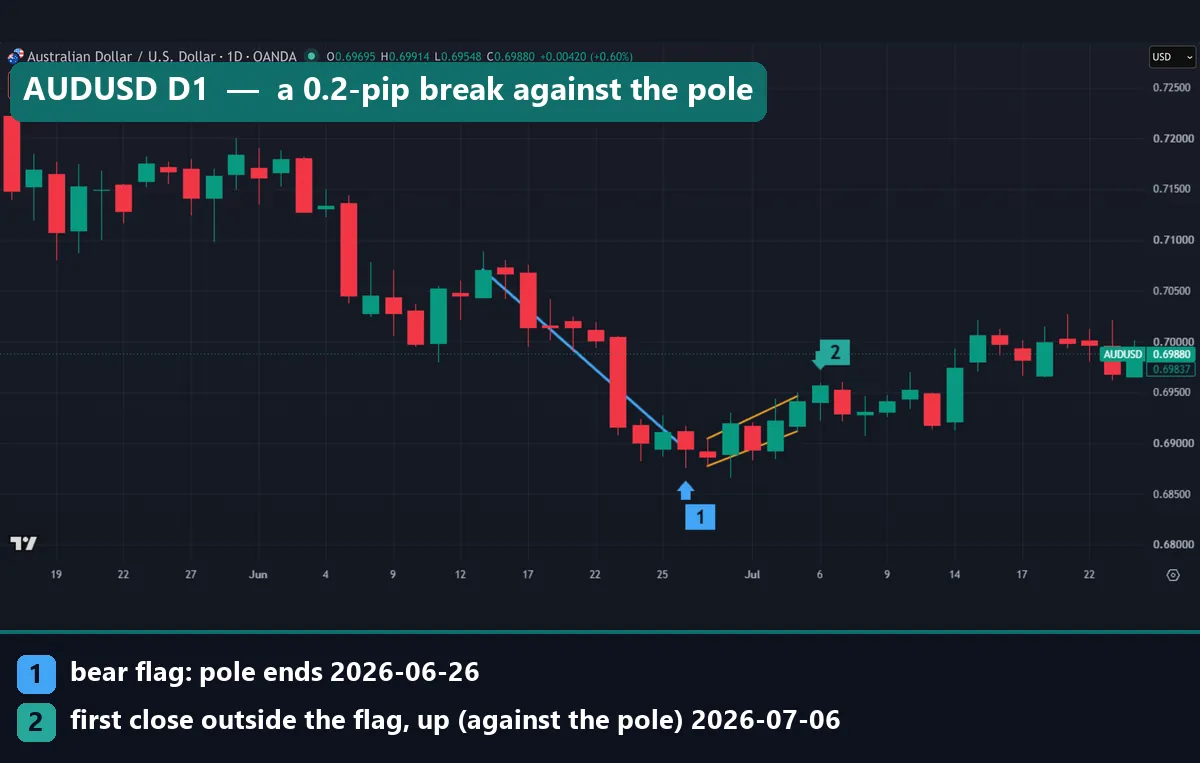
AUDUSD fell 175.9 pips in nine sessions, from 0.70706 on 15 June 2026 to 0.68947 on 26 June. The flag ran from 29 June to 3 July. On 6 July, a close at 0.69568 cleared the extended upper edge by just 0.2 pips, so by our rule it broke against the pole. The next candle gave back that day’s gain. A break that thin says more about where the line sits than about the market.
Common bear flag mistakes
- Selling inside the flag. Until a candle closes outside, it is only a bounce, and 35.4% of our daily bear flags broke up.
- Treating the break as the end of the risk. The textbook trade starts at the close below the flag, yet 64.2% of daily down breaks closed back above it before the target.
- Counting on the full target. Fewer than one in four daily down breaks reached it. We did not test nearer targets, such as the flag’s width.
- Bending the lines to fit. Moving a line until the flag looks right hides the misses. Our page on chart pattern failure covers this habit.
Where to go next
These pages pick up where this one stops:
- Our multi-timeframe analysis guide, since daily and hourly flags behaved differently.
- The break and retest strategy, which waits for a broken level to hold.
For figures from a much larger sample, read Thomas Bulkowski’s flags page at ThePatternSite. He treats flags as short pauses of under three weeks. His numbers come from his own pattern database, not from forex, so compare them with ours rather than mixing them.
FAQ: bearish flag questions
Is a bearish flag bullish or bearish?
Textbooks call it bearish: a pause in a fall before the next leg down. In our daily forex data, 64.6% broke down, but ten days later only 37.7% of those breaks sat lower.
What is the difference between a bear flag and a bear pennant?
Both follow a sharp drop. A bear flag’s pause rises inside two parallel lines, while a bear pennant’s highs fall and its lows rise, so its lines converge.
Is a falling wedge the same as a bear flag?
No. A falling wedge has two falling, converging lines, and most texts read it as bullish. A bear flag’s lines rise against the drop and stay roughly parallel.
How do you calculate a bear flag target?
Measure the pole from its first close to its last, then subtract that from the break close. In our daily data, 22.6% of down breaks reached it within 40 bars.
How long does a bear flag last?
Our rule allows 5 to 20 bars, and the examples in this guide ran five to eight. Longer pauses start to look like channels or ranges.
Does volume confirm a bear flag in forex?
Stock texts lean on volume, but spot forex charts here show only tick volume. We left it out, so our data cannot answer this.
Do bear flags work better on daily or hourly charts?
Both broke down about 64% of the time. After the break, hourly flags did worse: 75.0% closed back above the flag first, against 64.2% on daily charts.
Can you trade a bearish flag profitably?
Our numbers show no edge after the break, even before costs. After a down break, price fell over the next ten days less often than after an average day. A trader would need extra filters, tested on fresh data. Treat these figures as history, not a forecast: results are not guaranteed; past performance is not indicative of future results.
Last updated: 19 October 2026.

About the author
Written by Dominic Walsh, a Forex trader and MT4/MT5 indicator, Expert Advisor and script developer. Every tool on forexmt4systems.com is tested on live charts before release and ships with ready-to-use compiled MT4 (.ex4) and MT5 (.ex5) files. Learn more about the trader and developer behind this site.
How we build, test and correct every tool: Editorial & Testing Policy. Trading carries risk; see the disclaimer.