
A bull pennant is a sharp rally that pauses in a short, narrowing range, and the textbook says price should then break higher and travel about as far again. We tested that claim on 23 forex pairs. This guide settles how to define the pattern, how to measure its target, which way the break went, and what price did next. The short version: daily bull pennants broke upward a little more often than not, but most hourly ones broke down.
What a bull pennant is
A bull pennant has three parts. First comes the pole, a fast and steep move up. Next comes the pennant: a small range whose highs drift lower and whose lows drift higher, so the two lines across them converge. Last comes the break, the first close outside that range.
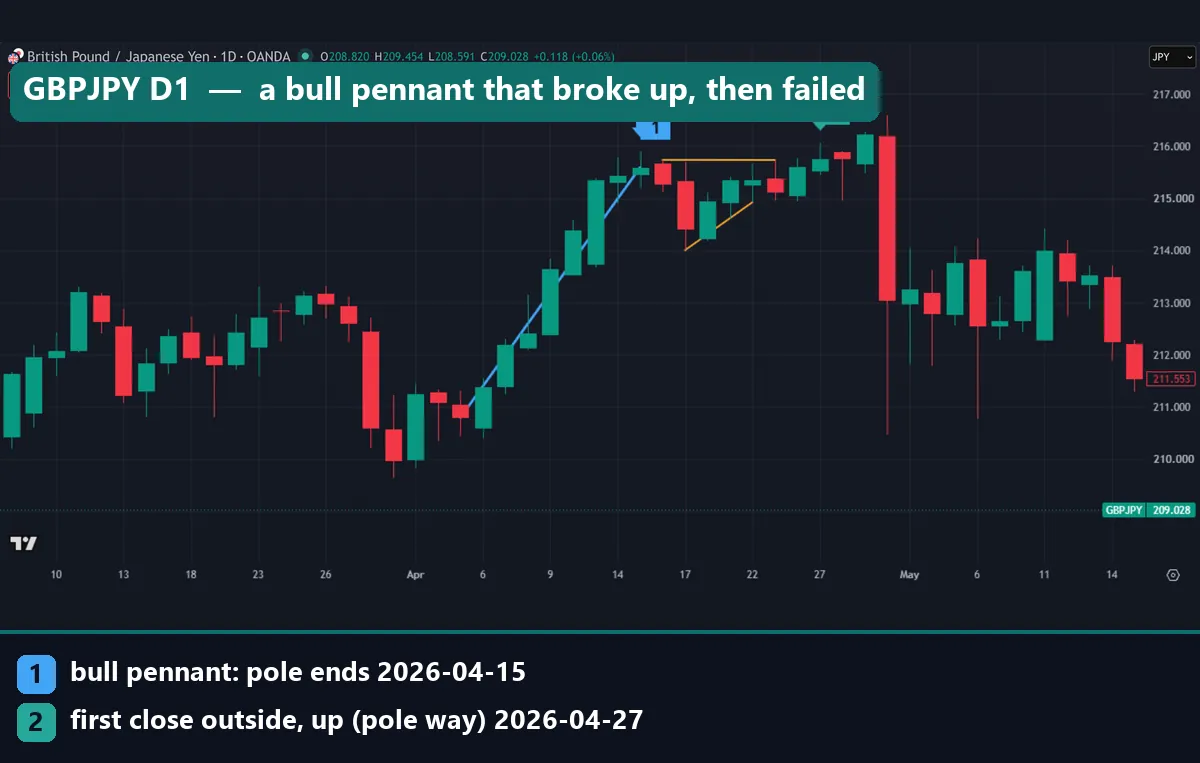
The chart above shows one on GBPJPY daily. Its blue line is the pole, from 3 April to 15 April 2026, and the yellow lines frame the pause. Marker 2 is the first close above the pause, on 27 April.
A pennant is a close cousin of the flag. In a flag, the two lines run parallel; in a pennant, they converge. Our flag vs pennant comparison and our flag pattern guide cover the difference. A pennant also looks like a small symmetrical triangle, but a triangle needs no pole. See our triangle pattern types guide for those shapes.
The bear pennant: the mirror image
A bear pennant is the same pattern upside down. Its pole is a sharp drop, and the pause is a small range with lower highs and higher lows. Only a close below that range counts as the break, and the target sits one pole length under its floor.
In theory, the two are twins. On daily charts, both broke the pole’s way equally often, but we found only 24 bear pennants against 36 bull ones. So we report them separately.
How the pattern should work: pole, pause, target
In the usual story, buyers push price up hard. Some then take profit while new buyers wait, so the range shrinks. When the pause ends, the trend should resume with a move about as long as the pole. That gives a simple measured target:
pole = close at the end of the pole - close at its start
bull target = top of the pennant + pole
bear target = bottom of the pennant - pole
Many guides add the pole to the breakout price instead, but breaks usually come right at the edge, so the gap is small. Our guide to measured move targets explains the method.
TradingView uses the same idea: its bullish pennant help page on TradingView sets the target at about the height of the flagpole. But sources disagree on how long a pennant may last. Thomas Bulkowski’s pennants page at ThePatternSite treats them as short, while other guides allow weeks. His figures come from his own sample, not from forex.
How we tested the bull pennant
We wrote the rules first and let a script find every case, so we could not pick the pretty ones.
Our statistics come from MetaTrader 4, build 1471, using Capital Point Trading terminal history. We scanned daily bars on 23 forex pairs from 12 June 2018 to 24 August 2026. We also scanned hourly bars on EURUSD, GBPUSD and USDJPY from 22 December 2025 to August 2026, and on gold (XAUUSD) from 1 July 2025 to 20 August 2026.
The chart examples come from the TradingView web chart with OANDA data, captured on 15 October 2026. They show D1 and H1 charts of GBPJPY, USDJPY, GBPUSD and gold, and the same rule found each one. All results are before spread, swap and commission. We placed no trades; we counted what price did next. Our method sits in the editorial testing policy.
Classic texts, such as the flag and pennant article at StockCharts ChartSchool, want heavy volume on the pole and the break. But MT4 and OANDA show only tick volume, the count of price changes, so we left volume out.
Our pennant rules and settings
Here is the full rule set. A different set would find a different sample, so read our numbers as results for this rule only.
| Parameter | Our setting | Why it matters |
|---|---|---|
| Pole size | The close moves at least 3 ATR(14) | Only sharp moves count as a pole |
| Pole length | Within 10 bars | Keeps the move fast |
| Pole end | The most extreme close of the run | Fixes where the pause starts |
| Pause length | 6 to 15 bars | Longer pauses start to look like triangles |
| Pause depth | Within half the pole, and no more than 0.25 ATR past the pole’s extreme | A deep pullback or a fresh run is more than a pause |
| Converging lines | Last third: lower high, higher low, under 70% of the first third’s range | Makes the range narrow, as a pennant should |
| Break | First close outside the pause, within 15 bars | Closes count, wicks do not |
| Target | Pole length added to the broken edge, within 40 bars | The textbook measured move |
| Failure | A close through the opposite edge first | The idea is void |
| Volume | Not used | Forex volume here is tick volume |
ATR is the average true range over 14 bars, a measure of normal bar size, so one rule works on quiet and wild pairs alike. Our guide on what ATR means in trading explains it.
Reading a bull pennant on a chart
On every chart here, the blue line is the pole, and the yellow lines join the first and last highs and lows of the pause. Marker 1 sits at the end of the pole. Marker 2 is the first close outside the pause: green when up, red when down.
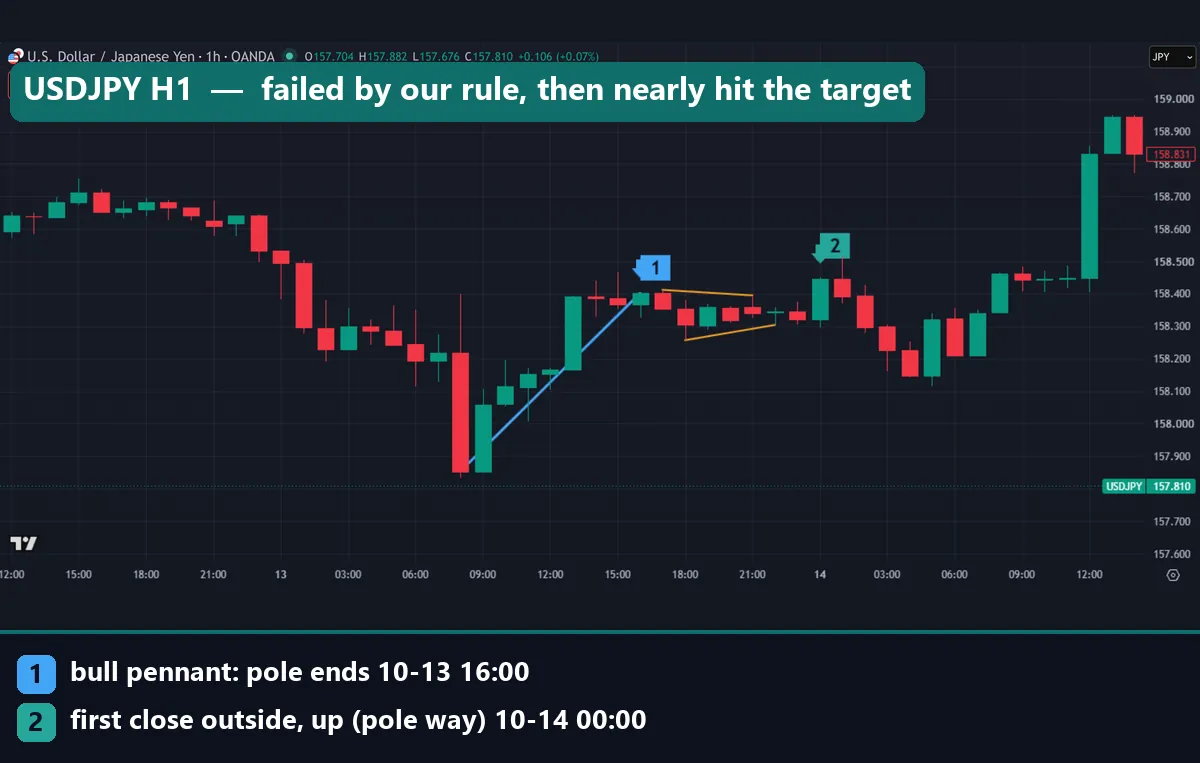
The USDJPY hourly chart shows how much the rule decides. Its pole rose 54.9 pips, from 157.853 at 08:00 UTC on 13 October 2026 to 158.402 at 16:00 UTC. The pause held between 158.257 and 158.412. At 00:00 UTC on 14 October a candle closed at 158.446, marker 2. Three hours later price closed at 158.226, below the floor, so our rule scored a failure. Yet at 13:00 UTC price reached 158.951, just 1 pip short of the 158.961 target.
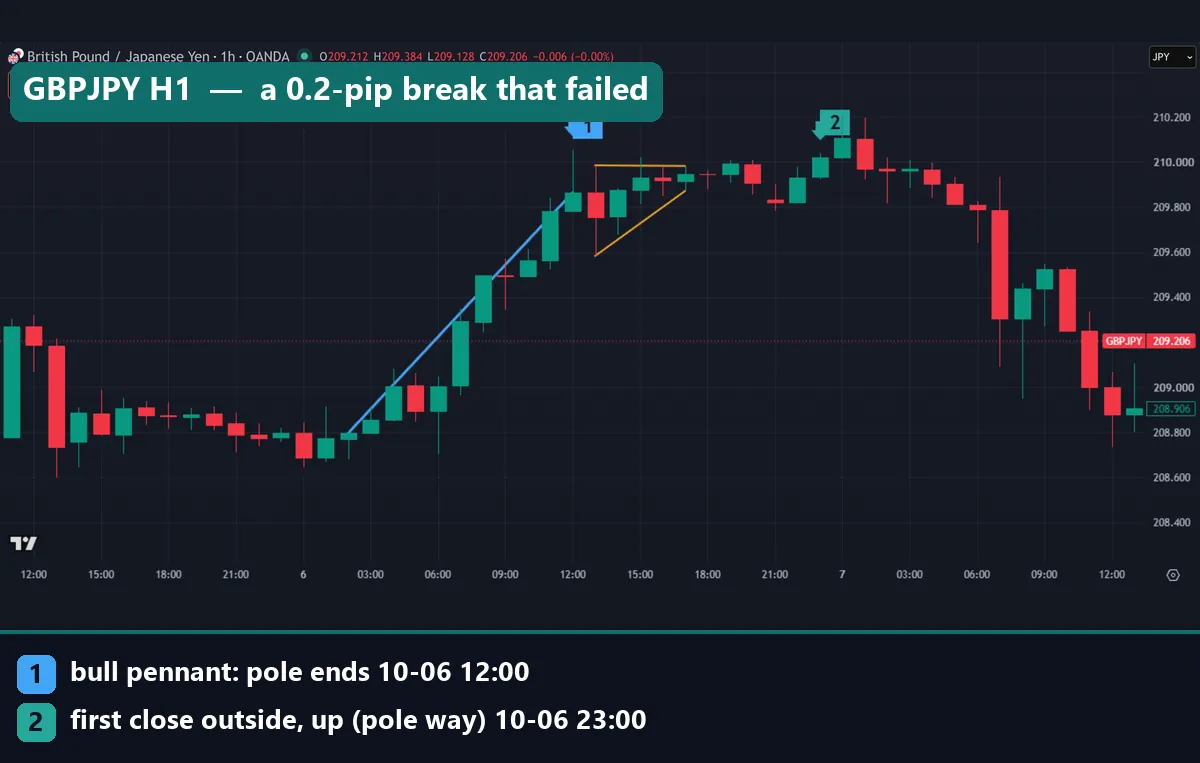
The GBPJPY hourly chart shows a thin break. Its pole rose 106.8 pips, from 208.796 at 02:00 UTC on 6 October to 209.864 at 12:00 UTC. The pause held between 209.583 and 210.020, and its top wick pokes just above the yellow line, which joins only the touches. At 23:00 UTC a candle closed at 210.022, just 0.2 pips above the top. At 07:00 UTC on 7 October price closed at 209.306, below the floor.
Worked example: the GBPJPY daily bull pennant
Here is the daily chart from the top, step by step.
- Start of the pole: a close of 210.797 on 3 April 2026.
- End of the pole: a close of 215.592 on 15 April, marker 1.
- Pole length: 4.795 yen, or 479.5 pips.
- Pause: six daily bars, 16 to 23 April, between 214.006 and 215.738.
- Pause range: 173.2 pips, about 36% of the pole.
- Break: a close of 215.754 on 27 April, marker 2, just 1.6 pips above the top.
- Target: 215.738 plus 4.795 equals 220.533.
- Failure line: any close below 214.006.
On paper, this looks tidy. From the break close, the target sat 477.9 pips away and the failure line 174.8 pips away, a reward of about 2.7 times the risk before costs. Our guide to the risk reward ratio explains why that means little without the odds behind it.
Then price reached 216.602 on 30 April, only 84.8 pips past the break. The same day it fell to 210.46 and closed at 213.054, below the failure line. So the pattern failed three bars after its break, 393.1 pips short of the target.
Note also the almost flat top line, at 215.738 and then 215.736. Some traders would call this a small ascending triangle, and our rising wedge vs ascending triangle guide shows how easily such labels blur.
What 132 pennants did on D1 and H1
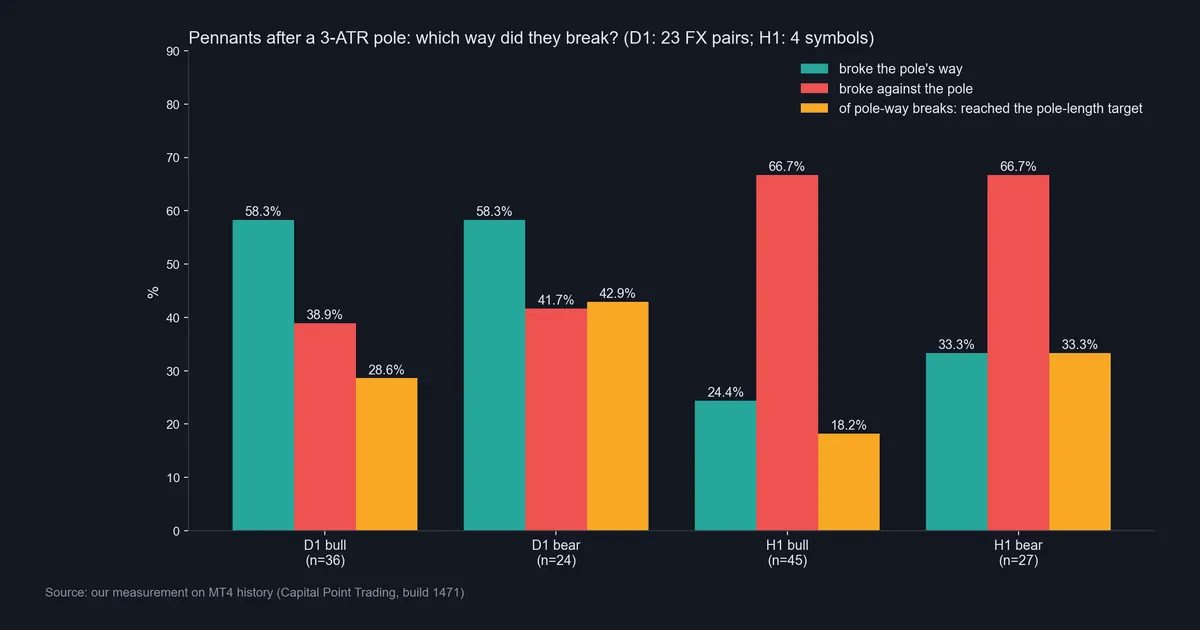
Our scan found 36 bull and 24 bear pennants on daily charts, and 45 bull and 27 bear pennants on hourly charts. Those are small samples: each daily bull pennant is worth 2.8 percentage points, and each daily bear pennant 4.2. Our guide to backtest sample size explains why that matters.
On daily charts, bull and bear pennants both broke the pole’s way 58.3% of the time: 21 of 36 bulls and 14 of 24 bears. They broke against it 38.9% and 41.7% of the time. On hourly charts, the picture flipped. Only 24.4% of bull pennants and 33.3% of bear pennants broke the pole’s way, while 66.7% of each broke against it.
Targets were rare. Of the 21 daily bull breaks the pole’s way, 6 reached the target within 40 bars (28.6%), while 10 (47.6%) closed back through the far side first. Daily bear breaks did better, at 6 of 14, but 14 breaks is too few to lean on. On H1, just 2 of 11 bull breaks and 3 of 9 bear breaks got there.
Follow-through was flat, too. Ten days after a daily bull break, price was higher 52.4% of the time, against 52.3% for all days in the same data. So the break told us almost nothing about the next two weeks.
A bear pennant that broke down, then failed
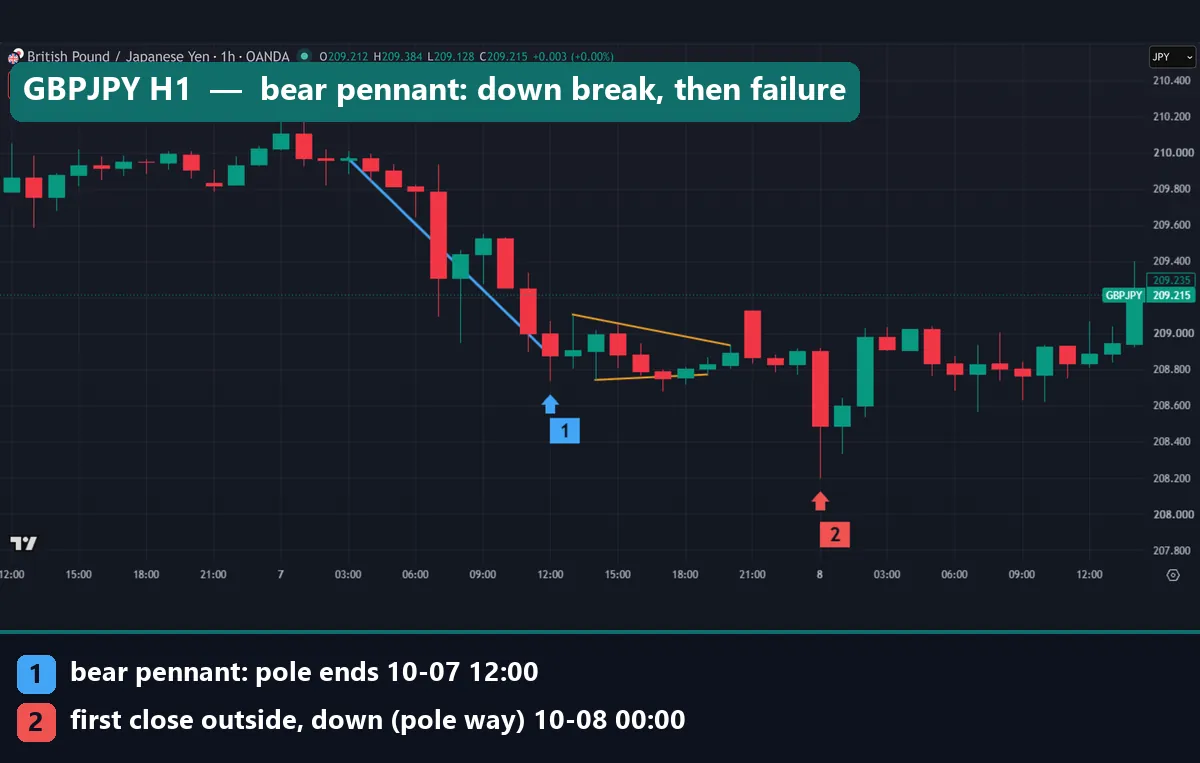
On the GBPJPY hourly chart, a bear pole fell 109.0 pips, from 209.968 at 03:00 UTC on 7 October 2026 to 208.878 at 12:00 UTC. The pause held between 208.678 and 209.104. At 00:00 UTC on 8 October a candle closed at 208.490, marker 2, the pole’s way.
That bar dipped to 208.198, and then the drop ran out. By 02:00 UTC price had closed at 208.981, back inside the pause. At 14:00 UTC a close of 209.235 cleared the top, so the pattern failed. At its best it got within 61 pips of the 207.588 target.
This pole began inside the drop that sank the GBPJPY bull pennant above. One pattern’s failure became the next one’s pole, so counts can overlap.
Download the complete indicator database
Put these concepts on your charts. One email unlocks the full library of 1,380+ indicators with compiled MT4 and MT5 files, plus my TradingView scripts. No paywall, no spam, unsubscribe any time.
Get free access to my indicator database
One email unlocks 1,380+ free MT4, MT5 and TradingView indicators — the complete library. No single-tool download; you get the whole database.
Where it fails: hourly charts and missed targets
The pattern fails in four ways in our data.
- Hourly direction. On H1, two in three bull pennants broke down, and two in three bear pennants broke up. After the few upward bull breaks, the median close 10 bars later sat 0.97 ATR below the break.
- Targets. Only 6 of 36 daily bull pennants went from pole to full target.
- Follow-through. Daily bull breaks the pole’s way showed no edge over an average day, 10 days later.
- Costs. Every figure is before costs, and costs only make it worse. See our note on backtesting transaction costs.
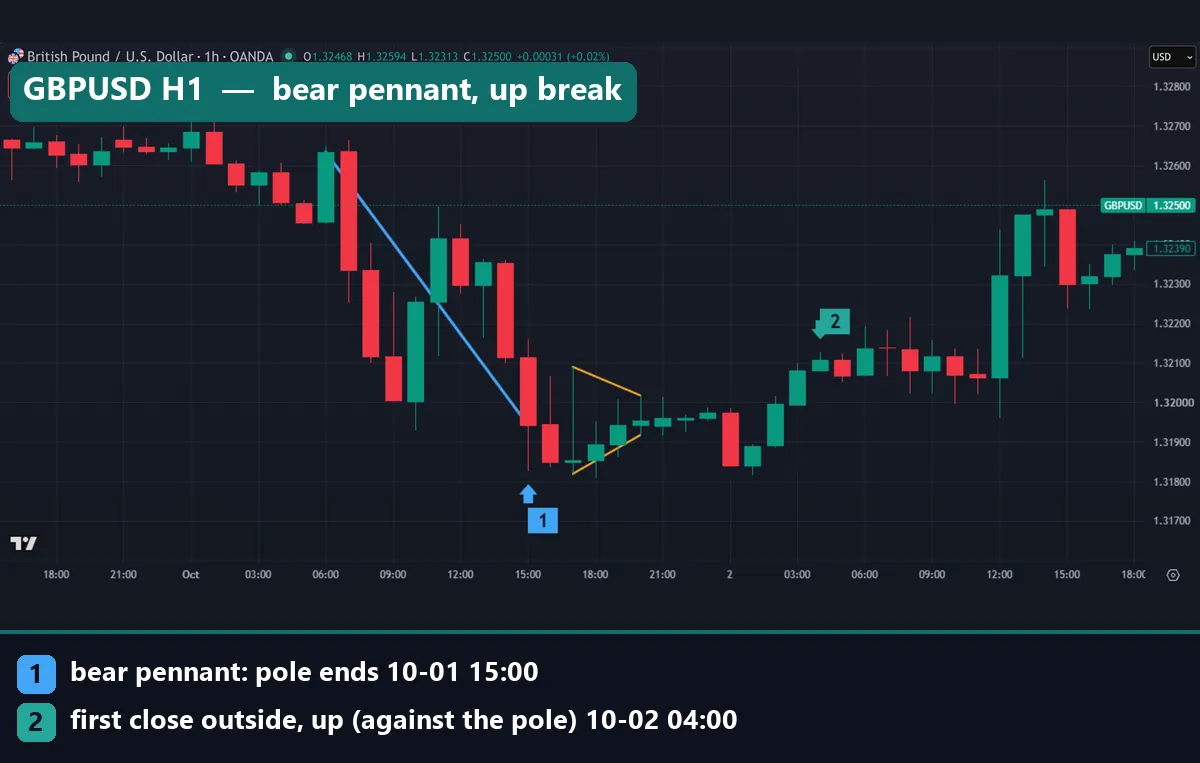
The GBPUSD hourly chart is a typical hourly bear case. Its pole fell 69.1 pips, from 1.32634 at 06:00 UTC on 1 October 2026 to 1.31943 at 15:00 UTC. The pause held between 1.31808 and 1.32090. At 03:00 UTC on 2 October a candle closed 1 pip under the top. The next one closed at 1.32108, above it and against the pole. By 14:00 UTC price had reached 1.32562, 45.4 pips higher.
We did not test why hourly pennants reverse so often; one guess is that news spikes fade. Our forex news spike guide covers those moves.
A daily bear pennant that broke upward
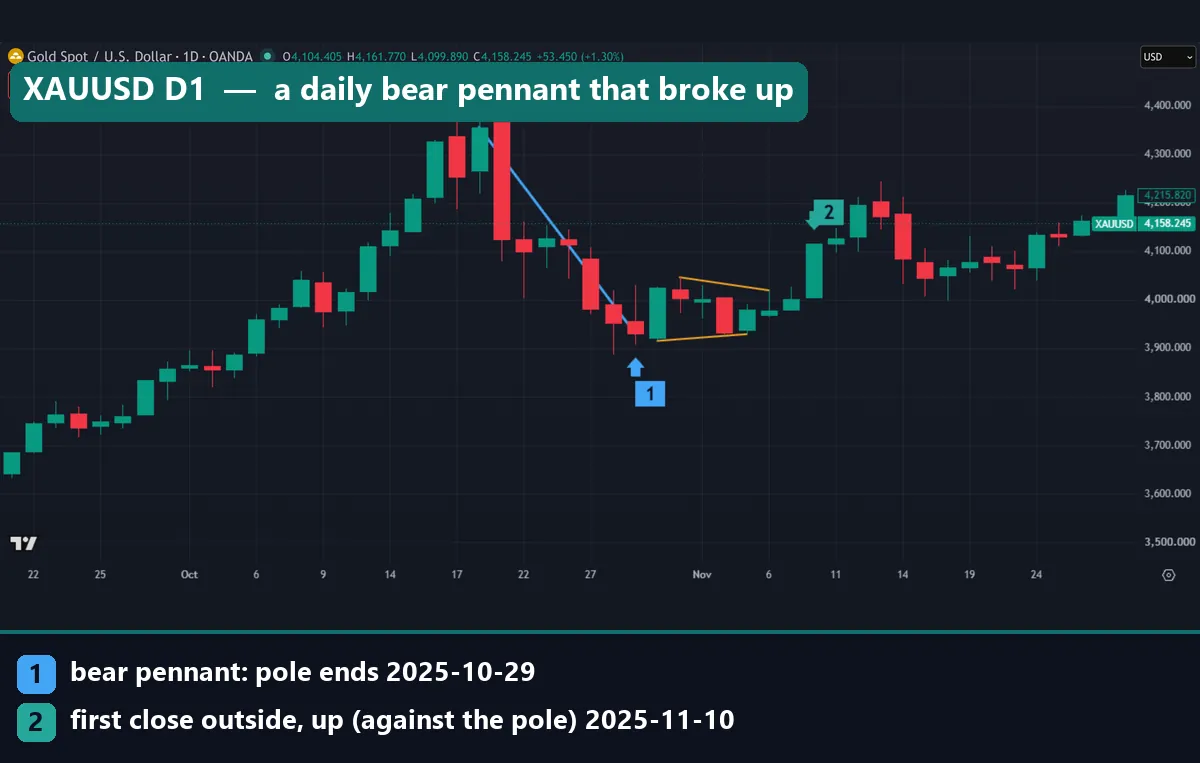
Daily charts are not immune. Gold fell $425.18 in seven sessions, from $4,355.795 on 20 October 2025 to $3,930.615 on 29 October, and $230.53 of that came on 21 October alone. The pause then held between $3,915.52 and $4,046.595 for six sessions.
On 10 November a candle closed at $4,115.41, above the pause and against the pole. Three days later gold traded at $4,245.195.
Two cautions apply. Our daily statistics cover the 23 FX pairs only, so this gold chart is an illustration, not part of the sample. Also, the pause was $131.08 wide, almost a third of the pole. A “small” pennant after a big pole can still be a large range in dollars.
Common bull pennant mistakes
- Acting before the close. A pennant is only a pause until a bar closes outside it. On H1, 4 of 45 bull pennants never broke within 15 bars.
- Assuming the pole’s direction. On hourly charts, two thirds of bull pennants broke down. Treat either side as possible.
- Trusting the full target. Fewer than three in ten daily bull breaks reached it. We did not test nearer targets, so we cannot say which works better.
- Drawing the lines to fit. Nudging a line until the shape looks right hides the misses. Our page on chart pattern failure covers this.
Where to go next
These guides pick up where this one stops:
- Our multi-timeframe analysis guide, since daily and hourly pennants behaved so differently.
- The break and retest strategy, another way to handle a broken level.
- Our guide on how to use a stop loss, because a failed pennant needs a planned exit.
For the classic textbook view, read the flag and pennant patterns article on Wikipedia: a sharp move, a pause on light volume, then continuation.
FAQ: bull pennant questions
Is a bull pennant a bullish pattern?
Textbooks call it a bullish continuation pattern. In our daily forex data, 58.3% broke upward, but on hourly charts only 24.4% did. So the name describes the pole, not the future.
What is the difference between a bull pennant and a bull flag?
Both start with a sharp pole. In a flag, the pause forms a small channel with parallel lines. In a pennant, the lines converge instead.
How do you calculate a bull pennant target?
Measure the pole from its starting close to its ending close, then add it to the top of the pennant. In our daily data, 28.6% of upward breaks reached that level within 40 bars.
How long should a bull pennant last?
Sources differ. Our rule allows a pause of 6 to 15 bars on any timeframe. Longer pauses start to look like triangles.
What is a bear pennant?
It is the mirror image: a sharp drop, a narrowing pause, then a close below it. On daily charts, 58.3% of our 24 bear pennants broke down. On hourly charts, two thirds broke up, against the pole.
Does volume confirm a pennant in forex?
Classic texts want volume to fade in the pause and jump on the break. But spot forex only offers tick volume, so we left it out and cannot say.
Which timeframe works best for pennants?
In our test, daily charts did better than hourly ones on break direction. Still, the move after a daily bull break matched an average day. We did not test weekly or M15 charts.
Can you trade the bull pennant profitably?
Our numbers show no edge after the break, even before costs. A trader would need extra filters, tested out of sample, before relying on it. As with every test on this site, results are not guaranteed; past performance is not indicative of future results.
Last updated: 15 October 2026.

About the author
Written by Dominic Walsh, a Forex trader and MT4/MT5 indicator, Expert Advisor and script developer. Every tool on forexmt4systems.com is tested on live charts before release and ships with ready-to-use compiled MT4 (.ex4) and MT5 (.ex5) files. Learn more about the trader and developer behind this site.
How we build, test and correct every tool: Editorial & Testing Policy. Trading carries risk; see the disclaimer.