
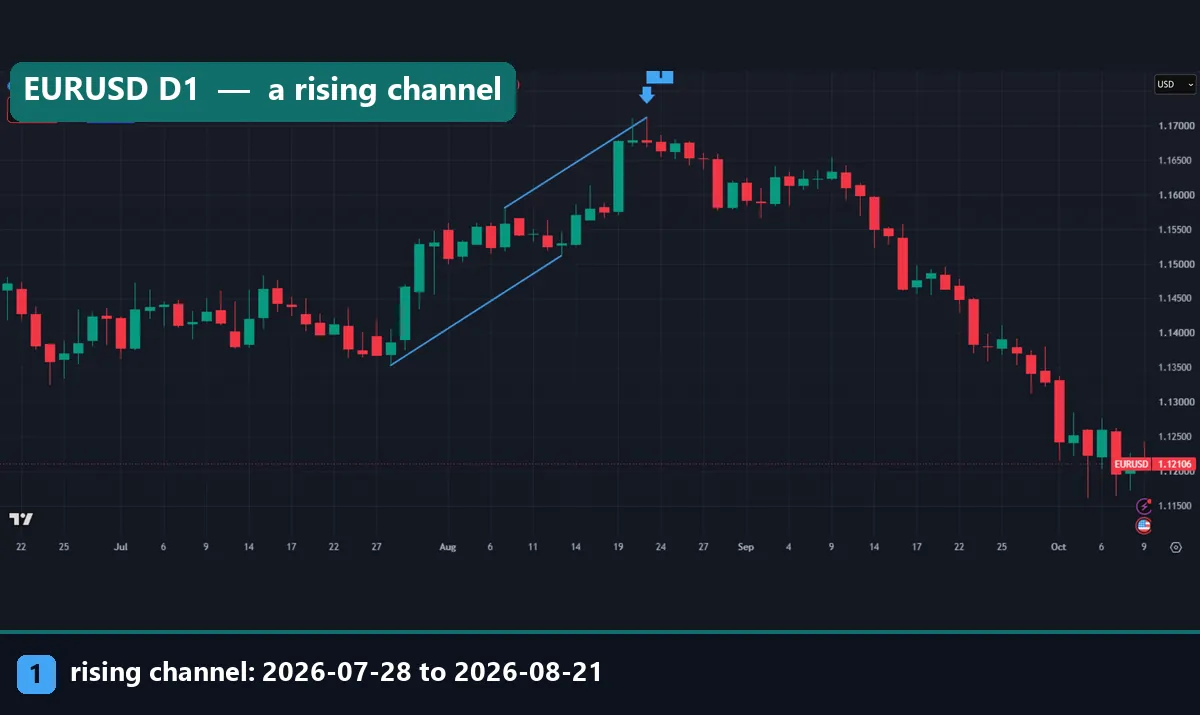
An ascending channel pattern is two rising, roughly parallel lines: one joins higher peaks, the other joins higher troughs, and price climbs between them. This guide settles what happened next on real charts. We found 399 rising channels on 23 daily FX pairs and checked which line price closed through first. The answer surprised us: most of them broke down, not up. Below you get the formula, our exact rule and six dated charts.
What an ascending channel pattern is
A channel is a trend with two borders. The upper line runs along the highs. The lower line runs along the lows. When both lines slope up, traders call it an ascending or rising channel.
The lines are ordinary trend lines. If you have not drawn one before, our guide on how to use trend lines covers the basics. The channel adds a second line on the other side of price.
Many traders read the lower line as support and the upper line as resistance. That view comes from classic support and resistance thinking. However, a rising line is not a fixed price. It moves higher every bar. As a result, price has to keep climbing just to stay inside.
A channel also differs from a wedge. In a wedge the two lines converge. In a channel they stay close to parallel. Our page on the wedge pattern explains that shape. StockCharts gives a short general summary in its price channel article at StockCharts ChartSchool.
Ascending vs descending channel: the mirror image
A descending channel is the same shape turned upside down. Both lines slope down, with lower peaks and lower troughs. Every rule in this guide flips for it. Also, the same trap applies in reverse: a falling upper line drops a little every bar, so flat price crosses it from below.
BabyPips keeps short glossary entries for both the ascending channel definition at BabyPips and its mirror. We did not test descending channels for this guide.
A short, steep channel that follows a sharp rally has its own name: a flag. Our guides to the flag pattern and flag vs pennant cover that case. A flag usually slopes against the prior move. A trend channel slopes with it.
How the two lines are built
Each line passes through two points. The upper line uses two swing highs, the lower line two swing lows.
First, find the slope in price per bar:
slope = (P2 - P1) / (bar2 - bar1)
Then, project the line to any later bar:
line(bar) = P1 + slope * (bar - P1_bar)
Next, test whether the lines are close to parallel. We compared the two slopes and kept a channel only if they sat within 30% of each other.
Finally, watch the closes. A daily close above the projected upper line counts as an upside break. A close below the projected lower line counts as a downside break. We used closes rather than wicks, because a wick can poke through a line and snap back in the same bar.
MetaTrader has a built-in tool for this. The equidistant channel object copies one line and offsets it, as the OBJ_CHANNEL reference in the MQL4 documentation shows. TradingView has a similar parallel channel tool. Both force perfect parallels.
How we tested
We ran our rule on our own MT4 terminal history: Capital Point Trading, MetaTrader 4, build 1471, read from the .hst files. The daily data covers 23 FX pairs from 12 June 2018 to 24 August 2026.
First, we found swing points. A peak is a bar whose high tops the bar before and the bar after. Next, we looked for four swing points in a row inside 60 bars. Those four had to give a higher peak and a higher trough. Then the two slopes had to sit within 30% of each other.
After that, we followed each channel for 20 trading days. We recorded which came first: a close above the projected upper line, a close below the projected lower line, or neither. In total the rule found 399 rising channels.
The chart images are TradingView web charts with OANDA data, captured on 9 October 2026. The blue lines join the exact swing points our rule picked. Our method rules sit on the editorial testing policy page. Note that none of this is a trade result. We measured line breaks only, before spread, swap and commission.
The ascending channel pattern rule in numbers
Here is every parameter behind our channel count.
| Parameter | Our value | What it controls |
|---|---|---|
| Swing point | 3-bar pivot | A high above both neighbours, or a low below both |
| Points per channel | 4 in a row | Two peaks and two troughs |
| Window | 60 bars | All four points must fit inside it |
| Direction | Higher peak and higher trough | Both lines must rise |
| Parallel test | Slopes within 30% | Rejects wedges and megaphones |
| Break signal | Daily close beyond a projected line | Ignores wicks |
| Follow-up | 20 trading days | After that, we call it “no break” |
A 3-bar pivot is a loose filter. It catches small swings, so the rule finds many short channels. A wider pivot, such as five bars, would find fewer and longer ones. Our guide to Williams fractals uses a 5-bar version of the same idea.
Reading an ascending channel on a chart
Start with the swings, not the lines. Mark the two most recent peaks and the two most recent troughs. If the second peak and the second trough are both higher, draw the lines.
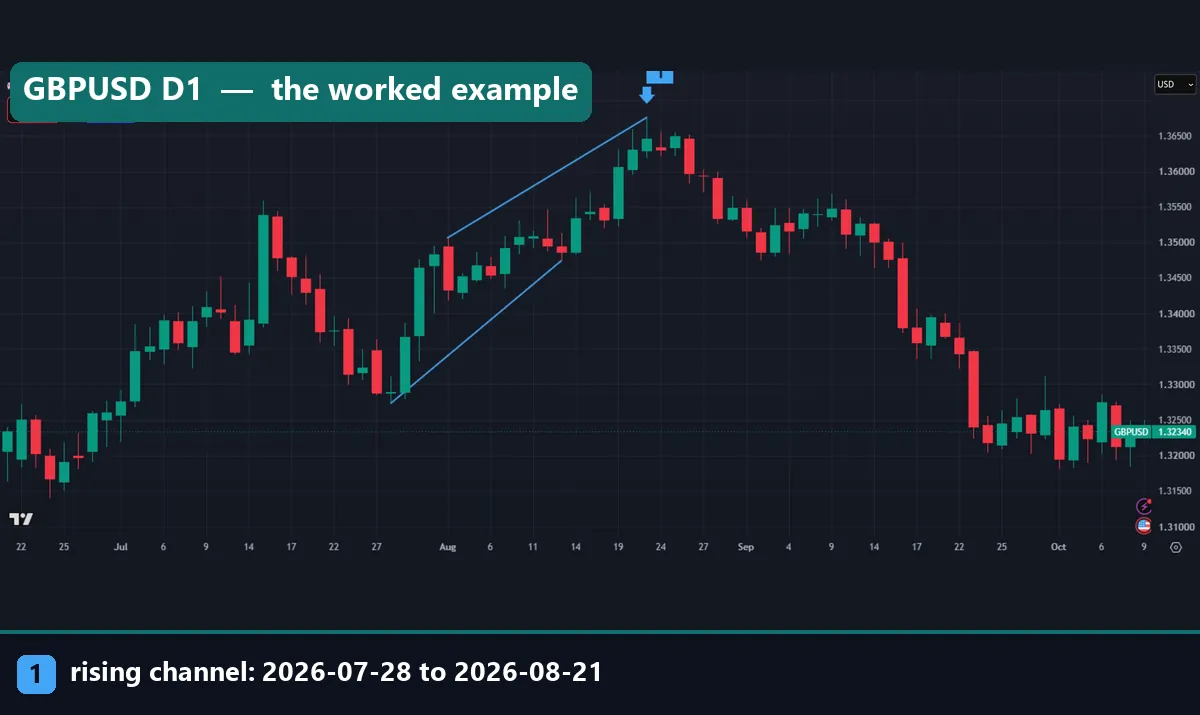
Next, look at the angle. Two lines that clearly converge are a wedge, not a channel. On the GBPUSD chart below, the upper line rose 169.3 pips between its peaks while the lower line rose 200.8 pips between its troughs. So the lines pinch slightly, but they still passed our 30% test.
Then, check the timeframe. The same shape shows up on intraday charts, only smaller. The USDJPY hourly chart below shows a channel that formed between 04:00 UTC on 5 October and 01:00 UTC on 6 October 2026. The peaks sat at 158.176 and 158.300. The troughs sat at 157.570 and 157.768.
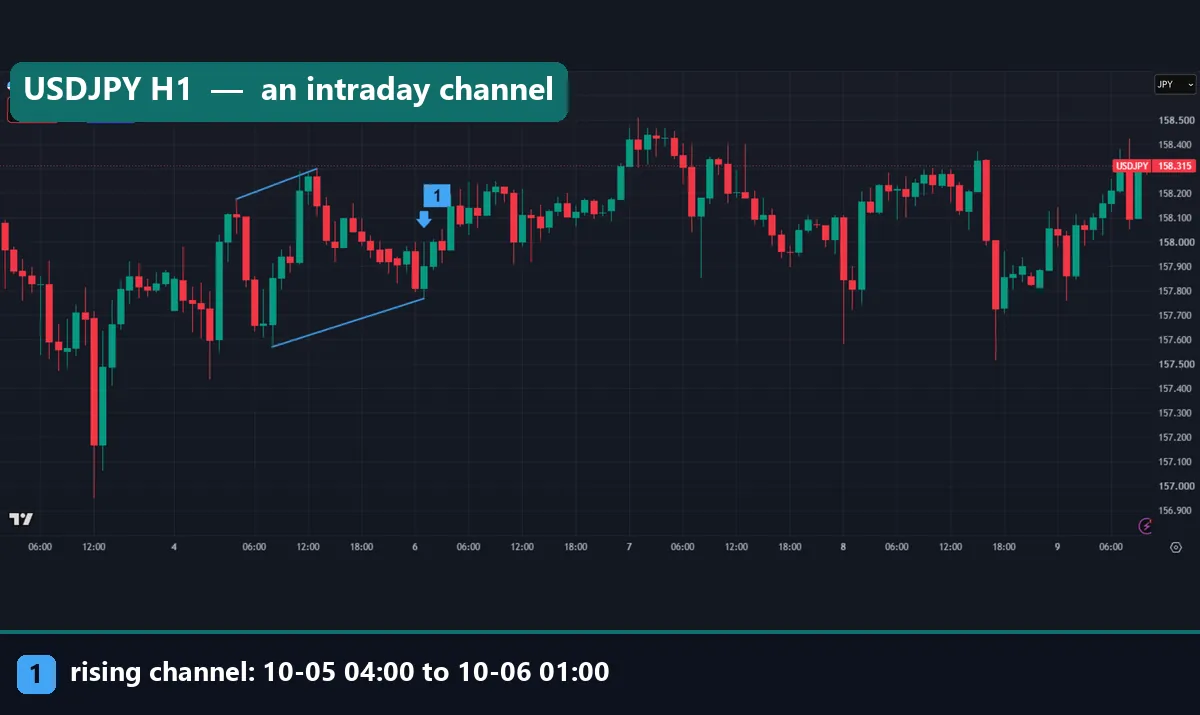
That hourly channel is only about 60 to 70 pips tall. In contrast, the daily GBPUSD channel was more than 200 pips tall. Also, price on that USDJPY chart went on to trade above 158.400 on 7 October. So intraday channels can resolve upward too. We did not count hourly channels, though.
Worked example: GBPUSD daily, July to August 2026
This channel ran from 28 July to 21 August 2026 on the GBPUSD daily chart. Here are the four swing points our rule used:
- Trough 1: 28 July, low 1.32735
- Peak 1: 3 August, high 1.35065
- Trough 2: 13 August, low 1.34743
- Peak 2: 21 August, high 1.36758
First, the direction check. Peak 2 sits 169.3 pips above peak 1. Trough 2 sits 200.8 pips above trough 1. Both rose, so it qualifies as a rising channel.
Next, the height. At the start, peak 1 minus trough 1 gives 233.0 pips. At the end, peak 2 minus trough 2 gives 201.5 pips. So the channel narrowed a little. The lower line climbed faster than the upper one. In fact, it only just passed our 30% slope test. A stricter rule would have rejected it as a rising wedge.
Then, the projection. The lower line gained a bit over 16 pips per trading day. So by late August it sat well above 1.35. Price did not need to fall hard to cross it. It only needed to stop rising.
Price stalled near the second peak, then drifted lower through late August. By 9 October GBPUSD traded at 1.32340, back below the first trough. In short, this channel ended with a downside break, like most in our sample.
The pattern did not predict that fall. It only described the climb before it. The rising wedge vs ascending triangle guide covers the shapes this one sat closest to.
What 399 rising channels did next
Here is the full count. Out of 399 rising channels on daily FX:
- 322 closed below the projected lower line first (80.7%)
- 60 closed above the projected upper line first (15.0%)
- 17 did neither within 20 trading days (4.3%)
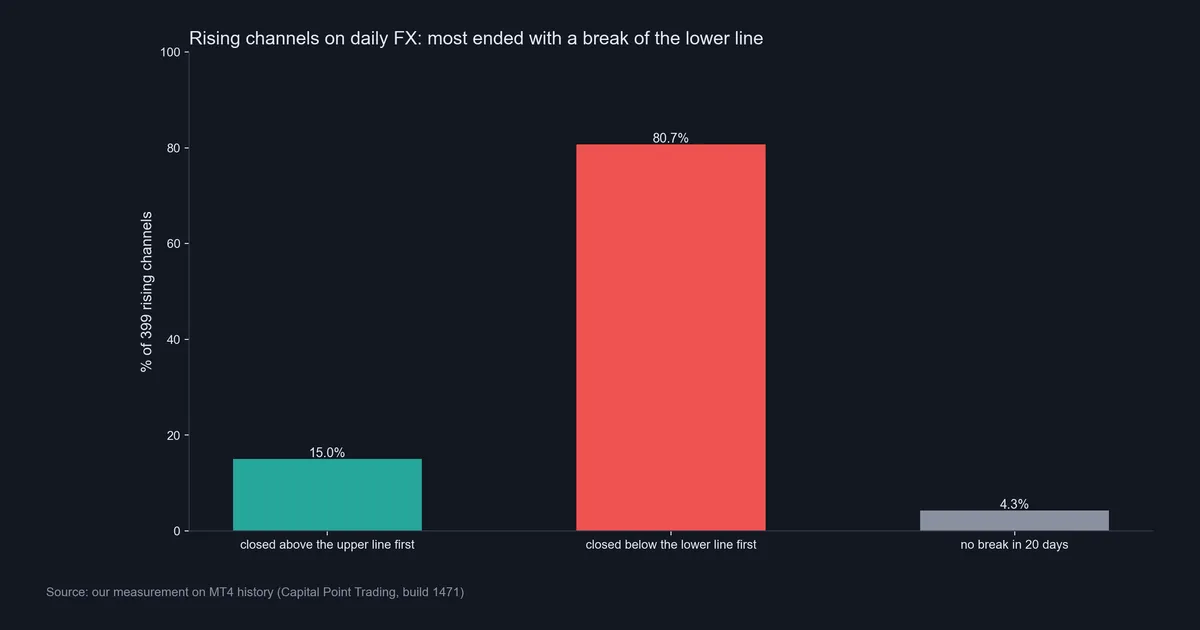
So the common story, “a rising channel is a bullish pattern”, did not hold in our data. But do not flip it into “rising channels are bearish”. Part of the 80.7% is pure geometry. The lower line rises every day. If price goes sideways, it crosses that line sooner or later. An upside break, by contrast, needs price to accelerate.
That means a break of the lower line often marks a pause, not a reversal. Gold shows the point well. On the XAUUSD daily chart, troughs rose from $3,996.06 on 29 July to $4,311.04 on 14 August 2026. Peaks rose from $4,449.83 on 13 August to $4,697.11 on 25 August. Then the climb stopped.
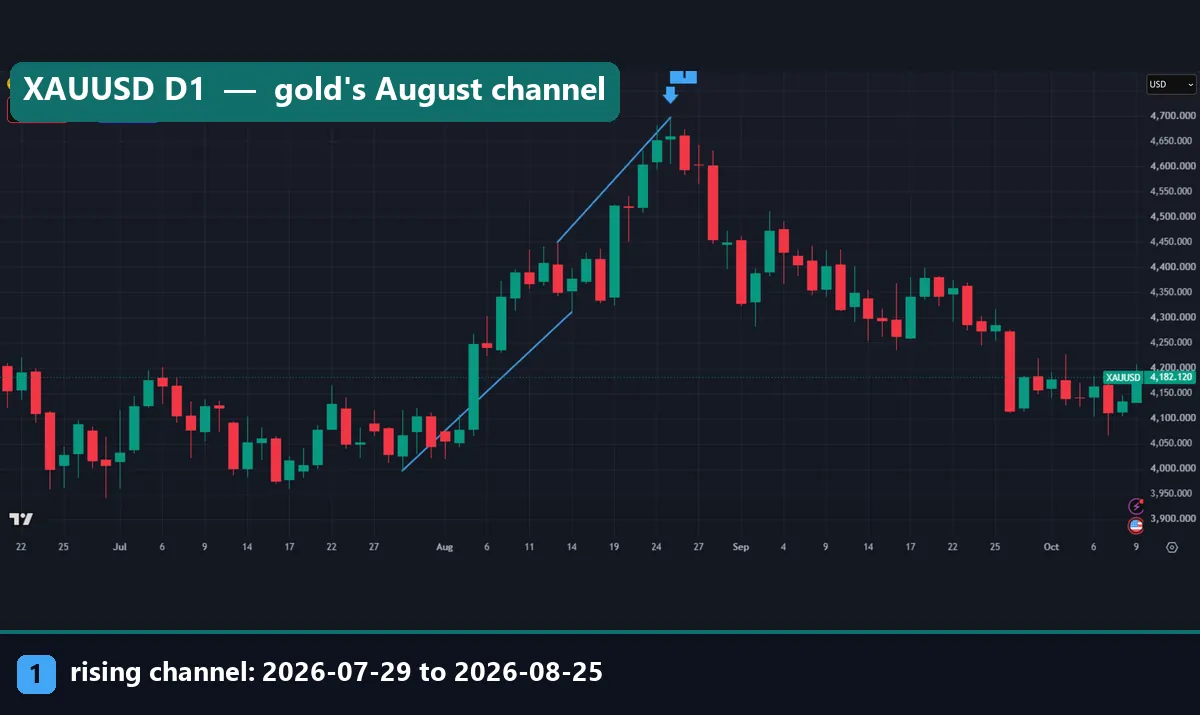
By 9 October gold traded near $4,182, below the second trough. Our guide on chart pattern failure explains why a broken line often says less than it seems.
Download the complete indicator database
Put these concepts on your charts. One email unlocks the full library of 1,380+ indicators with compiled MT4 and MT5 files, plus my TradingView scripts. No paywall, no spam, unsubscribe any time.
Get free access to my indicator database
One email unlocks 1,380+ free MT4, MT5 and TradingView indicators — the complete library. No single-tool download; you get the whole database.
Where it fails: five limits of the channel
First, it fails as a forecast. In our sample the lower line broke first in 80.7% of cases, and part of that is geometry. So neither side gives you a clean edge from the shape alone.
Second, it fails on drawing choice. Two traders rarely pick the same swing points. Shift one point by a bar and the projected line moves. As a result, the “break” can land days apart.
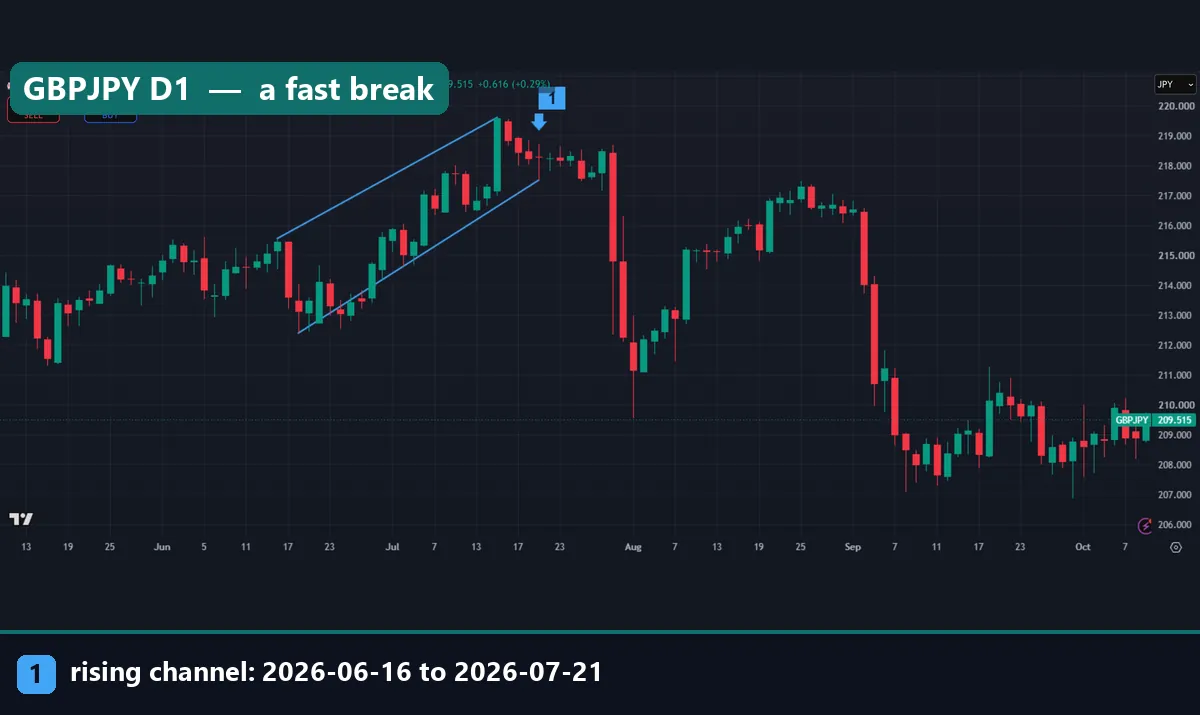
Third, it fails at the far edge. Sometimes a channel ends with a sudden, large drop. The GBPJPY daily chart below shows one. Peaks rose from 215.566 on 16 June to 219.614 on 15 July 2026. Troughs rose from 212.400 on 18 June to 217.524 on 21 July. Soon after, price fell well under the lower line, and by early August it traded below 211. A stop just under the line would have filled far worse than planned in a fast market.
Fourth, it fails in real time. The USDCHF daily chart shows a channel from 3 September to 1 October 2026. Troughs rose from 0.80523 to 0.81834, and peaks from 0.82640 to 0.83826. On 9 October price sat at 0.83094, still between the lines. Nobody knows yet which side breaks first.
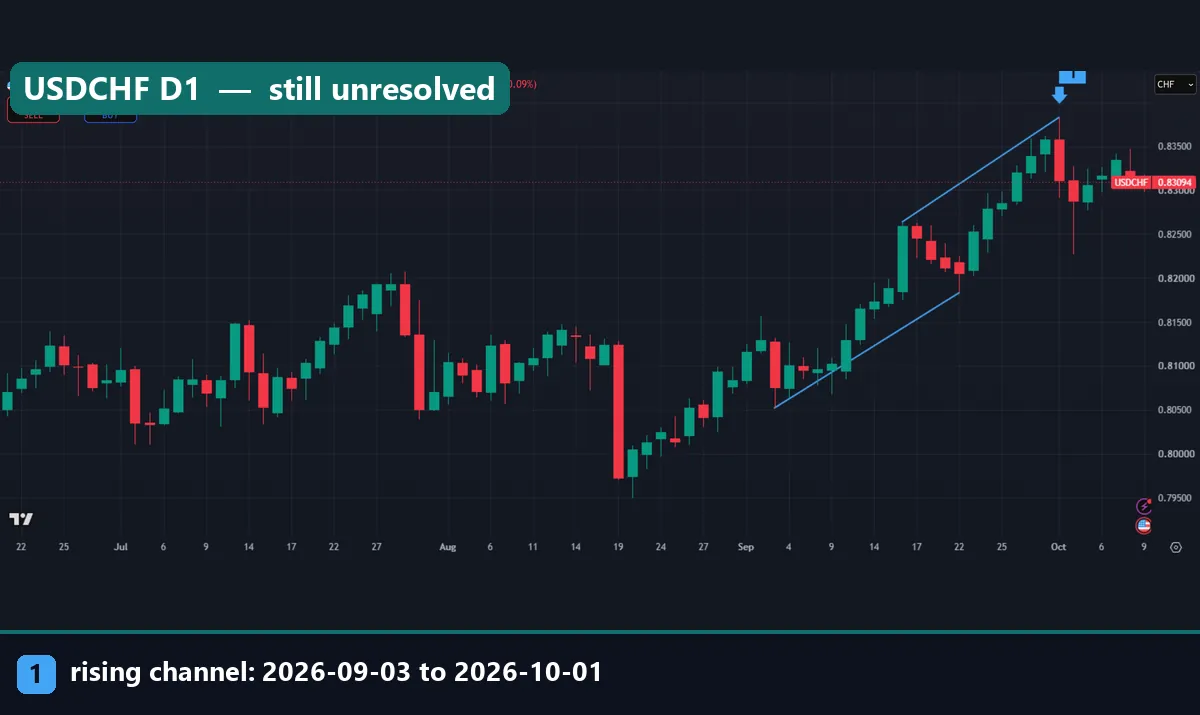
Finally, our test has limits. We used daily FX only, one broker feed and one follow-up window. We did not test gold, indices or stocks.
Using a channel as a map, not a signal
So what is the channel good for? Mostly, it frames the trend. It shows the pace of the climb and the size of a normal pullback. For example, the GBPUSD channel was about 200 to 233 pips tall, so a tight stop inside it would sit in normal noise. Our guide on how to use a stop loss covers placement.
Then, treat a close under the lower line as information, not a trigger. It tells you the pace has slowed. It does not tell you the trend has flipped. A lower low below the last trough says more. Our page on market structure in forex explains that check.
Four common mistakes
1. Forcing parallel lines. The built-in channel tools copy one line exactly. Real swings rarely fit, so the copied line floats away from the actual troughs. Draw both lines from real swing points instead.
2. Buying every touch of the lower line. The lower line rises each bar. So the longer a channel runs, the higher price must stay to respect it. Most of our channels broke that line within 20 days.
3. Reading a lower-line break as a reversal. A sideways drift can cross a rising line with no real selling. Instead, wait for structure: a close below the last trough, not just below the line.
4. Ignoring costs on small channels. An hourly channel can be under 70 pips tall. A trade from one side to the other is then small, so spread and commission take a larger share. All our numbers are before those costs.
Where to go next
If you want a tool to draw the lines for you, our auto trend channel indicator builds channels from swing points automatically.
For the swing points themselves, the ZigZag formula guide shows another way to pick peaks and troughs. Also, our measured move targets page covers projecting a channel height after a break.
Before you trust any pattern count, read our note on backtest sample size.
For outside reading, the trend line article on Wikipedia gives the general background.
FAQ about the ascending channel pattern
Is an ascending channel bullish or bearish?
Neither, on its own. In our 399 daily FX channels, 80.7% closed below the lower line first and 15.0% closed above the upper line first; the rising lower line explains part of that gap.
How many touches does an ascending channel need?
At least two peaks and two troughs, so four swing points. Our rule required all four inside 60 bars.
What is the difference between an ascending channel and a rising wedge?
In a channel the two lines stay close to parallel. In a rising wedge they converge. We kept channels only when the two slopes sat within 30% of each other.
What is a descending channel?
It is the mirror image: two falling lines joining lower peaks and lower troughs.
Should I use wicks or closes to confirm a break?
We used daily closes. A wick can pierce a line and reverse inside the same bar, so a close gives a cleaner record.
Does the ascending channel pattern work on lower timeframes?
The shape appears on hourly charts too, but we only counted daily channels. Costs also weigh more on small channels.
Can MT4 draw an ascending channel automatically?
MT4 has a manual equidistant channel tool. For automatic drawing you need a custom indicator that finds swing points and joins them.
Can I trade the ascending channel pattern profitably?
We measured line breaks, not trades, so we cannot say. Treat the channel as a map of the trend, size risk to its height, and remember that results are not guaranteed; past performance is not indicative of future results.
Last updated: 9 October 2026.

About the author
Written by Dominic Walsh, a Forex trader and MT4/MT5 indicator, Expert Advisor and script developer. Every tool on forexmt4systems.com is tested on live charts before release and ships with ready-to-use compiled MT4 (.ex4) and MT5 (.ex5) files. Learn more about the trader and developer behind this site.
How we build, test and correct every tool: Editorial & Testing Policy. Trading carries risk; see the disclaimer.