
The zigzag formula is simple: a new swing starts only after price turns back by a set amount from the last high or low. This guide settles three things. First, the exact rule behind the deviation setting. Second, what MT4’s Depth, Deviation and Backstep inputs and TradingView’s Deviation and Depth inputs really do. Third, how many swings each setting gave on real hourly data. We also show why three very different deviation values drew almost the same lines on one EURUSD chart.
What the ZigZag indicator actually is
The ZigZag is a filter, not a signal. It joins swing highs to swing lows with straight lines. So it hides the small wiggles and keeps only the moves you told it to care about.
That makes it a drawing tool for structure. Traders use it to mark market structure in forex, to anchor Fibonacci levels, and to count waves. However, it does not predict the next turn. It only confirms a turn after price has already moved the required distance.
Two families exist. The first uses a percentage or point threshold, called deviation. The second uses a bar count, called depth, where a swing point must be the highest or lowest bar in a window. Most real indicators mix both. That mix explains most of the confusion around ZigZag settings.
A Williams fractal is a depth rule with two bars on each side, so fractals are close kin.
The zigzag formula: deviation, depth and backstep
Here is the deviation rule in plain terms. The indicator tracks one running extreme at a time. While the last leg points up, it keeps the highest high seen so far, H. While the last leg points down, it keeps the lowest low, L.
- Up leg, then a top: a down leg starts when
Low <= H * (1 - d / 100), where d is the deviation in percent. - Down leg, then a bottom: an up leg starts when
High >= L * (1 + d / 100). - Extension: if price makes a new high during an up leg, H moves to that bar, and the line end moves with it.
The depth rule works on bars instead. A bar’s high is a pivot high when no bar within N bars on each side has a higher high. The low side mirrors it. So depth sets the minimum width of a swing, while deviation sets its minimum height.
TradingView’s help page on the Zigzag indicator in TradingView’s Help Center describes exactly this pairing. The bar input is split in two, rounded down, for the bars left and right. Then a pivot must also clear the percentage threshold from the last saved point.
How MT4’s ZigZag uses the same idea
MetaTrader 4 ships a ZigZag with three inputs. The original code is in the MetaQuotes ZigZag in the MQL5 Code Base. Its defaults are Depth 12, Deviation 5 and Backstep 3.
- Depth: the number of bars searched for the lowest low or highest high. A larger number means wider swings.
- Deviation: measured in points, not percent. So a value of 5 on a 5-digit pair means half a pip. That is tiny, so on MT4 the depth input does most of the work.
- Backstep: the number of bars over which the code clears a weaker competing high or low. It stops two swing points from sitting a bar or two apart.
Our downloads follow the MT4 style. The ZigZag indicator for MT4 and MT5 keeps the three classic inputs. It installs like any other file, and our guide on how to install MT4 and MT5 indicators covers the folders.
How we tested ZigZag settings
We ran two measurements and took six chart shots. You can read how we work in our editorial testing policy.
- Data: MetaTrader 4, build 1471 terminal history from Capital Point Trading, H1 bars, the last 6,000 bars per symbol.
- Symbols and windows: EURUSD from 22 December 2025 to 26 August 2026, GBPUSD from 22 December 2025 to 13 August 2026, and XAUUSD from 14 August 2025 to 20 August 2026.
- Deviation test: a pure deviation ZigZag at 0.1%, 0.3%, 0.6% and 1.0%, with no depth filter. A new leg starts after price reverses by that percentage from the last extreme.
- Depth test: pure depth pivots at 5, 12 and 24, where a bar must be the highest high or lowest low of N bars on each side.
- Charts: TradingView web chart, OANDA data, EURUSD and GBPUSD H1, taken on 7 October 2026 with the built-in Zigzag at Depth 10.
All counts are swing points per 1,000 bars. These are structure counts, not trades, so costs do not apply here.
ZigZag settings and what each one changes
The table lists every input we touched, on both platforms. The right-hand column says what moves when you raise the value.
| Input | Platform | Unit | Default or test value | Raise it and you get |
|---|---|---|---|---|
| Deviation (%) | TradingView | percent of price | tested 0.1, 0.3, 0.6, 1.0 | taller, rarer swings |
| Depth | TradingView | bars, split left and right | 10 in our shots | wider swings, later pivots |
| Extend to last bar | TradingView | on or off | on in our shots | a live tail to the newest bar |
| Depth | MT4 | bars | 12 | wider swings, later pivots |
| Deviation | MT4 | points | 5 | taller swings, but small at default |
| Backstep | MT4 | bars | 3 | fewer pivots packed close together |
Reading the ZigZag on a chart: 0.1%, 0.3% and 0.6%
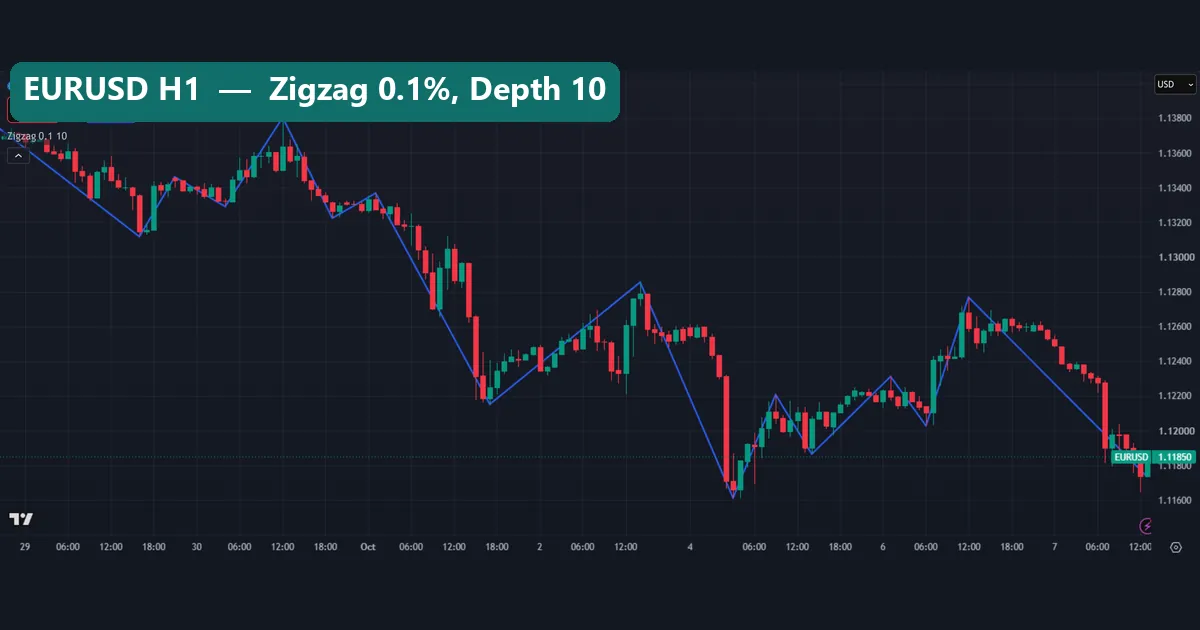
Our first three shots use the same EURUSD H1 window, from 29 September to 7 October 2026. Only the deviation changes. Yet the pictures look almost the same.
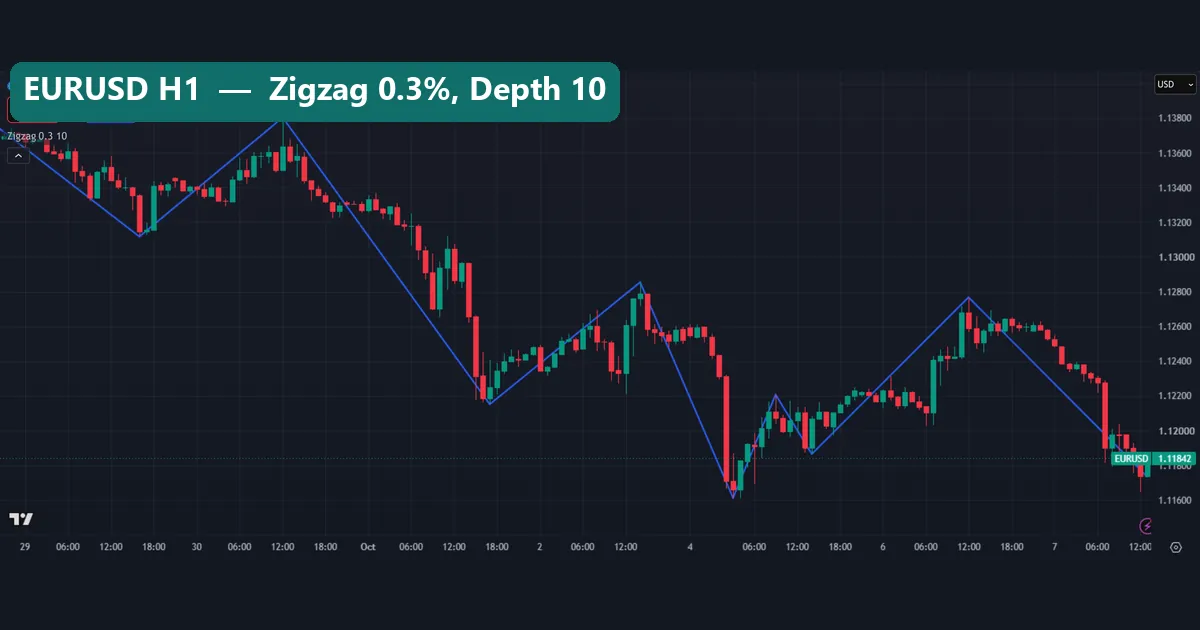
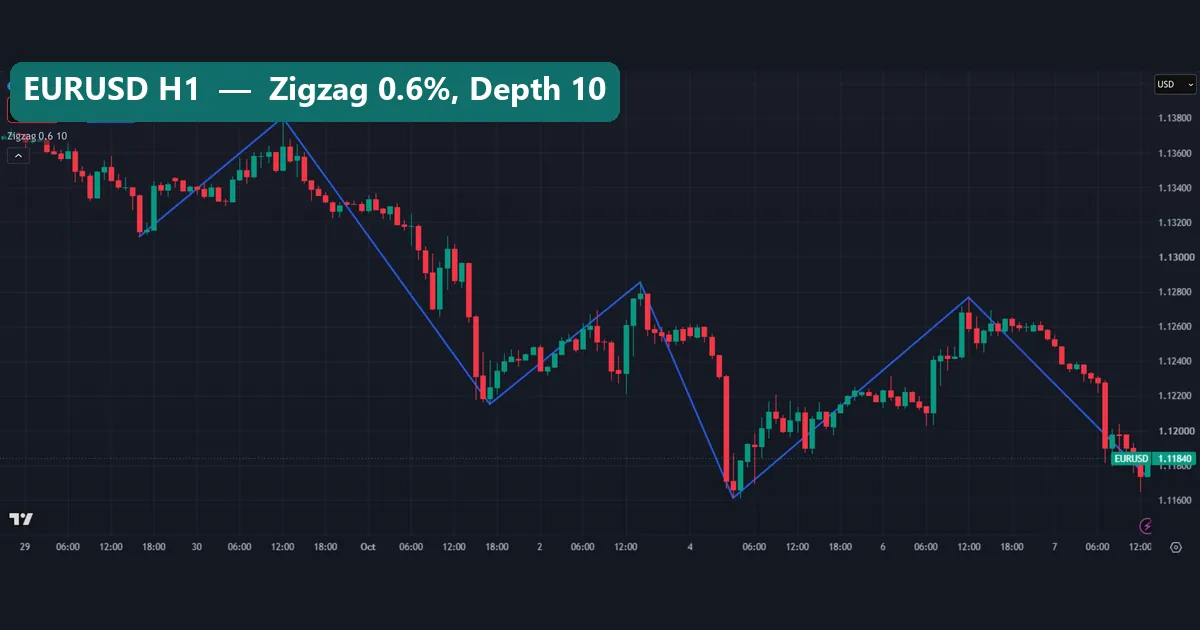
Look closer and a few small legs do drop out. At 0.1%, the line catches a few minor bounces around 30 September and 1 October, and again early on 6 October. At 0.3%, those vanish. At 0.6%, the first leg on 29 September also goes. Still, the main turns stay put in all three: the top on 30 September near 1.1380, the low near 1.1215, and the low near 1.1161.
So why so little change? Because Depth stays at 10. TradingView splits that into five bars on each side, so a pivot must be the extreme of an 11-bar window. On this week of EURUSD, nearly every pivot that passed the depth test was already larger than 0.3%. The depth input decided the swings, and the deviation only trimmed the edges.
The two inputs interact. When one is strict, changing the other barely moves the chart. Test one input at a time, and keep the other loose while you do it.
Worked example: the EURUSD swing into 6 October
Take the leg from the low to the next high in our shots. Our facts file lists 1.11612 as the 60-day low as of 7 October 2026. The 6 October daily high was 1.12768, and the chart high on that day sits at that level.
- Leg size: 1.12768 minus 1.11612 is 0.01156, or 115.6 pips.
- Leg in percent: 0.01156 divided by 1.11612 is about 1.04%. So even a 1.0% setting would keep this leg.
- When the up leg confirmed: at 0.3%, a new up leg needs a high of 1.11612 times 1.003, which is 1.11947. At 0.6%, it needs 1.12282.
- When the next down leg confirms: from the 1.12768 top, the 0.1% trigger is 1.12655. The 0.3% trigger is 1.12430, and the 0.6% trigger is 1.12091. At 1.0% it is 1.11640.
Next, compare that with where price stood. The last close in our facts file for 7 October was 1.11782. That is 98.6 pips, or about 0.87%, below the top. So at 0.6% the down leg was confirmed. At 1.0%, however, it was not, and the line would still end at 1.12768.
The same top therefore counts as a finished swing on one setting and an open question on another. Keep that in mind before you anchor a Fibonacci retracement to the newest ZigZag point.
What deviation alone does: our measurement
To see deviation without depth in the way, we removed the bar filter.
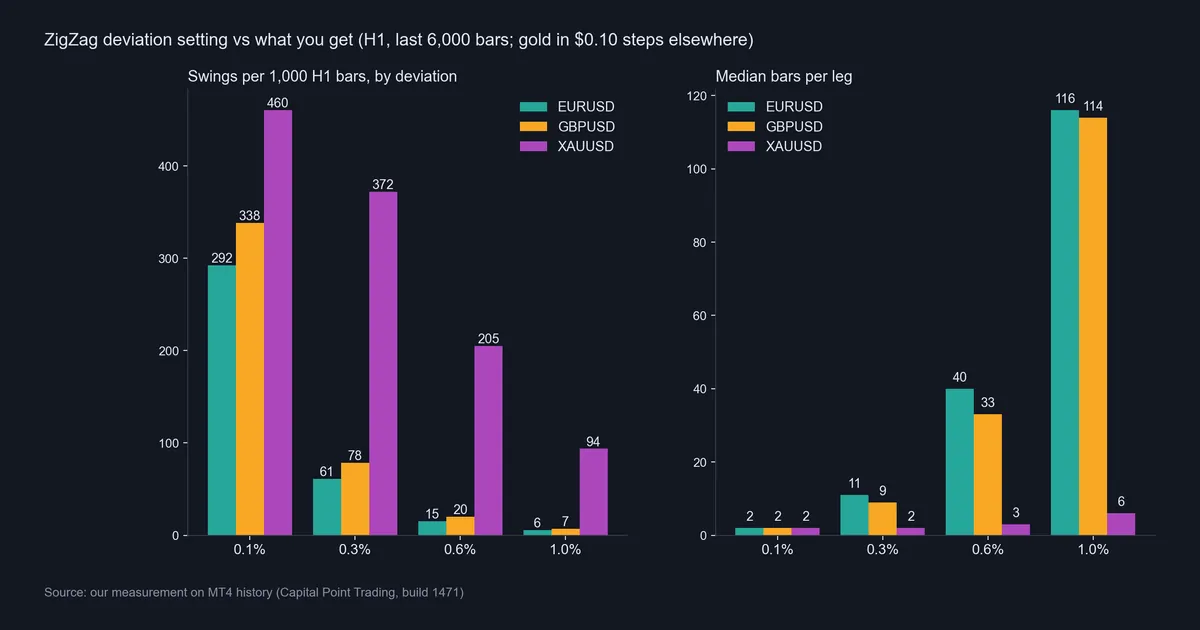
On EURUSD, a pure 0.1% rule gave 292.5 swings per 1,000 H1 bars, with a median leg of 24.4 pips over 2 bars. At 0.3% that fell to 61.0 swings, with 58.7-pip legs over 11 bars. At 0.6% it dropped to 15.3, and at 1.0% to just 5.7, with a median leg of 184.0 pips lasting 116 bars.
GBPUSD moved a little more: 338.2 swings at 0.1% and 7.1 at 1.0%. Gold was a different animal. At 1.0%, XAUUSD still printed 93.8 swings per 1,000 bars, with a median leg of $82.91 over 6 bars. Even at 0.1%, its median leg was $28.46. So one percent setting cannot fit gold and EURUSD at once.
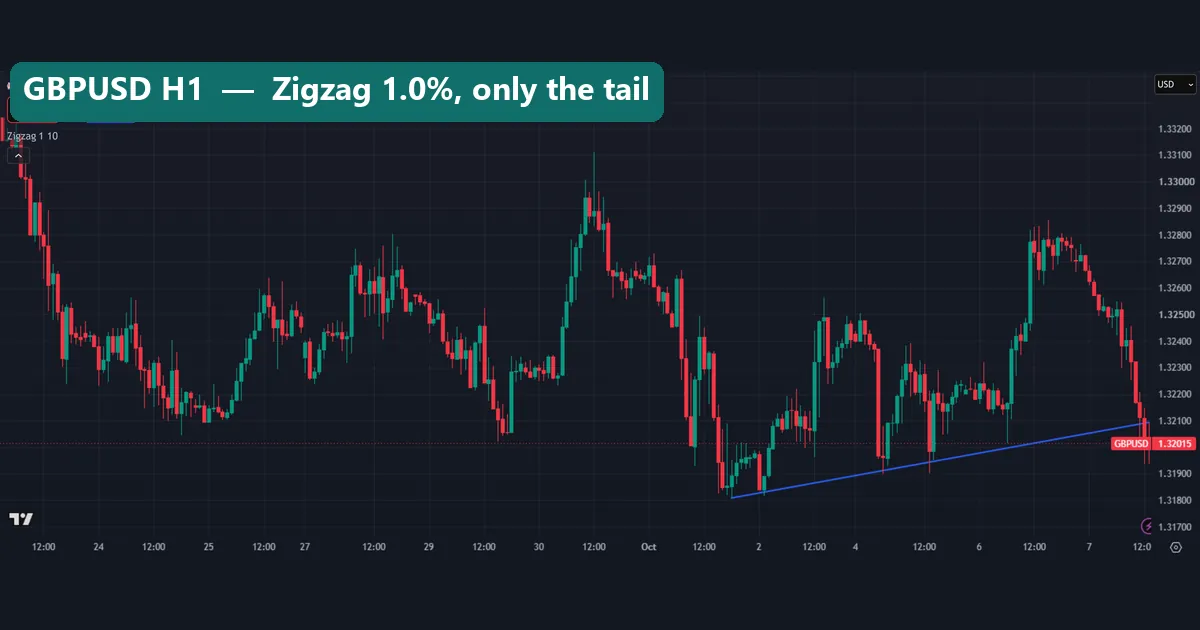
The GBPUSD shot shows the other extreme. At 1.0% with Depth 10, the whole window, from about 1.318 to 1.331 on the price scale, never reversed by a full 1%. So the chart shows only one line, the live tail from the low to the last bar.
Download the complete indicator database
Put these concepts on your charts. One email unlocks the full library of 1,380+ indicators with compiled MT4 and MT5 files, plus my TradingView scripts. No paywall, no spam, unsubscribe any time.
Get free access to my indicator database
One email unlocks 1,380+ free MT4, MT5 and TradingView indicators — the complete library. No single-tool download; you get the whole database.
Where it fails: the limits of the ZigZag
The last leg repaints. That tail in the GBPUSD shot is not a swing yet. It moves with every tick and can flip direction or extend. Settled history to the left stays fixed, but the newest point does not. Our guide on what repainting means explains why that matters for any alert.
Confirmation is always late. A 0.6% rule on EURUSD needs roughly 0.6% of travel before it admits the top is in. Depth then adds its right-hand bars. So by the time a pivot prints, a good part of the move is gone.
The settings do not travel. Our data shows gold at 1.0% still swung more often than EURUSD at 0.3%, 93.8 against 61.0 swings per 1,000 bars. Point-based MT4 deviation is worse, because 5 points means a different thing on every symbol.
Finally, the ZigZag says nothing about direction ahead. It describes moves that already happened. TradingView’s own help page lists uses like support, resistance and wave counts.
If you need fixed points for back-testing, a non-repaint ZigZag arrow indicator or a double ZigZag indicator only marks a pivot after confirmation. That trades speed for honesty.
Depth: what the settings box and our depth test show
TradingView’s built-in Zigzag has just three inputs on our chart: Deviation (%), Depth and Extend to last bar. The help page lists newer names for the same ideas, so the labels may differ on your version.
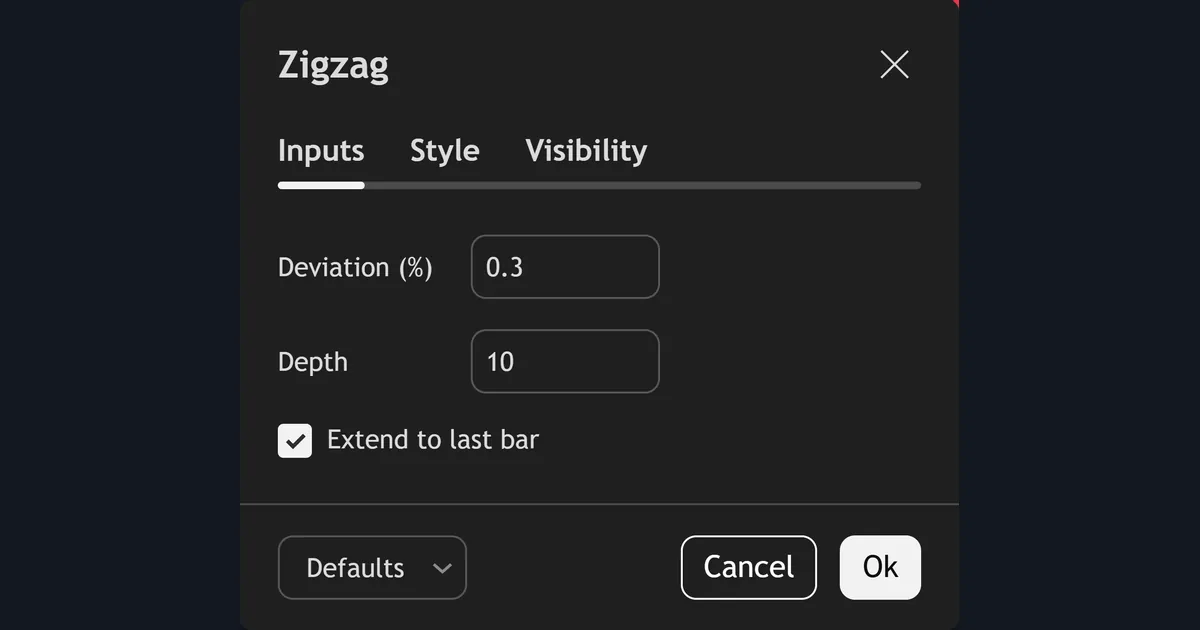
Next, look at depth on its own. With pure depth pivots and no deviation filter, the three symbols land close together.
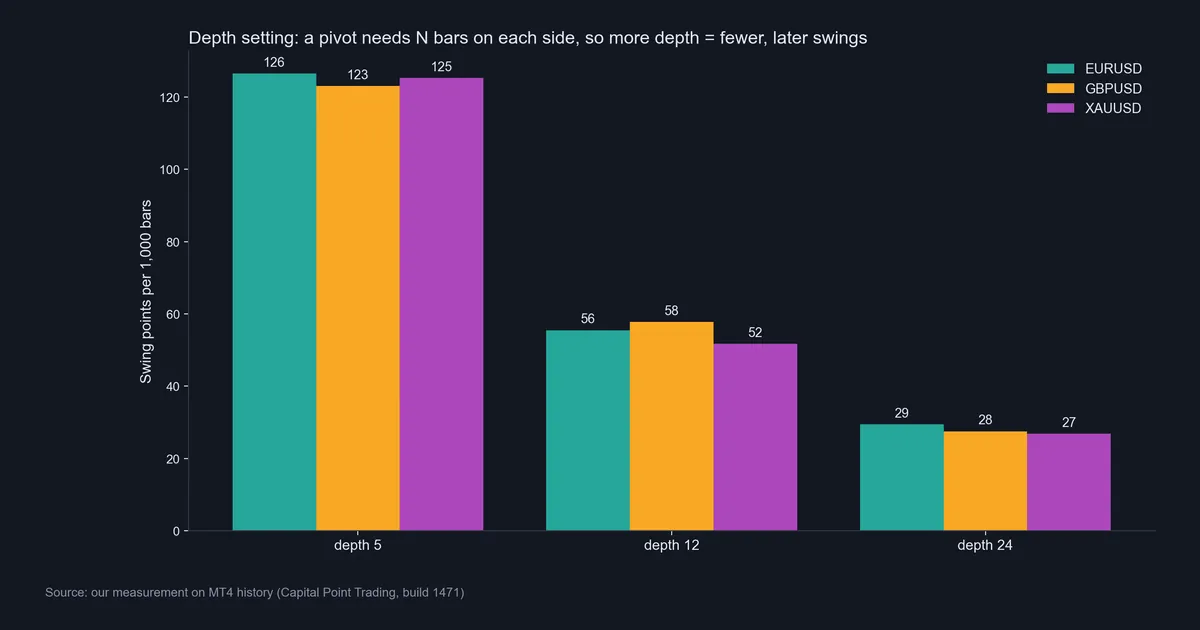
Depth 5 gave 126.5 swing points per 1,000 bars on EURUSD, 123.1 on GBPUSD and 125.3 on XAUUSD. Depth 12 gave 55.5, 57.8 and 51.7. Depth 24 gave 29.4, 27.5 and 26.8. In short, depth behaves the same on every symbol, while deviation does not.
This also explains the first three shots. TradingView’s Depth 10 means five bars each side, the same rule as our depth 5 test. That alone caps EURUSD near 126 swings per 1,000 bars. A 0.1% deviation would allow 292, so the cap from depth wins, and 0.1% looks like 0.3%.
Common mistakes with the zigzag formula
- Changing deviation while depth decides everything. As our EURUSD shots show, a strict depth hides most deviation changes. Loosen depth first, then tune deviation.
- Using one setting for every symbol. Gold at 1.0% still swung 93.8 times per 1,000 bars, against 5.7 for EURUSD. Set percent values per symbol.
- Trading the live tail. The last leg is a guess that can vanish. Treat only points with a confirmed opposite leg as swings.
- Reading MT4 Deviation as percent. MT4 counts it in points. A value of 5 is half a pip on EURUSD, not 5%.
Where to go next
If you trade from MT4 alerts, the ZigZag alert indicator flags new pivots. The Swing ZZ ZigZag indicator is a close cousin for swing marking, and the 3 Level ZZ Semafor indicator draws ZigZag points at three depths at once.
For structure work, read Elliott wave theory and our harmonic pattern cheat sheet, since both lean on clean swing points. To pick a symbol with steady swings, see the best forex pair for swing trading.
Outside our site, the ZigZag article in StockCharts ChartSchool covers the percent method on stock charts. The Zig Zag indicator entry at Investopedia gives a short plain-English summary.
FAQ: the zigzag formula
What is the zigzag formula in one line?
A new leg starts when price reverses from the last extreme by at least the deviation: below H times (1 minus d/100) for a top, or above L times (1 plus d/100) for a bottom.
What does Depth mean in the ZigZag?
Depth is a bar count. A swing point must be the highest high or lowest low within that window. On TradingView the value splits in two, so Depth 10 means five bars on each side.
Why do my 0.1% and 0.3% ZigZags look the same?
Because depth is doing the filtering. On our EURUSD H1 chart with Depth 10, nearly every pivot that passed the depth test was already bigger than 0.3%, so the deviation change barely showed.
What does Backstep do on MT4?
Backstep is the number of bars over which the MT4 code clears a weaker competing high or low. It keeps two pivots from landing almost on top of each other. The default is 3.
Is MT4 ZigZag deviation a percentage?
No. MT4 measures it in points. The default of 5 is half a pip on a 5-digit pair, so depth sets most of the shape there.
Does the ZigZag repaint?
Yes, on the last leg. The newest point moves until price reverses by the full deviation. Older, confirmed points stay where they are.
What deviation suits EURUSD on H1?
That depends on the swing size you want. In our test, 0.3% gave 61.0 swings per 1,000 bars with median legs of 58.7 pips, and 0.6% gave 15.3 swings with 114.2-pip legs.
Can the ZigZag tell me where price goes next?
No. It only joins moves that already happened, and its last leg can change. Use it to mark structure, not to forecast; results are not guaranteed; past performance is not indicative of future results.
Last updated: 8 October 2026.

About the author
Written by Dominic Walsh, a Forex trader and MT4/MT5 indicator, Expert Advisor and script developer. Every tool on forexmt4systems.com is tested on live charts before release and ships with ready-to-use compiled MT4 (.ex4) and MT5 (.ex5) files. Learn more about the trader and developer behind this site.
How we build, test and correct every tool: Editorial & Testing Policy. Trading carries risk; see the disclaimer.