
The repaint meaning in trading is simple: an indicator repaints when a signal or line it already drew on a closed bar later moves, changes or vanishes. So the chart may show what the tool knows now, not what it knew then. This guide settles three things. First, what repainting is and what it is not. Next, how often a live ZigZag rewrote its newest swing point in our MT4 data. Then, how to spot repainting before it costs you a backtest.
Repaint meaning in plain terms
Every indicator draws a value for each bar. On a bar that has closed, that value should stay put. If it does, the indicator does not repaint. If the value on an old bar later changes, the indicator repaints. So the test is about history, not about the bar that is still forming.
A repainting tool is not broken by default. Some tools repaint by design, because they need future bars. A swing high, for example, is only a swing high once price has fallen away from it. Until then, it is a guess. The ZigZag on our first chart is the classic case. It connects swing highs and lows, but its newest point is always provisional.
The trouble starts when a trader reads the chart as a record of past signals. On a repainting tool, the old signals you see today were not always there on the day. So history looks cleaner than live trading was. For a wider view of why some tools wait for data, see our guide to leading vs lagging indicators.
How a ZigZag repaints: the mechanism
The deviation ZigZag follows one rule. It tracks the most extreme price since the last swing point. Then it waits for a reversal of a set size. For a swing high H, a new low leg is confirmed when price falls to H x (1 - D / 100) or below, where D is the deviation in percent. The rule flips for lows.
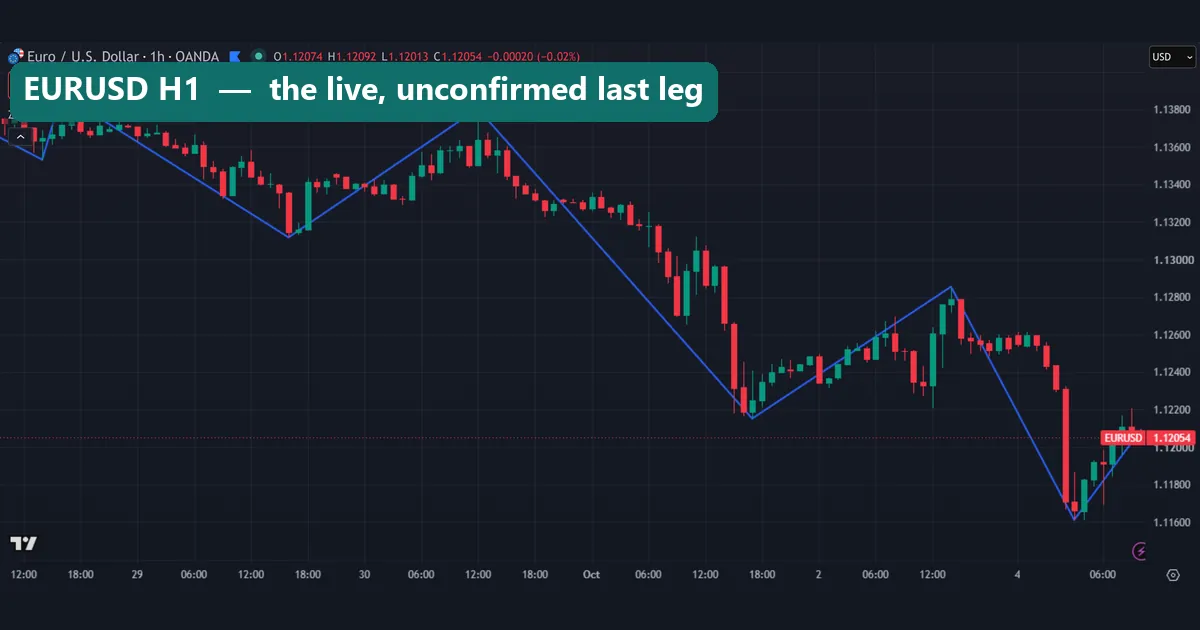
Here is the size of that reversal in our charts. EURUSD closed near 1.12054 on our first shot. So a 0.3% reversal is about 0.0034, or roughly 34 pips. Gold closed near 4,158.105 on our third shot. So a 0.6% reversal is about $25.
Until price covers that distance, the ZigZag cannot know where the current leg ends. So it keeps moving the newest point to each fresh extreme. If price makes a higher high, the last peak jumps forward to the new bar. That jump is the repaint. The older confirmed points, by contrast, stay fixed. Only the last leg is in play. The same idea sits behind Williams fractals, which need two bars on each side before a fractal can print. StockCharts gives a clear outline of the method in its ZigZag article at StockCharts ChartSchool.
Repaint vs recalculating vs lookahead
Traders often lump three different things under one word. Each needs a different fix.
- Recalculating the current bar. Almost every indicator updates its value on the open bar as ticks arrive. An RSI or a moving average moves until the bar closes, then freezes. That is normal. Still, a signal that appears mid-bar can vanish before the close.
- True repaint. Values on bars that have already closed change later. The ZigZag, fractal-based arrows and centered averages all do this, because they use bars to the right of the point they draw.
- Lookahead. The script reads data it could not have had at the time. A common cause is a higher-timeframe request that pulls the final daily close onto bars from earlier in that day. History looks perfect. Live bars cannot match it.
TradingView sorts these cases in its Pine Script repainting page in the TradingView docs. Lookahead is also a backtest problem, which Investopedia covers in its look-ahead bias entry at Investopedia.
How we tested
Our data came from MetaTrader 4, build 1471, with Capital Point Trading history. We used H1 bars on two symbols. For EURUSD, we ran a 0.3% deviation ZigZag from 12 January to 26 August 2026, which gave 3,880 bars. For XAUUSD, we used 0.6%, from 15 December 2025 to 20 August 2026, which gave 3,999 bars.
At every new bar, we recomputed the ZigZag on the 300 bars visible so far. Then we checked one thing: did its newest swing point jump to a different bar? We also logged how far the price of that point moved when it jumped.
For the charts, we used the TradingView web chart with OANDA H1 data and the built-in Zigzag. We took those shots on 5 October 2026. Two images are our own snapshots of the same ZigZag drawn at two moments. Our full method rules sit on the editorial testing policy page.
ZigZag settings that change how much it repaints
The TradingView Zigzag has three inputs. Each one changes how often the last leg moves, and how far. The table lists what we used.
| Input | What it does | Our value | Effect on repainting |
|---|---|---|---|
| Deviation (%) | Minimum reversal, in percent, before a new leg counts | 0.3 (EURUSD), 0.6 (XAUUSD) | Larger values confirm fewer swings, so the last leg stays open for longer |
| Depth | Number of bars used to find each pivot high or low | 10 | Higher depth delays each pivot, so confirmation comes later |
| Extend to last bar | Draws a line from the last pivot to the current bar | On (first and third shots), off (fifth shot) | Shows the unconfirmed leg on screen; it does not change the confirmed points |
No setting removes the repaint. If you want to read how built-in scripts handle inputs, our guide to the Pine Script documentation is a good place to start.
Reading a repainting ZigZag on a chart
On a live chart, split the ZigZag into two parts. Up to the last confirmed swing is history; the final leg is a draft. On our first shot, the draft is the blue line rising from the low near 1.11600 on 5 October to the current price.
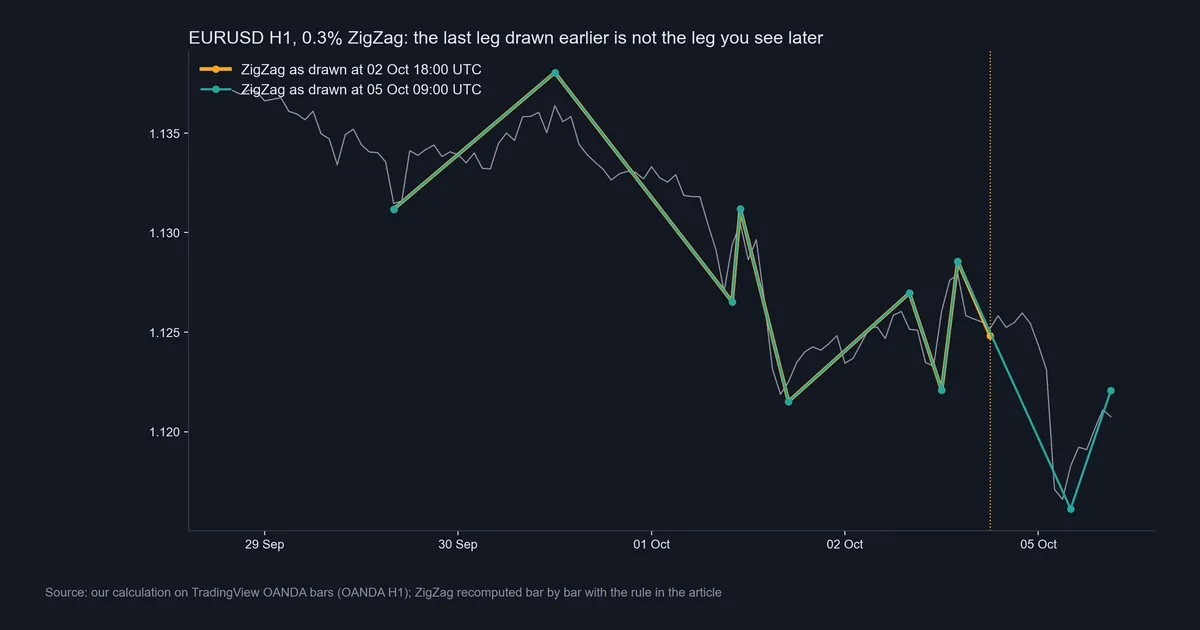
Our snapshot chart makes the draft visible. The orange line is the ZigZag as it stood at 18:00 UTC on 2 October. The teal line is the same ZigZag at 09:00 UTC on 5 October. Both lines agree on every point up to the high late on 2 October. After that, they part. The orange line ends at a point near the dotted marker. The teal line ignores that point and drops to a new low on 5 October instead.
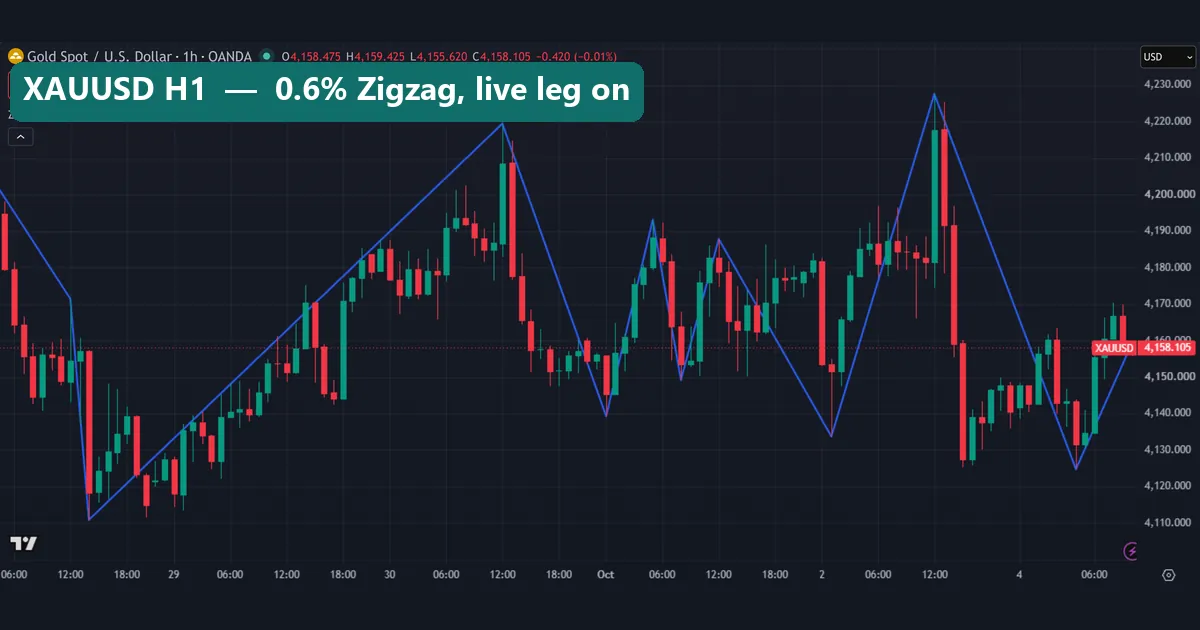
Gold shows the same shape at a wider deviation. The 0.6% Zigzag on XAUUSD H1 swings through several legs between 29 September and 4 October. Here too, the last line runs from the final low to the current bar. In short, the newest segment on any of these charts is a forecast of a swing, not a record of one.
Worked example: EURUSD H1, 1 to 5 October 2026
We took four snapshots of the EURUSD Zigzag on OANDA H1 data. Each one records where the line ended and which swing was the last confirmed one.
- At 17:00 UTC on 1 October, the line ended on the current bar. The last confirmed swing was a high at 11:00 UTC that day.
- At 08:00 UTC on 2 October, the 17:00 bar from the day before had become a confirmed low. So that draft point survived.
- When the market reopened at 23:00 UTC on 4 October, the line ended at 18:00 UTC on 2 October. The last confirmed swing was a high at 14:00 UTC on 2 October.
- By 09:00 UTC on 5 October, the confirmed sequence ran from that 14:00 high straight to a low at 04:00 UTC on 5 October.
The 18:00 endpoint from step 3 never became a swing point. It sat on the chart all weekend, then vanished on the first sharp drop. By contrast, the endpoint in step 1 did hold. That is the core lesson. You cannot tell which draft point will survive while you are looking at it.
How often the newest swing point moved in our data
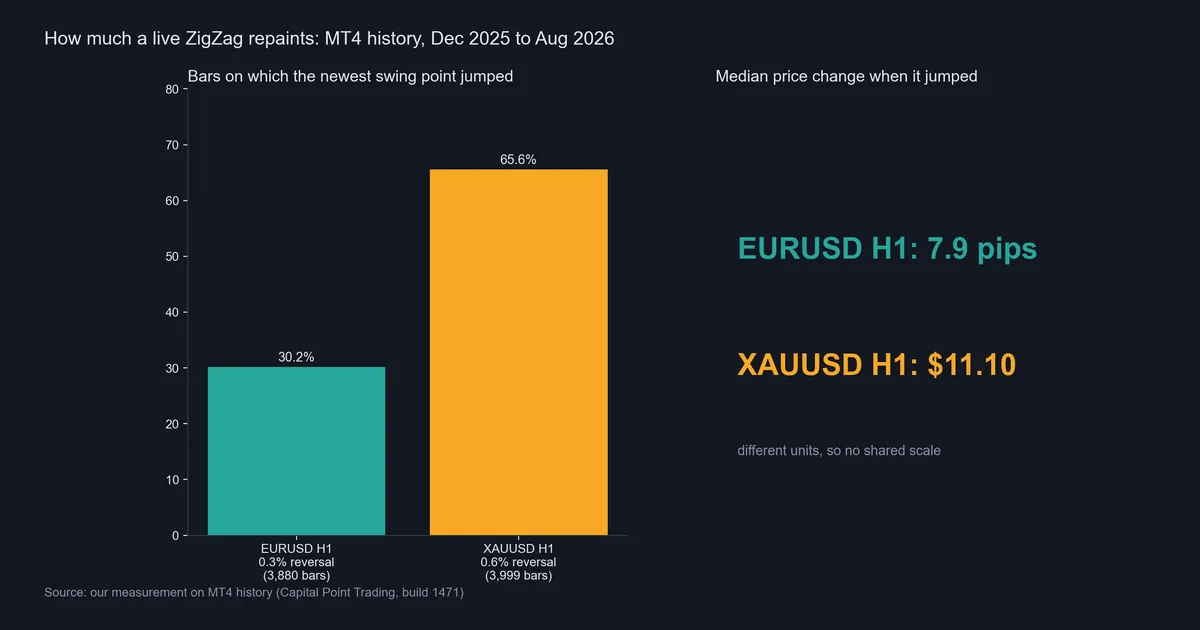
Across 3,880 EURUSD H1 bars, the newest swing point jumped to another bar on 30.2% of bars. When it jumped, the median price change was 7.9 pips. On XAUUSD, across 3,999 H1 bars, it jumped on 65.6% of bars, with a median change of $11.10. These are our measurements, one setting per symbol.
Gold repainted more often, even with double the deviation.
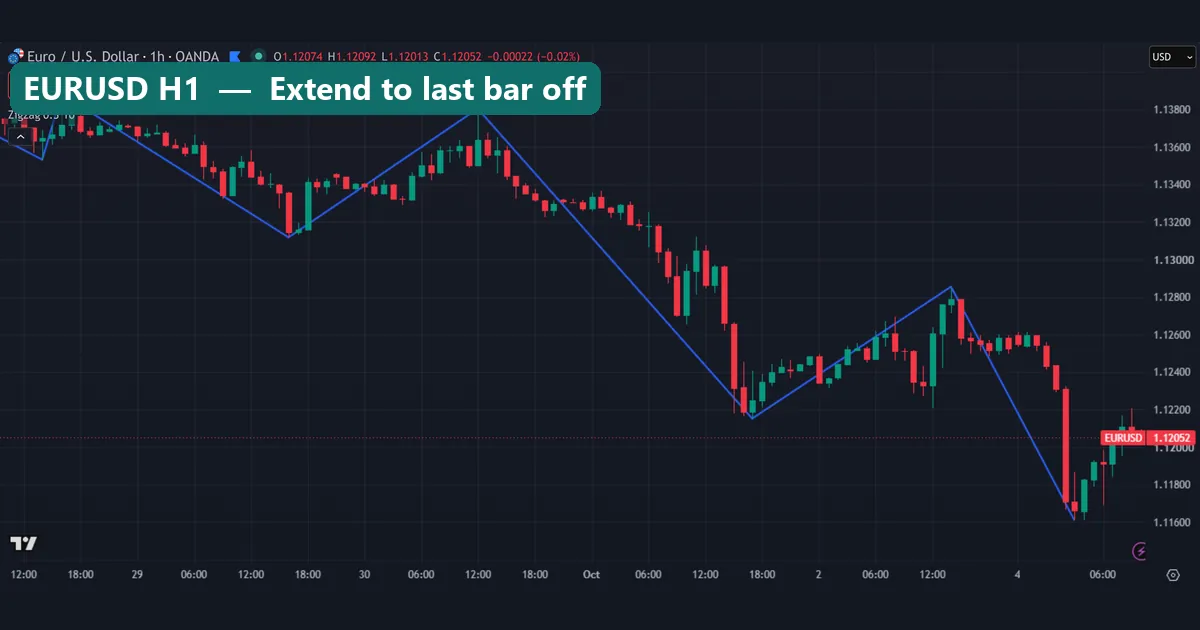
Next, compare our fifth shot with the first. It is the same EURUSD window with “Extend to last bar” switched off. The rising leg from the 5 October low is gone. The line now stops at the last pivot. However, that pivot can still move. Switching off the extension hides the draft leg, but it does not freeze the newest point.
Download the complete indicator database
Put these concepts on your charts. One email unlocks the full library of 1,380+ indicators with compiled MT4 and MT5 files, plus my TradingView scripts. No paywall, no spam, unsubscribe any time.
Get free access to my indicator database
One email unlocks 1,380+ free MT4, MT5 and TradingView indicators — the complete library. No single-tool download; you get the whole database.
Where it fails
A repainting ZigZag fails in a few clear ways. First, its historical swings look like perfect entries at tops and bottoms. They were not available at those moments, so any backtest built on them is fiction. Second, alerts tied to the last leg can fire, then refer to a point that later moves. Third, the jumps are not tiny. In our EURUSD data, the median jump was 7.9 pips.
Our test has limits too. It covers two symbols, one timeframe and one deviation each. It uses a 300-bar window, so a longer window could change some results. Also, the MT4 history comes from one broker’s feed. Finally, we measured how often the tool changed its mind. We did not measure whether trading it makes or loses money, so read the figures as a description of behavior only.
Non-repainting versions have their own cost. They wait for confirmation, so every signal arrives late. That is the trade-off, not a free fix.
Checking the settings and a second market
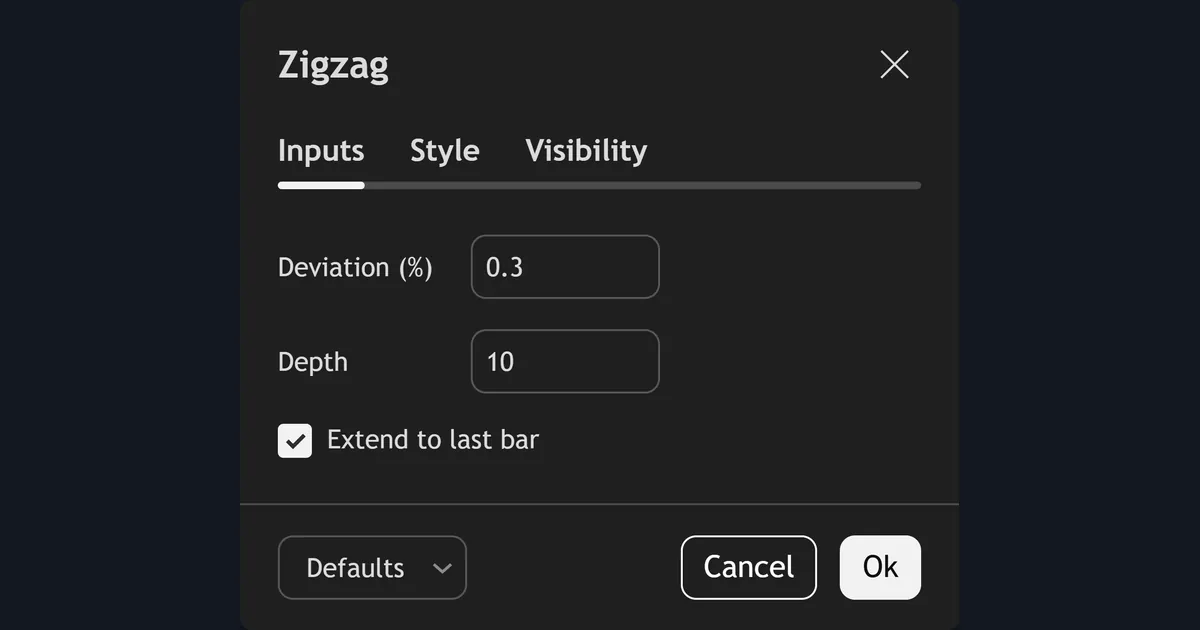
The settings dialog shows the inputs behind our EURUSD shots: Deviation 0.3, Depth 10, and “Extend to last bar” ticked. A tick in that last box means the final line is a draft.
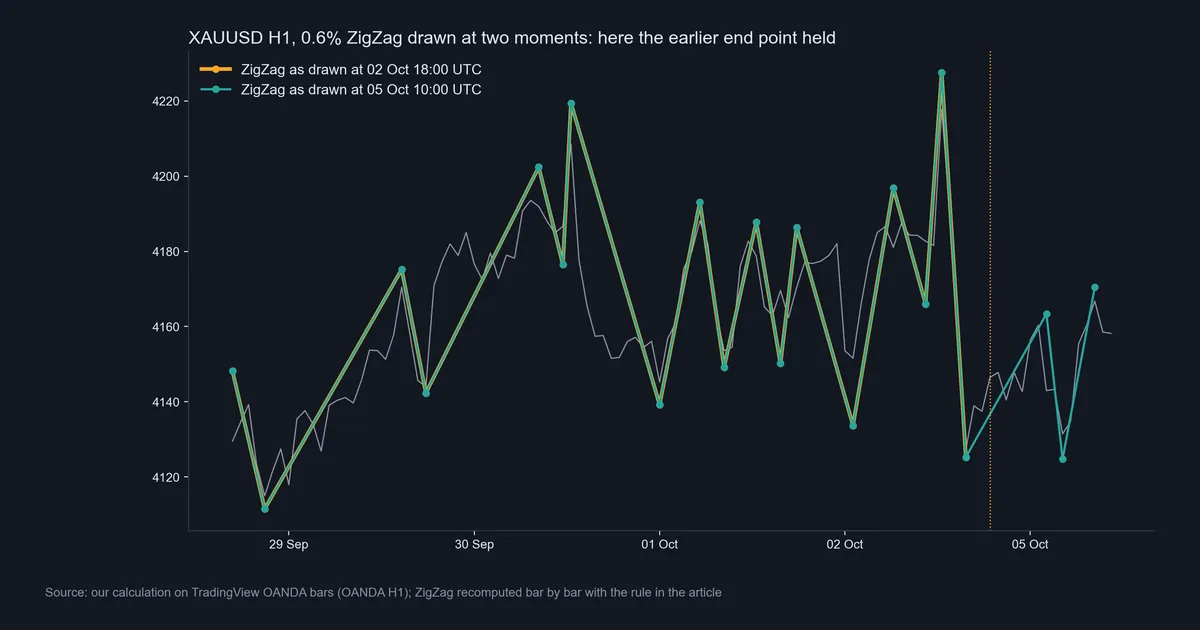
Our gold snapshot pair works as a contrast case. The orange line, drawn at 18:00 UTC on 2 October, ends at the late low on that day. The teal line, drawn at 10:00 UTC on 5 October, keeps that low and then adds new legs after the weekend. So here the last point held. That fits the 65.6% figure: gold moves its last point often, but not on every bar. Still, one pair of snapshots proves little; the bar-by-bar count is the number to use.
Common mistakes with repainting indicators
- Backtesting on the finished chart. Scrolling back and counting clean arrows tests the hindsight version. Our page on common backtesting mistakes covers this trap and others.
- Trusting a signal before the bar closes. That is the recalculation issue, not true repaint. Still, it produces the same loss. Wait for the close if the tool allows it.
- Assuming “non-repaint” in a name means anything. A label is a claim. Test it the way we did: watch the tool bar by bar, or forward test it on a demo.
- Turning off the live leg and calling it fixed. As our fifth shot shows, hiding the draft line still leaves the newest pivot free to move.
How to check any indicator for repainting
You do not need code to run a basic check. First, take a screenshot of the indicator now. Then come back after 20 or 30 bars and take another one of the same window. If any arrow, line or swing on a closed bar has moved, the tool repaints.
Next, step through bars one at a time with TradingView bar replay or the visual mode of the MT4 Strategy Tester. Our guide to the MT4 Strategy Tester shows where visual mode lives. For coders, MQL5 documents how indicators recompute bars in its OnCalculate reference on MQL5.com. An indicator that rewrites more than the newest bar on each call is worth a closer look.
Finally, run a short forward test. Our explainer on what forward testing is covers the setup. Live results far worse than history hint at repaint or lookahead.
Where to go next
If you want tools that confirm on closed bars, start with our list of the best non-repaint indicators for MT4. Then use our MT4 and MT5 indicator install guide to load one and run the screenshot check above.
ZigZag swings feed many methods. For structure work, read market structure in forex. For retracement levels drawn from swings, see how to use Fibonacci retracement. Multi-timeframe setups carry the lookahead risk, so read multi-timeframe analysis as well. Also, the difference between test types is set out in backtesting vs forward testing.
FAQ: repaint meaning
What does repaint mean in trading?
It means an indicator changes values or signals on bars that have already closed. So the chart you see later is not the chart you saw at the time.
Is every indicator that moves on the current bar repainting?
No. Most indicators update the open bar until it closes, then freeze. That is recalculation. True repaint changes closed bars after the fact.
Why does the ZigZag repaint?
It needs a reversal of a set size to confirm a swing. Until price covers that distance, the newest point keeps moving to each fresh extreme.
How often did the newest ZigZag point move in your test?
On EURUSD H1 at 0.3%, it moved on 30.2% of 3,880 bars. On XAUUSD H1 at 0.6%, it moved on 65.6% of 3,999 bars.
Does turning off “Extend to last bar” stop the repaint?
No. It hides the line from the last pivot to the current bar. However, the newest pivot can still jump to a later bar.
What is lookahead in an indicator?
It is the use of data the script could not have known at the time, such as a final daily close shown on earlier hourly bars. History then looks better than live trading can.
Can a repainting indicator still be useful?
Yes, as a map of past swings and structure. But it should not be used to count historical signals or to backtest entries.
Will a non-repainting indicator make better trades?
Not by itself. It only shows signals you could have acted on at the time, and those signals arrive later, so results are not guaranteed; past performance is not indicative of future results.
Last updated: 5 October 2026.

About the author
Written by Dominic Walsh, a Forex trader and MT4/MT5 indicator, Expert Advisor and script developer. Every tool on forexmt4systems.com is tested on live charts before release and ships with ready-to-use compiled MT4 (.ex4) and MT5 (.ex5) files. Learn more about the trader and developer behind this site.
How we build, test and correct every tool: Editorial & Testing Policy. Trading carries risk; see the disclaimer.