
This harmonic pattern cheat sheet gives you the exact Fibonacci ratios for every major shape in one place, plus the checks that separate a valid pattern from a drawing that merely looks right. Harmonic trading measures the legs of a five-point structure and only accepts it when each leg lands inside a defined ratio window. The discipline is in the measuring, so the tables below are the heart of the guide.
How the five points work
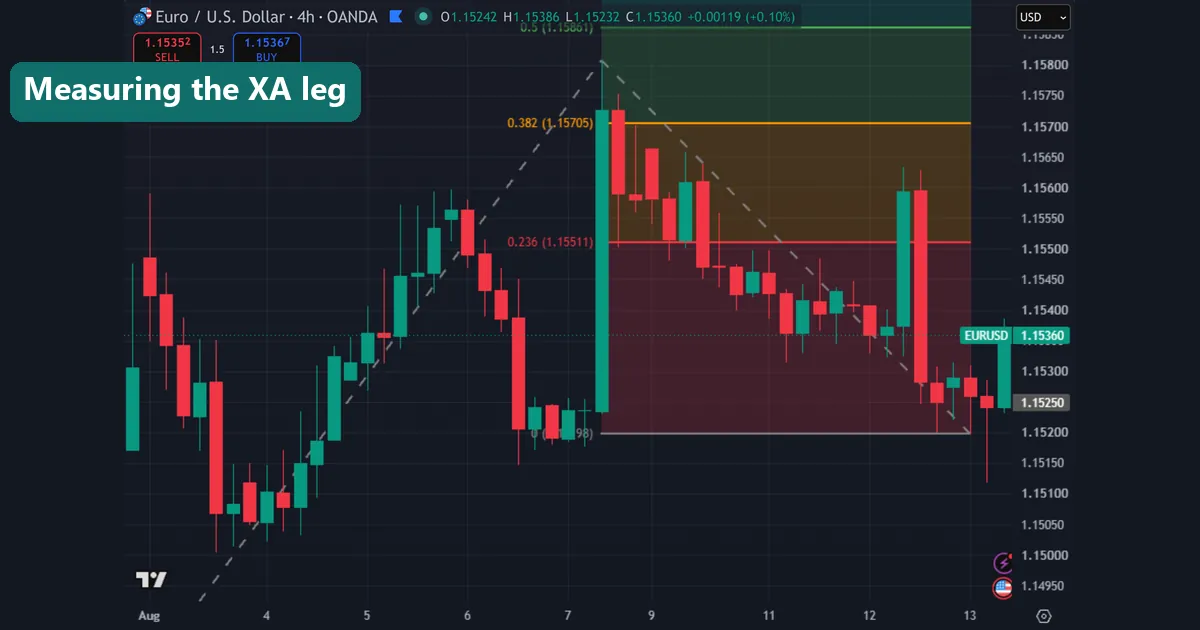
Every harmonic pattern uses the same skeleton. Price makes an initial leg, then three further legs, producing five turning points labelled X, A, B, C and D.
XA is the first impulse. Every other leg measures against it. AB retraces part of XA. BC moves back in the XA direction. CD is the final leg, and D is where the pattern completes and you take the trade.
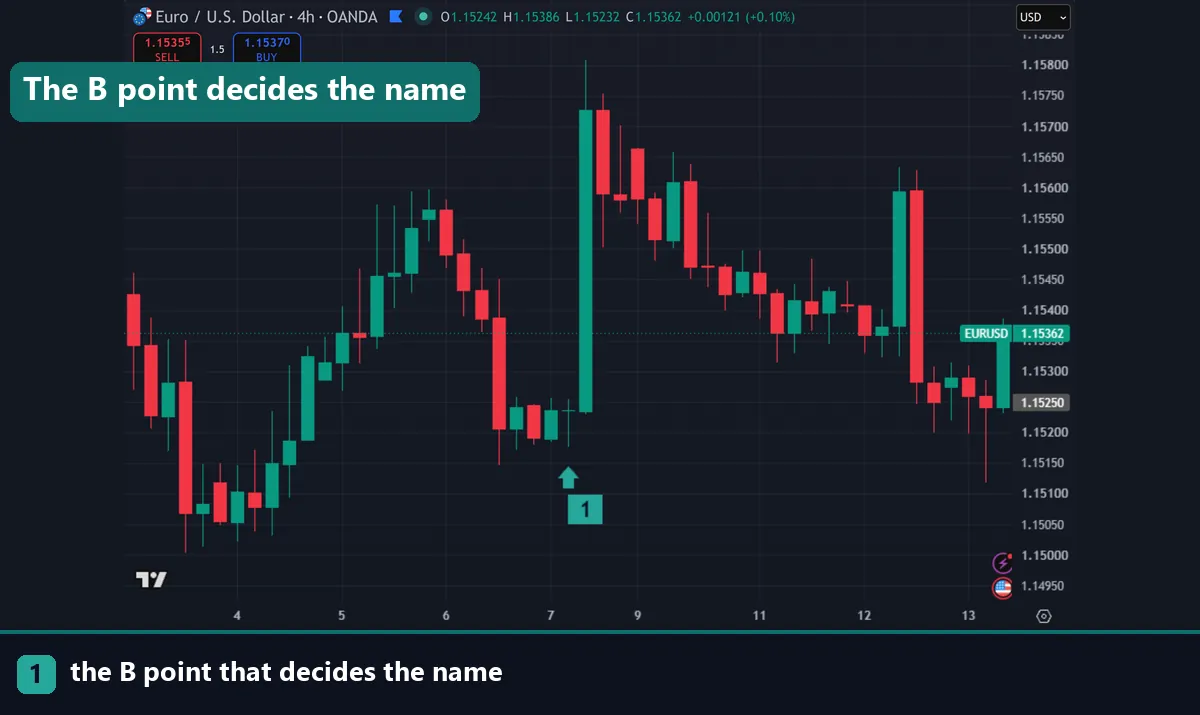
What distinguishes one pattern from another is a small number of ratios, above all the depth of the B point and the extension of CD. Get those two right and the pattern names itself.
The harmonic pattern cheat sheet ratio tables
These are the standard ratios as defined by Scott Carney, who formalised most of the modern set. Each ratio measures a retracement or extension of the leg named in that column.
| Pattern | AB (of XA) | BC (of AB) | CD (of BC) | D (of XA) |
|---|---|---|---|---|
| Gartley | 61.8% | 38.2% to 88.6% | 127.2% to 161.8% | 78.6% retracement |
| Bat | 38.2% to 50% | 38.2% to 88.6% | 161.8% to 261.8% | 88.6% retracement |
| Butterfly | 78.6% | 38.2% to 88.6% | 161.8% to 261.8% | 127.2% extension |
| Crab | 38.2% to 61.8% | 38.2% to 88.6% | 261.8% to 361.8% | 161.8% extension |
| Deep Crab | 88.6% | 38.2% to 88.6% | 261.8% to 361.8% | 161.8% extension |
| Shark | Not defined | 113% to 161.8% | 161.8% to 224% | 88.6% to 113% of XC |
| Cypher | 38.2% to 61.8% | 113% to 141.4% | Not defined | 78.6% of XC |
Two distinctions do most of the sorting. The B point separates Gartley from Bat: 61.8% versus 38.2% to 50%. The D point separates retracement patterns from extension patterns. Gartley and Bat complete inside the XA leg, while Butterfly and Crab complete beyond X.
Shark and Cypher break the pattern of the others by measuring D against the XC leg rather than XA, which is why they need a separate reading.
Bullish and bearish are mirrors
Every pattern exists in both directions and the ratios never change. In a bullish pattern, X sits at a high, A at a low, and D completes at a low where you buy. In a bearish pattern, every point flips, and D completes at a high where you sell.
The visual cue is the letter M or W. A bullish Gartley traces an M shape on a bearish pattern and a W on a bullish one. Beginners often mislabel direction from the shape alone, so read the point positions rather than the outline.
The potential reversal zone
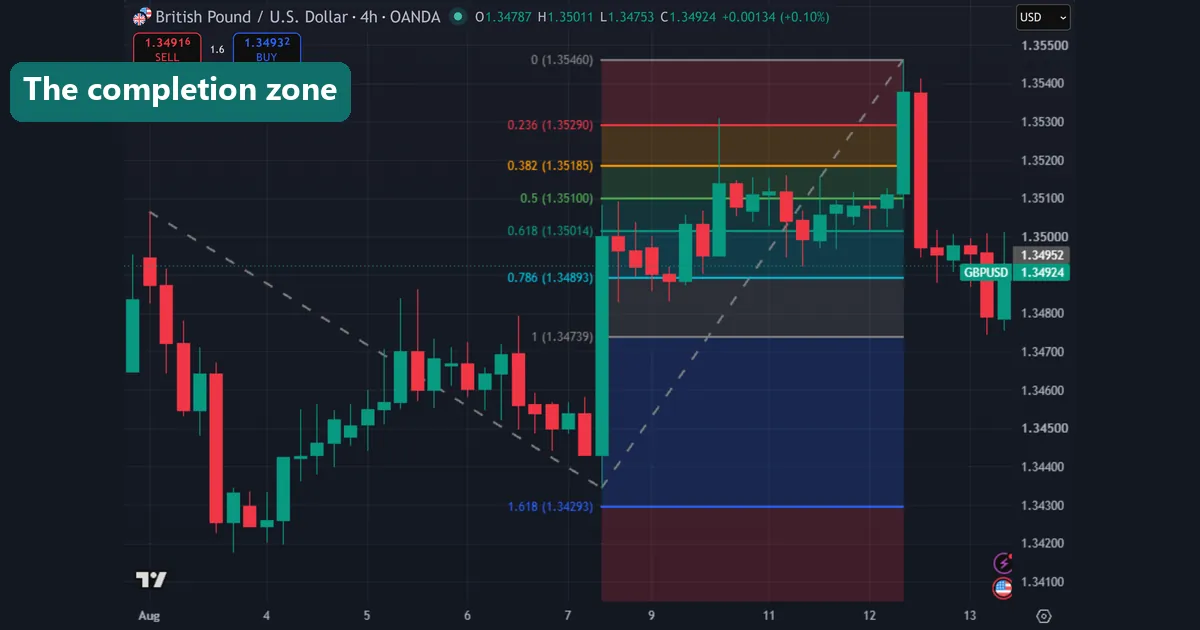
D is rarely a single price. Harmonic traders call the area around it the potential reversal zone. Several measurements converge to form it.
Three measurements typically define it: the XA retracement or extension for the pattern in question, the BC projection, and the AB=CD equality, where the CD leg matches the length of AB. When those three cluster within a tight band, the zone is worth trading. When they scatter across a wide area, the pattern is weak regardless of how good the outline looks.
Convergence is the real signal. A textbook shape whose measurements disagree is a worse trade than an untidy shape whose measurements stack up.
Entry, stop and targets
The mechanics are the same for every pattern in the table.
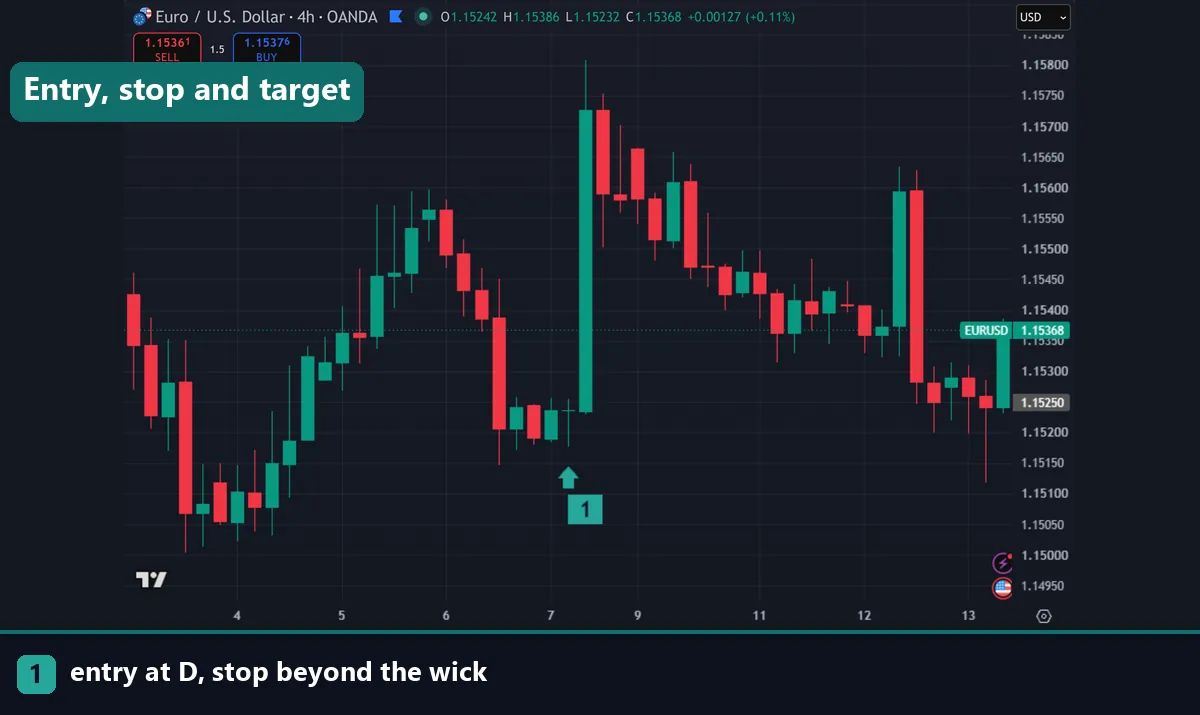
Entry goes at the zone, usually split across it rather than at one price, since D rarely prints exactly. Many traders wait for a reversal candle inside the zone rather than using a resting limit order.
The stop goes beyond the extreme the pattern must not exceed. For a Gartley that means beyond X, since a failed 78.6% retracement breaks the structure. For a Crab, where D already extends past X, the stop sits beyond the 161.8% projection.
Targets come from the CD leg. The first is a 38.2% retracement of CD, the second 61.8%. Traders holding for more use point C or point A as the extended objective. Our Fibonacci extension guide covers the drawing mechanics.
Download the complete indicator database
Put these concepts on your charts. One email unlocks the full library of 1,380+ indicators with compiled MT4 and MT5 files, plus my TradingView scripts. No paywall, no spam, unsubscribe any time.
Get free access to my indicator database
One email unlocks 1,380+ free MT4, MT5 and TradingView indicators — the complete library. No single-tool download; you get the whole database.
Validating a pattern before you trade it
Five checks catch most bad patterns, and running them takes under a minute.
First, confirm every leg is a genuine swing. Points must be clear turning points, not arbitrary spots chosen to make the ratios fit. Second, check every ratio against the table rather than eyeballing the shape. A pattern with one leg outside its window is not that pattern.
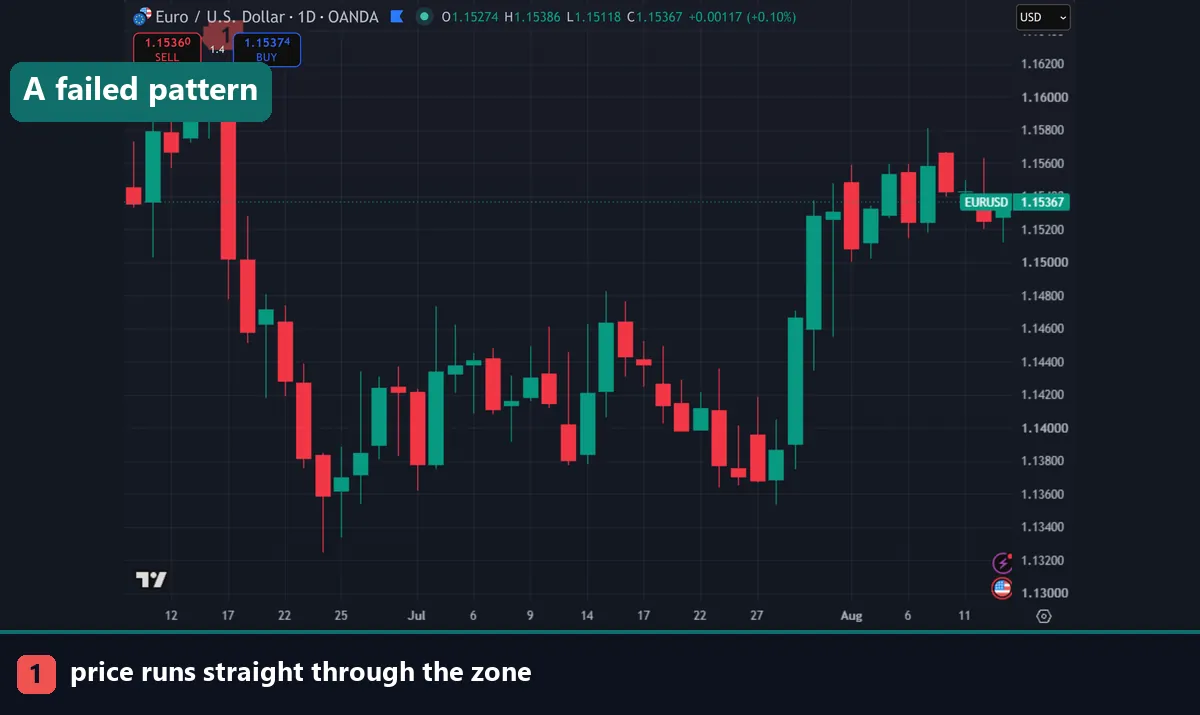
Third, look for convergence in the zone. Fourth, check the higher timeframe context: a bullish pattern completing into a strong downtrend faces the whole market. Fifth, confirm the pattern is complete before entering. Patterns fail while forming, and the CD leg can run far past the projected D.
That last point deserves emphasis. Automated scanners often flag patterns that are still developing, and a leg extending beyond its window invalidates the count. Our guidance on harmonic pattern trading covers the full workflow.
Common harmonic mistakes
Four repeat. Forcing points to make ratios fit tops the list, and it is why two traders label the same chart differently. Trading an incomplete pattern comes second, since CD frequently overshoots. Third, people ignore trend context and take a reversal signal against a strong move. Fourth, they use a stop just beyond D rather than beyond the structural invalidation, which gets them out of patterns that were still valid.
Harmonic patterns also fail regularly, as every method does. The ratios define where you are wrong, which is their genuine advantage over shapes without measurements.
Where to go next
Harmonics reward precise measurement. Read harmonic pattern trading for the full method, and how to draw a Fibonacci extension for the tool that measures every leg. For a related structural method, see our Elliott wave EURUSD analysis. The head and shoulders pattern guide covers shapes without ratios. For further reading, Investopedia explains the Gartley pattern at Investopedia, and the Fibonacci retracement article on Wikipedia covers the ratios themselves.
FAQ
What ratios define a Gartley pattern?
AB retraces 61.8% of XA, BC runs 38.2% to 88.6% of AB, CD extends 127.2% to 161.8% of BC, and D completes at a 78.6% retracement of XA. The 61.8% B point is what separates it from a Bat.
What is the difference between a Gartley and a Bat?
The B point and the completion. A Gartley has B at 61.8% of XA and completes at 78.6%. A Bat has B between 38.2% and 50% and completes deeper, at 88.6% of XA.
Which harmonic patterns extend beyond X?
Butterfly and Crab. A Butterfly completes at a 127.2% extension of XA and a Crab at 161.8%, so both finish outside the original leg rather than inside it.
What is the potential reversal zone?
The area where the XA measurement, the BC projection and the AB=CD equality converge. A tight cluster makes a tradeable zone; measurements scattered across a wide band mean a weak pattern.
Where does the stop go on a harmonic trade?
Beyond the level that invalidates the structure, not just beyond D. For a Gartley that is beyond X. For a Crab it sits past the 161.8% projection that defines the completion.
How reliable are harmonic patterns?
They fail regularly, like every pattern method, though the ratios give you an exact invalidation point. Treat them as one input. Trading involves risk, results are not guaranteed, and past performance is not indicative of future results.

About the author
Written by Dominic Walsh, a Forex trader and MT4/MT5 indicator, Expert Advisor and script developer. Every tool on forexmt4systems.com is tested on live charts before release and ships with ready-to-use compiled MT4 (.ex4) and MT5 (.ex5) files. Learn more about the trader and developer behind this site.
How we build, test and correct every tool: Editorial & Testing Policy. Trading carries risk; see the disclaimer.