
The head and shoulders pattern is a three-peak reversal formation that warns an uptrend may be ending. The first peak is the left shoulder. A taller peak forms the head. Then a lower third peak makes the right shoulder. Joining the two lows between them gives you the neckline, and the pattern only counts once a candle closes beyond that line. This guide covers the anatomy, the inverse version, the measured-move target and stop placement. It also explains why the volume rule from stock-market books fails in forex.
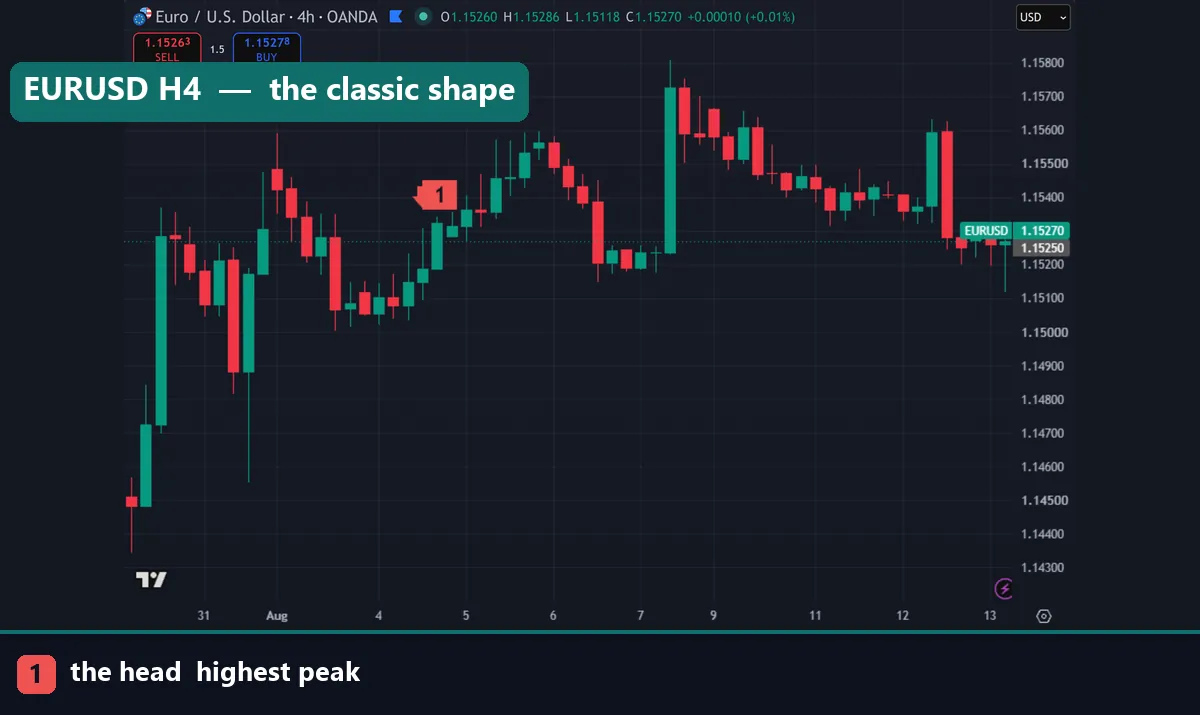
The anatomy of a head and shoulders pattern
Four parts make up the formation, and each one has a job.
The left shoulder appears first. Price rallies to a peak inside an existing uptrend, then pulls back. Nothing looks unusual yet, because uptrends pull back all the time. Next comes the head: buyers push to a new, higher peak, then sell off again. So far the trend is technically intact, since the market keeps making higher highs.
Then the right shoulder changes the story. Buyers try again, but this attempt stalls below the head, usually near the height of the left shoulder. That failure is the real signal. Demand could not reach the previous extreme, so the rhythm of higher highs has broken.
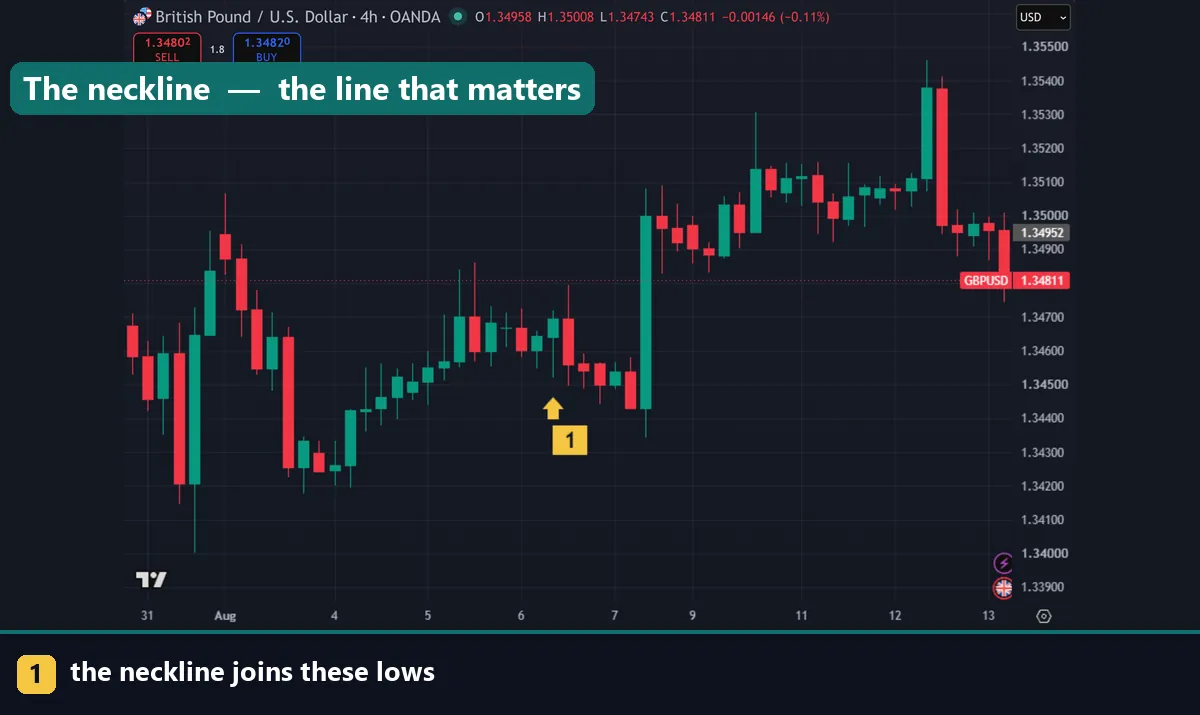
Joining the low after the left shoulder to the low after the head gives you the neckline. It can run flat or slope gently, and it acts as the trigger level. Until price breaks it, you have three bumps on a chart and nothing more.
The inverse head and shoulders
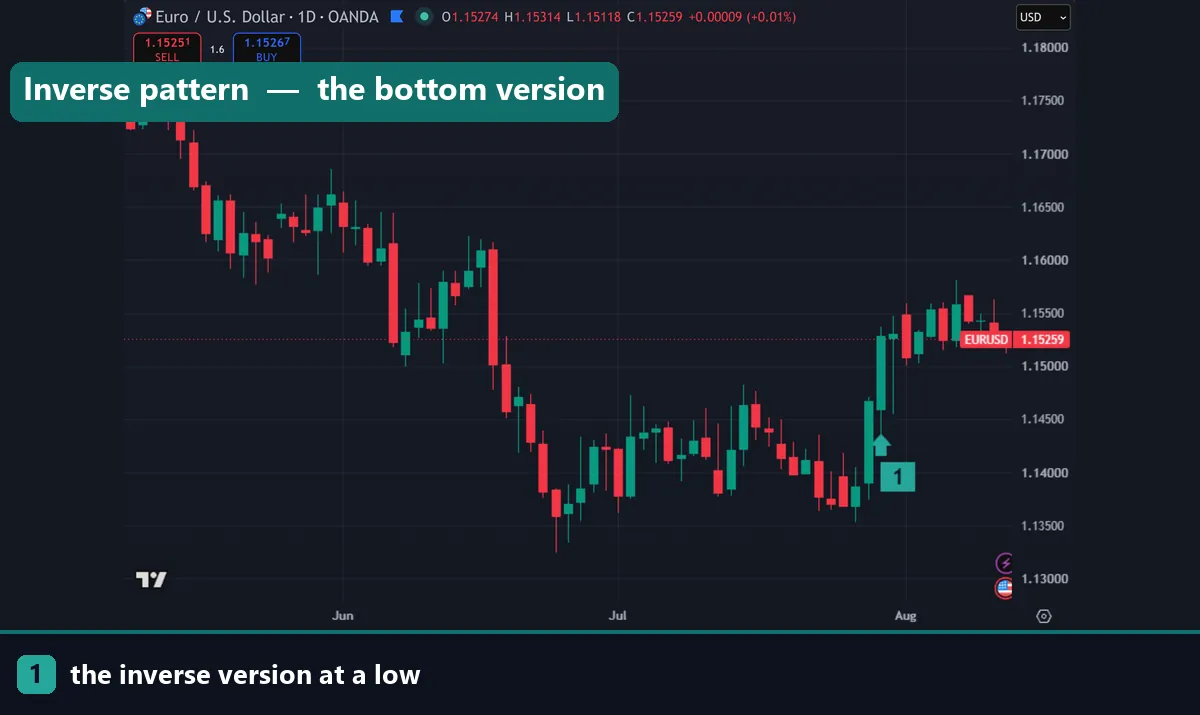
Flip everything upside down and you get the inverse head and shoulders, which forms at market bottoms. Price falls to a first trough, bounces, drops to a deeper trough, bounces again, then makes a shallower third trough. The neckline now joins the two intervening highs, and the trigger is a close above it rather than below.
The logic runs identically. Sellers failed to force a new low on the third attempt, so supply is drying up. Traders treat a confirmed neckline break as a bullish signal, and the target projects upward instead of down. Everything else here applies to both versions.
Confirmation comes from the close, not the wick
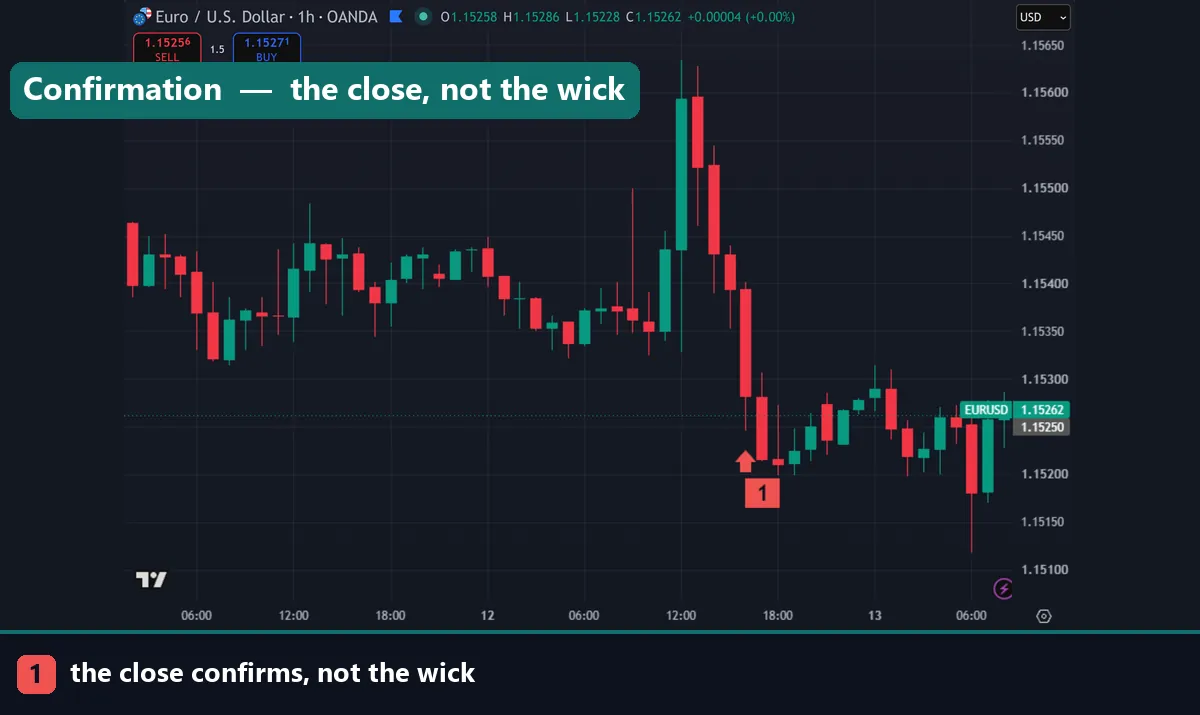
This is the single most important rule, and beginners break it constantly. A wick poking through the neckline confirms nothing. Intraday spikes pierce necklines all day long, especially around news releases. Price then snaps straight back inside.
Wait for a candle to close beyond the neckline on the timeframe where you drew the pattern. On a daily head and shoulders, that means a daily close. Dropping to the M15 to get in early changes the pattern you are trading, because a 15-minute close proves nothing about daily structure.
Many traders add a second filter: a retest. After the break, price often returns to the neckline from the other side and gets rejected. Entering there gives a tighter stop and a cleaner invalidation point. The trade-off is that some breaks never look back. Reading the rejection candle matters, so see our guide on how to read candlestick charts.
The measured move target
The pattern comes with a built-in objective. Measure vertically from the top of the head down to the neckline directly beneath it. That distance is the height. Then project the same distance down from the point where price broke the neckline.
Here is the arithmetic in practice. Suppose the head sits 200 pips above the neckline. Price then closes below the neckline, so you measure 200 pips further down from that break level. The result becomes your target. On an inverse pattern, measure from the bottom of the head up to the neckline and project the same distance upward.
Treat the number as a reference, not a promise. Plenty of moves stall halfway, and some run far past it. A sensible habit: bank part of the position at the halfway mark, then let the rest run toward the full projection.
Where the stop usually sits
Most traders place the stop above the right shoulder. On an inverse pattern it goes below the right shoulder instead. The reasoning is structural: a move back above that shoulder says buyers are not finished, so the reversal thesis is broken. A tighter alternative sits just beyond the neckline after a retest, though it gets hit more often.
Placing the stop above the head is the conservative choice. It survives more noise, but risk per trade grows and the reward-to-risk ratio shrinks. Position size has to come down to match. Volatility-based buffers help either way, and our walkthrough on using ATR as a stop loss sizes that cushion from live conditions.
Head and shoulders parts at a glance
| Part | What it is | What it means | What invalidates it |
|---|---|---|---|
| Left shoulder | First peak inside the existing uptrend, followed by a pullback | Nothing on its own; the trend is still healthy | Only a shoulder in hindsight |
| Head | A higher peak than the left shoulder, followed by a deeper pullback | Buyers still win, but the pullback runs further than the last | A rally that never returns to the neckline |
| Right shoulder | A third peak stalling below the head, near the left’s height | Demand has faded; higher highs have stopped | A close above the head — the pattern is dead |
| Neckline | Line joining the two lows between the peaks; flat or gently sloping | The trigger level for the whole formation | A steep line needing three attempts to draw |
| Neckline break | A candle closing beyond the neckline on that timeframe | Confirmation; only now does the pattern exist | A close back on the original side of the neckline |
| Measured move | Head-to-neckline height projected from the break point | An objective reference target | Nothing, though price often stops short |
Download the complete indicator database
Put these concepts on your charts. One email unlocks the full library of 1,380+ indicators with compiled MT4 and MT5 files, plus my TradingView scripts. No paywall, no spam, unsubscribe any time.
Get free access to my indicator database
One email unlocks 1,380+ free MT4, MT5 and TradingView indicators — the complete library. No single-tool download; you get the whole database.
Why the volume rule does not translate to forex
Textbooks say volume should shrink into the right shoulder and expand on the neckline break. That rule came from stock and futures markets, where every share and every contract passes through a central exchange. Reported volume there is genuine traded volume.
Spot forex works differently. No central exchange exists, so no broker can see total market volume. Your MT4 or MT5 chart shows tick volume: the number of price changes per candle, not the amount actually traded. Tick volume does track activity reasonably well, because busy periods produce more price changes. Still, it is only a proxy. Two brokers will report different tick volumes for the same candle, since each counts its own feed.
So apply the volume rule with care here. Use tick volume as a rough activity gauge. Do not reject a valid structure because the bars missed a textbook shape. For genuine traded volume on the majors, check the currency futures on the CME, which many traders reference alongside spot charts.
The honest limitation
Beginners over-identify this pattern more than any other. Three bumps appear on every chart, constantly. Genuine formations need a clear preceding trend, a head that stands out, and an obvious neckline. Without those, you are pattern-matching noise.
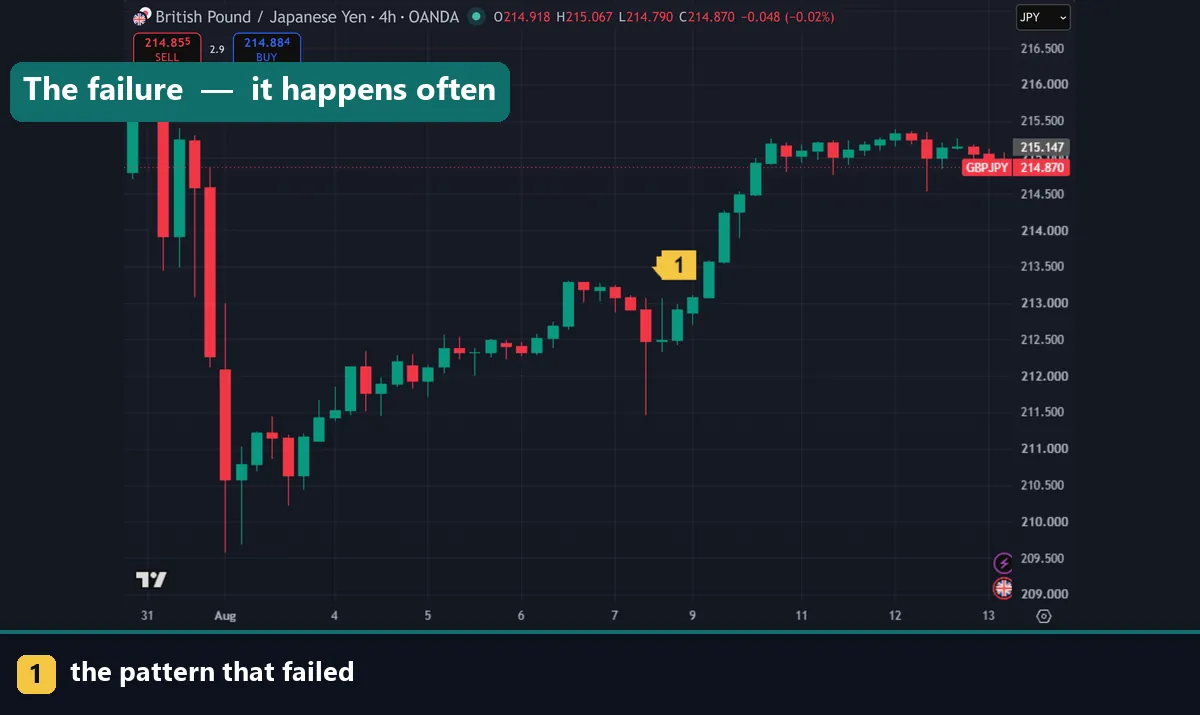
Failures are common too. Price breaks the neckline, travels a short distance, then reverses and runs back through the pattern. Nobody publishes a trustworthy success figure for forex. Quoted percentages usually come from equity studies with different rules. Treat the setup as a probability tilt, not a forecast.
The neckline itself is subjective. Wicks or closes? Flat or sloped? Two traders will draw two different lines, then take different entries and stops. Decide your convention in advance and apply it the same way every time.
Common head and shoulders mistakes
Three habits cause most losses. Entering before the close is the first. Traders see a wick through the neckline, jump in, then watch the candle close back inside. Forcing the pattern is the second: hunting for shoulders on a chart that never trended leaves no trend to reverse. Ignoring the higher timeframe rounds out the list. A tidy M15 formation inside a strong daily uptrend rarely delivers, because the dominant flow keeps buying every dip. Check the timeframe above before you commit.
Where to go next
Reversal patterns work better with context. Our liquidity sweep example explains why the head so often overshoots before the market turns. The smart money concepts guide covers the structural view of the same reversals. To plot patterns automatically, start with how to install MT4 and MT5 indicators. For further reading, Investopedia breaks down the head and shoulders pattern at Investopedia. Wikipedia documents the head and shoulders chart pattern on Wikipedia.
FAQ
What does a head and shoulders pattern mean?
It signals that an uptrend may be losing strength. Buyers made a new high at the head, then failed to match it at the right shoulder. A close below the neckline confirms the shift and gives traders their entry trigger.
What is an inverse head and shoulders?
It is the same shape upside down, forming at market bottoms. Three troughs appear, with the middle one deepest, and the neckline joins the two highs between them. A close above the neckline confirms a potential bullish reversal.
How reliable is the head and shoulders pattern in forex?
Reliability varies with timeframe and context. Daily and H4 patterns following a clear trend behave far better than intraday ones. Many formations still fail, so risk management matters more than the pattern itself.
Where do you put the stop loss on a head and shoulders?
Most traders place it just beyond the right shoulder. Above the head is safer but costs more risk. A stop past the neckline after a retest is tighter, and it gets hit more often. Match the choice to your position size.
Does volume matter for head and shoulders in forex?
Only as a rough guide. MT4 and MT5 report tick volume, meaning price changes rather than contracts traded. The classic stock-chart volume rules therefore do not apply directly. Use structure and the neckline close as your primary confirmation.
Is the head and shoulders pattern guaranteed to work?
No. Chart patterns describe behaviour that has occurred before; they do not predict the next move. Trading involves risk, results are not guaranteed, and past performance is not indicative of future results.

About the author
Written by Dominic Walsh, a Forex trader and MT4/MT5 indicator, Expert Advisor and script developer. Every tool on forexmt4systems.com is tested on live charts before release and ships with ready-to-use compiled MT4 (.ex4) and MT5 (.ex5) files. Learn more about the trader and developer behind this site.
How we build, test and correct every tool: Editorial & Testing Policy. Trading carries risk; see the disclaimer.