
A bull flag is a sharp rally followed by a short, orderly drift lower between two parallel lines, and the textbook says price should then break higher and travel about as far again. We tested that claim on 97 daily flags across 23 forex pairs and 90 hourly flags on four symbols. This guide settles how to define the pattern, which way the break went, and how often the target came true. The short answer: the break went up more often than not, but what came after it was no better than chance.
What a bull flag is
A bull flag has three parts. The pole comes first: a fast, steep climb. Next comes the flag, a few bars that drift down between two roughly parallel lines. Last comes the break, the first close outside those lines. Traders call it a continuation pattern, because they expect the uptrend to resume.
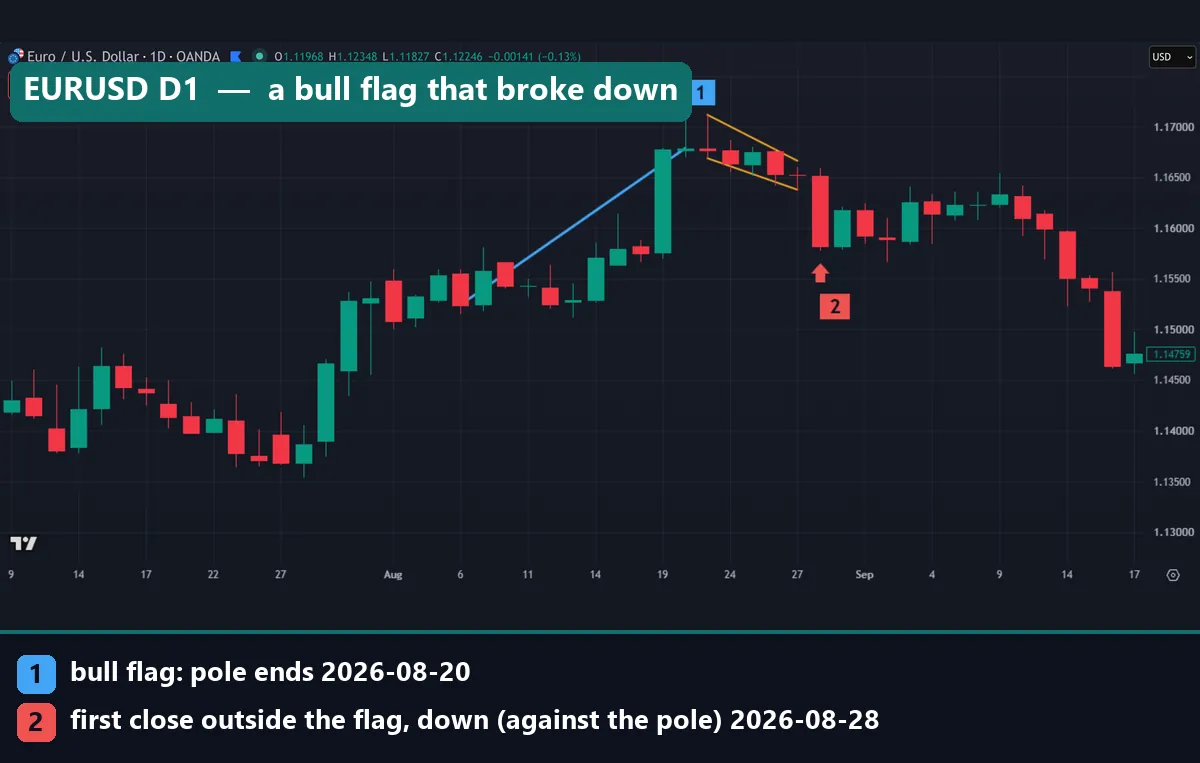
The chart above is a useful first example because it went wrong. On EURUSD daily, the blue pole runs from 6 August to 20 August 2026, marker 1. The yellow lines frame five bars of drift. Then, on 28 August, the first close outside the flag came at 1.15821, below the lower line, marker 2. So this flag broke against its pole, and by 17 September the pair sat at 1.14759.
Our flag pattern guide covers the shape in both directions. This article stays with the bullish case and adds measured numbers.
How the pattern works: pole, flag and break
The usual story goes like this. Buyers drive price up hard, and that run is the pole. Some of them then take profit while new buyers hold back, so price slips lower in a tight channel. When the selling dries up, buyers return and push through the upper line.
First, the pole needs a size. We measure it in ATR, the average true range over 14 bars, so one rule fits quiet and wild pairs alike. Our guide to what ATR means in trading explains it, and the iATR function in the MQL4 Reference shows how MetaTrader 4 computes it.
pole = close at the pole top - close at the pole start
target = break close + pole
Second, the target. Most sources add the pole length to the breakout price, the classic measured move target. We anchored it to the break close, because you can see that price the moment the bar ends.
Third, the edges. Lines drawn by eye invite bias, so we fitted one line through the flag’s highs and one through its lows with least-squares fitting on Wikipedia. Each line sits as close as it can to all of its points.
Bull flag vs bull pennant vs falling wedge
Three shapes look alike after a rally. The difference sits in the two edge lines.
- Bull flag: both edges slope down, against the pole, and run roughly parallel. Our rule kept the two slopes within a ratio of 0.5 to 2.
- Bull pennant: the edges converge, with falling highs and rising lows. Our bull pennant guide tests that shape with its own rules.
- Falling wedge: both edges fall but converge, the shape needs no pole, and it tends to last far longer. See our falling wedge pattern page.
So draw the two lines. If they stay about the same distance apart, you have a flag. If they squeeze together, you have a pennant or a wedge, and the pole tells you which. Our flag vs pennant comparison shows more cases.
How we tested bull flags
We wrote the detection rules before we looked at any result, then ran them over every bar. We did not hand-pick a single case.
The statistics come from MetaTrader 4, build 1471, using Capital Point Trading history. The daily test covers 23 forex pairs from 12 June 2018 to 24 August 2026:
- Dollar pairs: EURUSD, GBPUSD, USDJPY, USDCHF, USDCAD, AUDUSD
- Yen and franc crosses: AUDJPY, CADJPY, CHFJPY, GBPJPY, NZDJPY, AUDCHF, CADCHF, GBPCHF, NZDCHF
- Other crosses: AUDCAD, AUDNZD, EURAUD, EURGBP, GBPAUD, GBPCAD, GBPNZD, NZDCAD
The hourly test covers EURUSD, GBPUSD and USDJPY from 22 December 2025 to mid-August 2026, plus gold (XAUUSD) from 1 July 2025 to 20 August 2026.
The chart examples come from the TradingView web chart with OANDA data, captured on 19 October 2026. The lines are ours: blue for the pole, yellow for the least-squares edges, and a numbered marker at the first close outside the flag.
We placed no trades. Instead, we counted what price did after each break, so every figure is before spread, swap and commission. StockCharts ChartSchool’s flag and pennant article wants heavy volume on the pole, but our data has tick volume only, so we left that check out. The full method sits in our editorial testing policy.
Our bull flag detection rules
Here is the rule set in full. Change one line and you get a different sample, so read our numbers as results for these settings only.
| Parameter | Our setting | Why |
|---|---|---|
| Pole size | Close rises at least 3 ATR(14) | Only sharp rallies count |
| Pole speed | Within 10 bars | Keeps the pole steep |
| Pole top | Highest close of the run | Fixes where the flag starts |
| Flag length | 5 to 20 bars | Longer is a range |
| Flag depth | Within half the pole, at most 0.25 ATR above its top | A deep drop or a new high ends it |
| Edges | Least-squares lines through highs and lows, both falling | No hand-drawn bias |
| Parallel test | Slope ratio 0.5 to 2 | Rules out pennants |
| Break | First close outside either edge, within 15 bars | Closes count, wicks do not |
| Target | Pole length added to the break close, within 40 bars | The measured move |
| Failure | A close back through the far edge first | The setup is void |
| Follow-through | Close 10 bars after the break | Did the move continue? |
Every flag in our sample broke one way or the other within 15 bars. None simply faded out.
Reading a bull flag on a chart
Start with the pole, not the flag. If you cannot point to a fast climb, there is nothing to read. Next, lay one line across the highs of the drift and one across its lows. Then wait for a close outside either line.
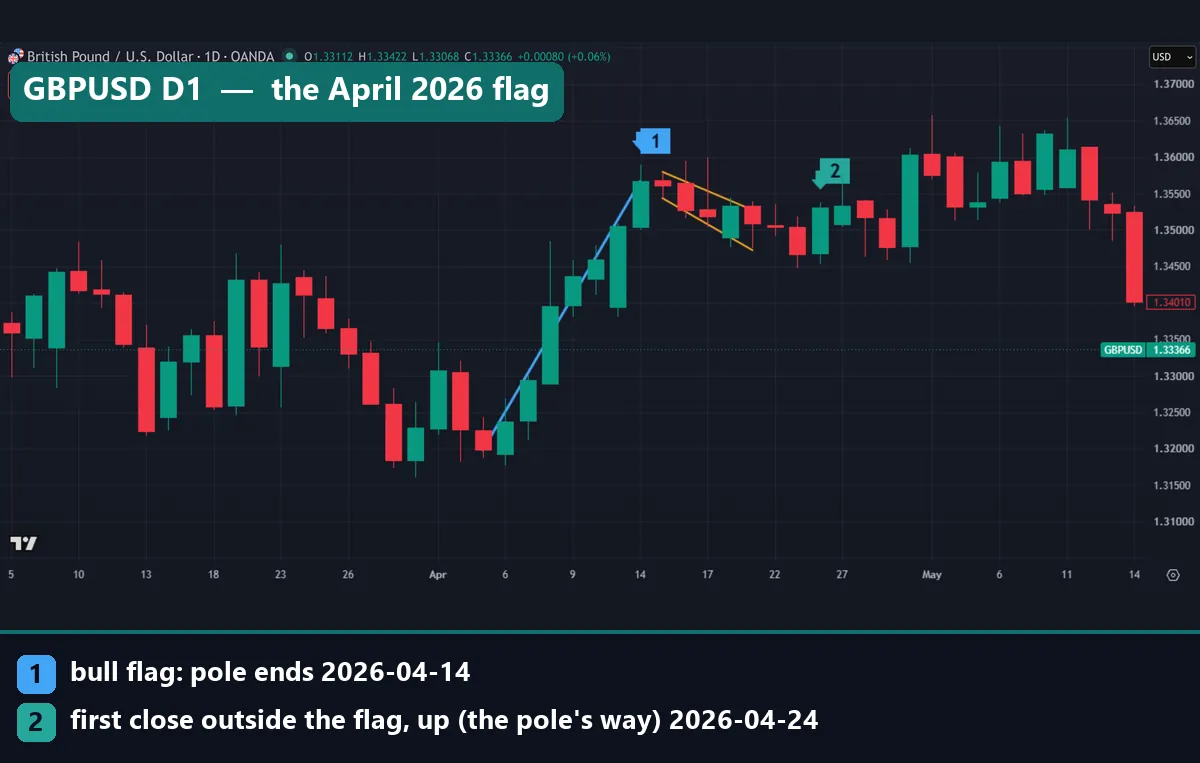
GBPUSD daily in April 2026 is a tidy case. The pole climbed from the 3 April close to the 14 April close, marker 1. Over the next five bars the pair slid lower between two falling lines. On 24 April a candle closed at 1.35308, above the upper line, marker 2. Look where that close sits: under the pole top. Because the upper edge slopes down, a flag can break out while price is still below the old high.
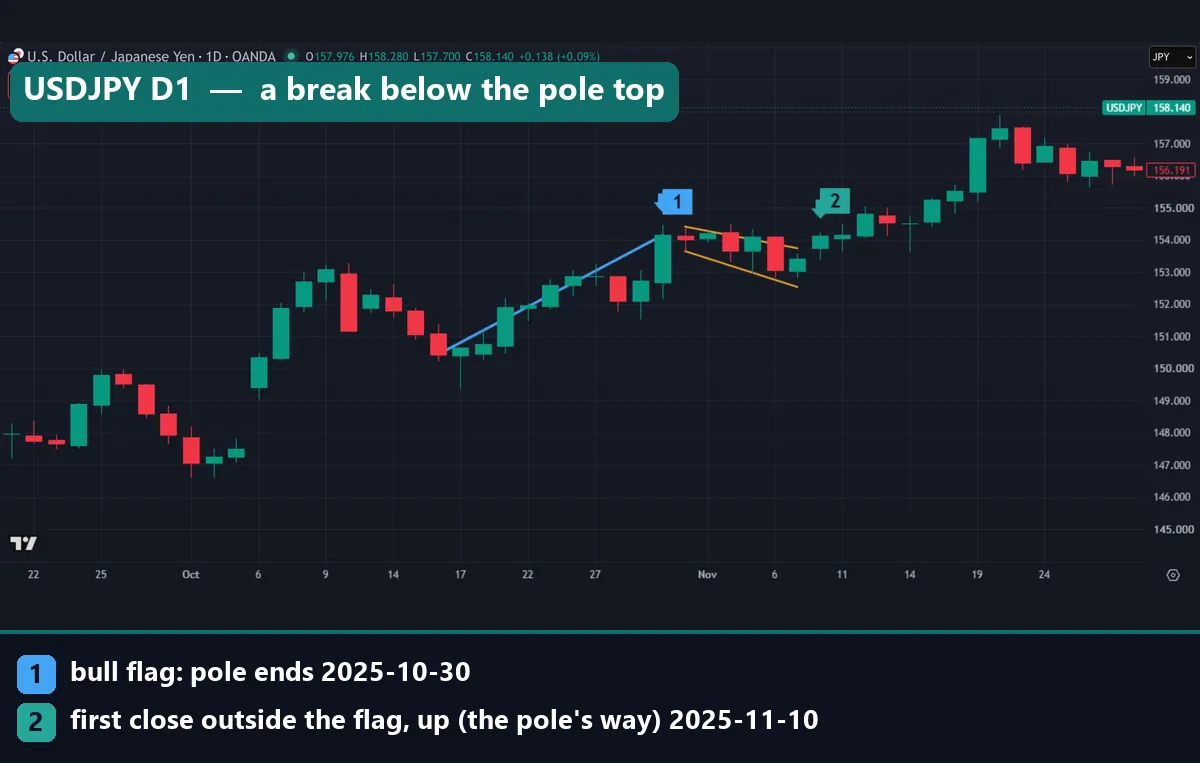
USDJPY daily from late 2025 shows the same detail. The pole ran from 150.436 on 16 October to 154.149 on 30 October. Six bars of drift followed, and the 10 November close at 154.132 broke out a hair under the pole top. This time the rally resumed. By 20 November the pair traded in the 157 area, near the 157.845 target, so this one roughly followed the textbook.
Worked example: the GBPUSD flag in numbers
Here is the April GBPUSD flag again, with the figures our script recorded.
- Pole: 1.35664 – 1.31984 = 0.03680, or 368 pips, from 3 to 14 April 2026.
- Flag: five bars, 15 to 21 April. The upper edge fell from 1.35796 to 1.35274, the lower edge from 1.35435 to 1.34723.
- Depth check: the lower edge bottomed 94 pips under the pole top, about a quarter of the pole.
- Break: the 24 April close of 1.35308 cleared the extended upper edge.
- Target: 1.35308 + 0.03680 = 1.38988.
- Failure line: the lower edge, extended to 24 April, sat near 1.3419, about 112 pips under the break close.
On paper, that is 368 pips of target against about 112 pips of risk, better than three to one. The chart tells a plainer story. Price did push higher into early May, but it stayed below 1.37000, and the last candle on our chart closed at 1.34010 on 14 May. Within those three weeks, the target never came into view.
That gap is the lesson of this guide. A neat ratio tells you nothing about how often the target arrives.
What 187 bull flags did after the break
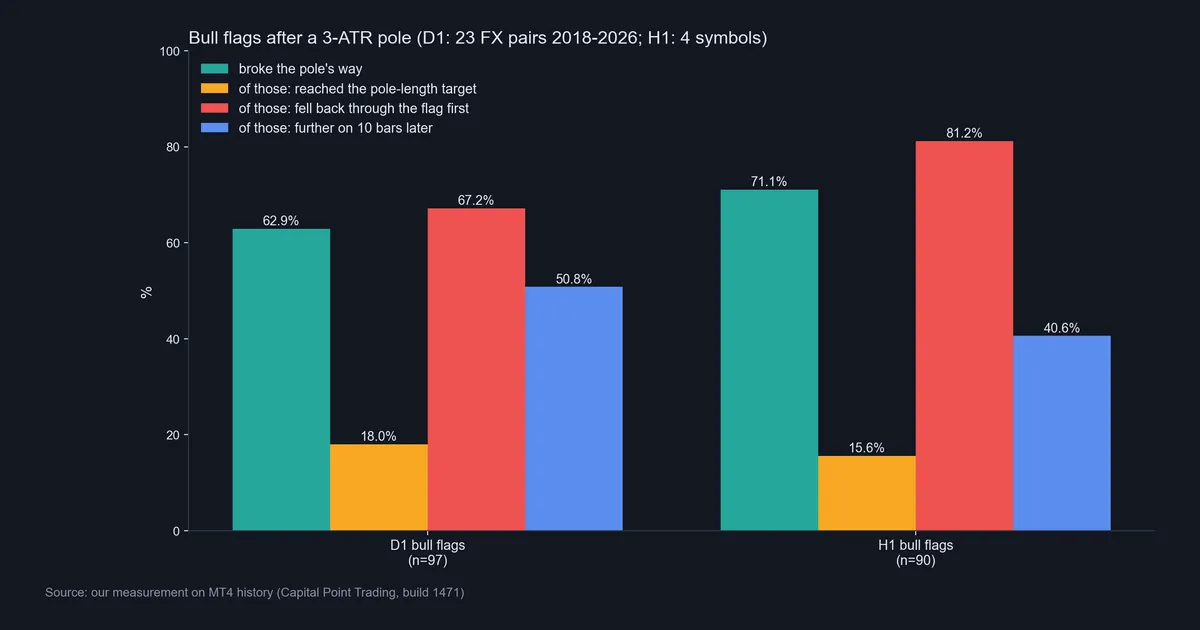
One chart proves nothing, so here is the full count. Out of 97 daily bull flags, 62.9% broke upward, the pole’s way. On the hourly test it was 71.1% of 90. That part holds up: after a flag that passed our rules, an upside break was more likely than a downside one.
The trouble starts after the break. Of the daily flags that broke up, only 18.0% reached the pole-length target within 40 bars. That is about 11 flags out of 61. On hourly charts it was 15.6%. Meanwhile, 67.2% of the daily upside breaks and 81.2% of the hourly ones closed back through the far edge of the flag first.
The ten-bar check is just as flat. Ten daily bars after an upside break, price stood further up in 50.8% of cases. Across the same 23 pairs, any ten-day window ended higher 52.3% of the time, so the flag added nothing. The median ten-bar move was +0.1 ATR. On hourly charts, only 40.6% stood higher after ten bars, and the median move was -0.37 ATR.
When an upside break turns: GBPJPY, July 2026
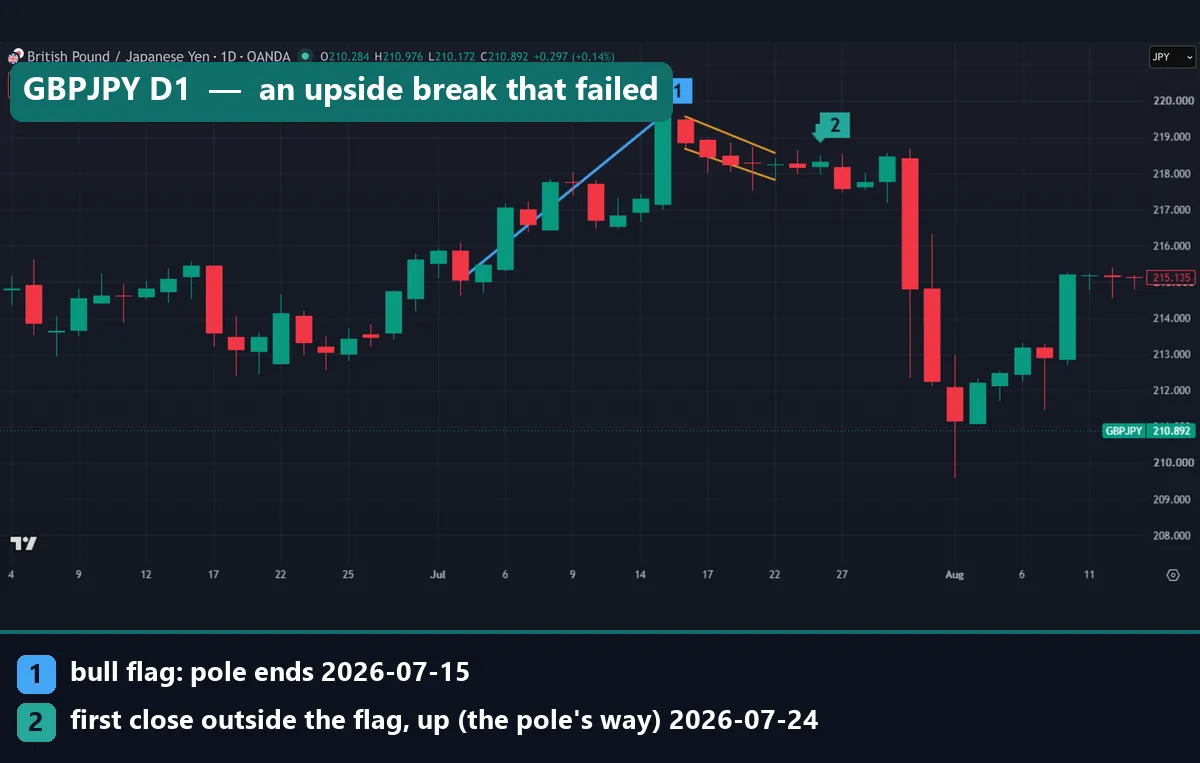
GBPJPY daily shows what that 67.2% looks like. The pole rose from 215.050 on 2 July to 219.593 on 15 July 2026, about 454 pips. After five bars of drift, a 24 July close at 218.322 cleared the falling upper edge, marker 2.
It did not last. Price idled near 218 for a few sessions, then two long red candles at the end of July took it back below the start of the pole. One wick in early August reached under 210.000. The 222.865 target sits above the top of this chart, and the last bar shown closed at 215.135.
Nothing in the flag warned of this. The pole was steep, the edges ran parallel, and the break came on a clean close. A flag that works and a flag that fails can look the same until after the break.
Download the complete indicator database
Put these concepts on your charts. One email unlocks the full library of 1,380+ indicators with compiled MT4 and MT5 files, plus my TradingView scripts. No paywall, no spam, unsubscribe any time.
Get free access to my indicator database
One email unlocks 1,380+ free MT4, MT5 and TradingView indicators — the complete library. No single-tool download; you get the whole database.
Where it fails
The target is the weak part. Fewer than one upside break in five reached the pole-length target: 18.0% on daily charts and 15.6% on hourly charts. A plan built on the measured move is a plan built on the rare outcome.
Breaks fail more often than they run. Most upside breaks closed back through the flag before they reached the target. On hourly charts that happened about four times in five, so a stop under the flag will get hit a lot.
Follow-through looks like chance. After ten daily bars, upside breaks stood higher 50.8% of the time, against a 52.3% base rate. The pattern hinted at the direction of the first close. It did not tell us where price would be two weeks later.
The samples are small. A count of 97 daily and 90 hourly flags can show a large edge, but not a small one. Also, three of the four hourly symbols cover only about eight months. Our note on backtest sample size explains why that matters.
The rule decides the result. A looser pole test or a longer flag would find other cases and other numbers. No official definition exists, so treat any flag statistic, ours included, as a product of its rules. Our look at why chart patterns fail covers the same issue.
Two more cases: USDCHF daily and EURUSD hourly
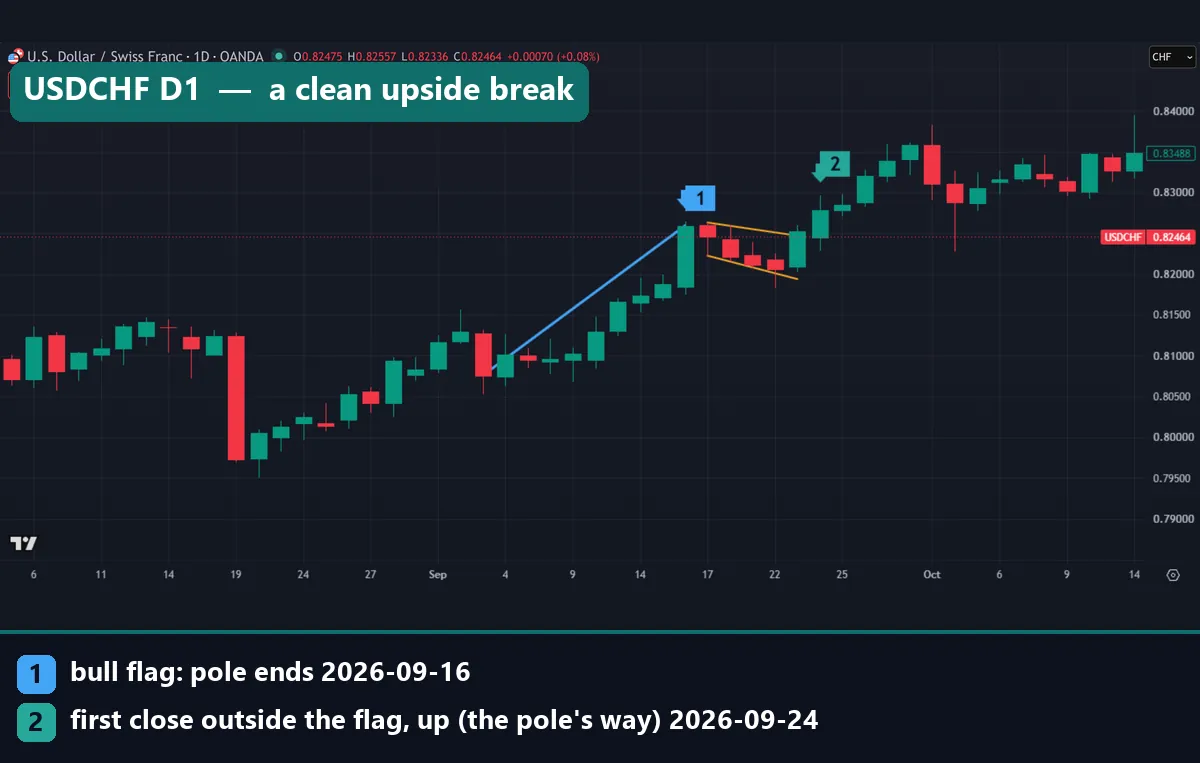
USDCHF daily is the cleanest flag in our examples. The pole ran from 0.80759 on 3 September to 0.82594 on 16 September 2026. After five bars of drift, the 24 September close of 0.82786 broke the upper edge and cleared the pole top. The pair kept climbing and closed the window at 0.83488. Even so, the 0.84621 target stayed out of reach in the three weeks shown.
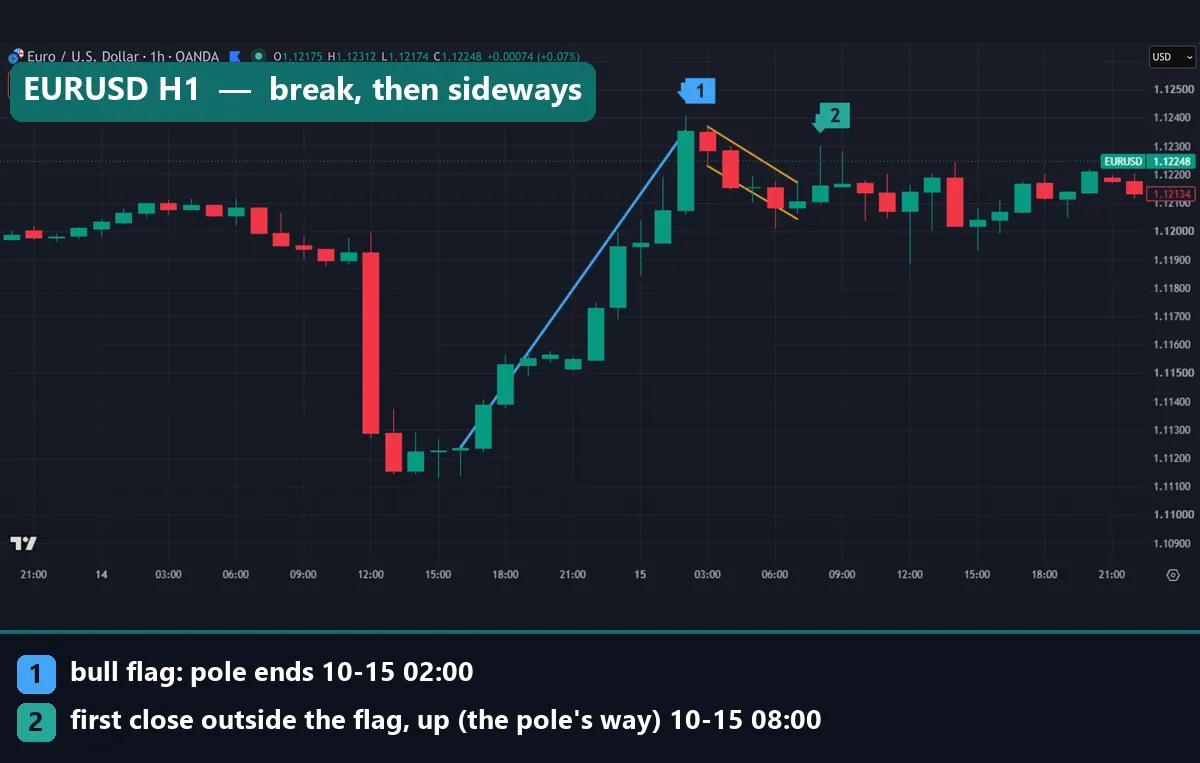
EURUSD hourly shows the short-term version. The pole climbed about 112 pips, from 1.11236 at 16:00 UTC on 14 October 2026 to 1.12352 at 02:00 UTC the next day. After five bars of drift, the 08:00 UTC close at 1.12160 broke the upper edge. Then price went sideways, mostly between 1.12000 and 1.12250, far from the 1.13276 target. In short, it matched the hourly numbers.
Four common bull flag mistakes
- Calling every pullback a flag. Without a size test for the pole, any dip turns into a flag. Set a rule, such as 3 ATR within 10 bars, and skip anything smaller.
- Reading the edge break as a new high. In four of our five upside examples, the break close sat below the pole top. Some traders wait for a close above the pole top instead. We did not test that filter.
- Banking on the measured move. The target came in for 18.0% of daily upside breaks. Plan exits that do not depend on it.
- Sizing without the far edge. Most breaks came back through the flag. Measure the distance to the far edge first, then size the trade so a hit costs a fixed slice of the account. Our guide to risk per trade shows how.
Where to go next
To draw the edges by hand, see how to use trend lines. For entries after a break, our break and retest strategy pairs well with this guide. The volatility contraction pattern covers a longer cousin of the flag, where pullbacks shrink in steps.
For outside reading, Thomas Bulkowski’s flag notes on ThePatternSite describe his own catalog, which also uses linear regression to judge a flag’s tilt. His sample comes from stocks, not currency pairs, so his figures and ours answer different questions.
FAQ: bull flag questions
Is a bull flag bullish?
By intent, yes, since the pole points up. In our test, 62.9% of daily and 71.1% of hourly bull flags broke upward. But what came after the break was close to chance.
How long should a bull flag last?
Our rule allowed 5 to 20 bars, and every example here used five or six. Much longer pauses start to look like ranges or wedges.
How do you measure a bull flag target?
Subtract the pole’s starting close from its top close, then add that length to the break close. On the April GBPUSD flag, 368 pips added to 1.35308 gave 1.38988.
What is the difference between a bull flag and a bull pennant?
The edges. A flag’s edges slope down against the pole and stay roughly parallel, while a pennant’s edges converge.
Does a bull flag work on the hourly chart?
It broke upward in 71.1% of 90 hourly flags. However, 81.2% of those upside breaks fell back through the flag first, and only 40.6% stood higher after ten bars.
Is a bull flag more reliable than a bear flag?
Not in our data. Daily bear flags broke the pole’s way 64.6% of the time, against 62.9% for bull flags. Both rarely hit their targets: 22.6% of daily bear breaks did, and 18.0% of bull breaks.
Should I use volume to confirm a bull flag?
The classic rule wants heavy volume on the pole and light volume in the flag. Spot forex has no central volume feed, and MT4 shows tick volume only, so we could not test it.
Can a bull flag tell me where price will go?
In our sample it hinted at the direction of the first close, but not at the size of the move. Treat it as one input with a defined exit and a fixed risk, and remember that results are not guaranteed; past performance is not indicative of future results.
Last updated: 19 October 2026.

About the author
Written by Dominic Walsh, a Forex trader and MT4/MT5 indicator, Expert Advisor and script developer. Every tool on forexmt4systems.com is tested on live charts before release and ships with ready-to-use compiled MT4 (.ex4) and MT5 (.ex5) files. Learn more about the trader and developer behind this site.
How we build, test and correct every tool: Editorial & Testing Policy. Trading carries risk; see the disclaimer.