
The volatility contraction pattern is a pause inside an uptrend where each pullback is shallower than the one before, until price closes above the top of the base. Mark Minervini made it popular with stock traders. This guide settles three things. First, how to turn the shape into a rule a computer can check. Next, what that rule found on 23 daily currency pairs. Finally, why the small edge we measured is still unproven.
What the volatility contraction pattern is
A market in a strong uptrend stops and builds a base. Inside it, sellers push price down a few times, but each push is weaker than the last. Those shrinking swings are the contractions, and the top of the base is the pivot. In Minervini’s reading, the shrinking dips show sellers running out. He also wants volume to dry up in the last, tightest dip.
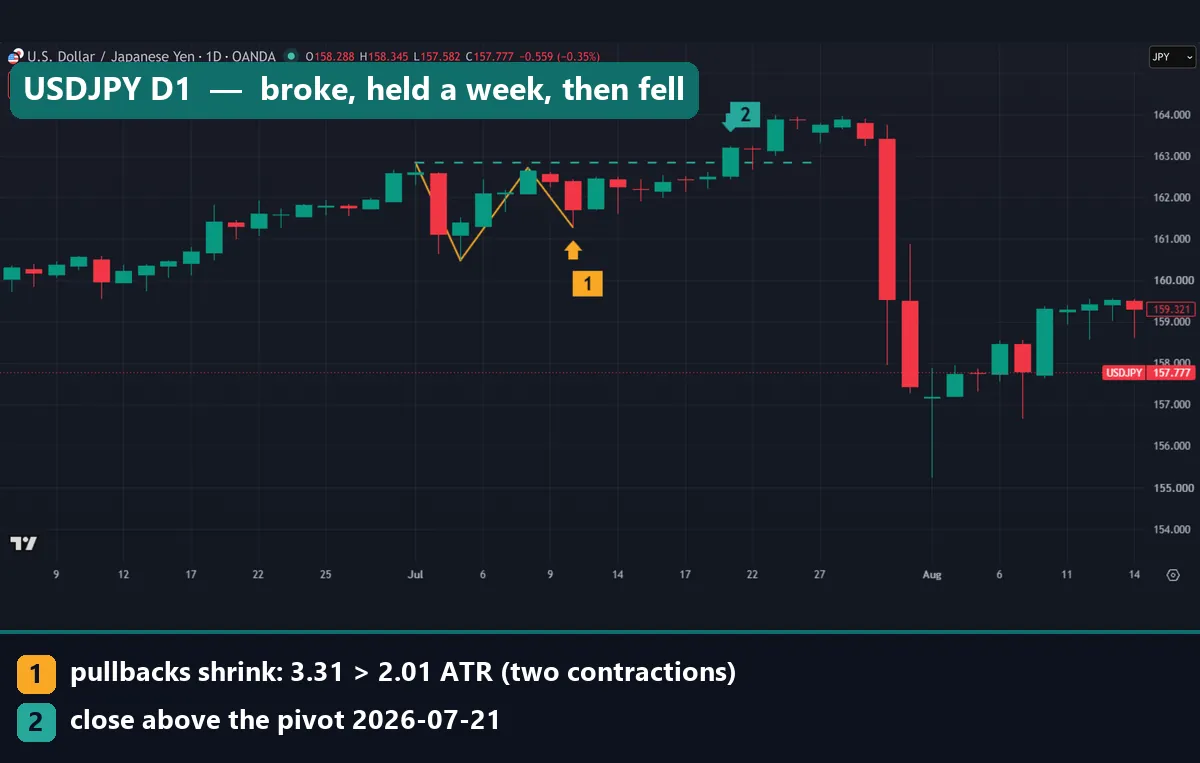
The USDJPY daily chart above shows the shape. In early July 2026, the pair dipped twice: first 3.31 ATR, then only 2.01 ATR. On 21 July, price closed above the 162.84 pivot and held there for about a week. Then, at the end of July, two large red candles took it from above 163 to below 158.
The pattern is a close cousin of the cup and handle. However, a cup and handle has one big dip and one small one, while a VCP can have two, three or more. Also, the idea comes from stocks, and we tested it on forex, a market with no earnings and no central exchange.
How the contractions work, with the formula
To test the idea, we needed numbers. First, we marked swing points. A swing high is a bar whose high is the highest of the three bars on either side, and a swing low is the mirror. Our guide to peaks and troughs covers this skill.
Next, we measured each pullback in ATR, the average true range over 14 bars, so a dip on USDJPY compares fairly with one on USDCHF. TradingView’s help page on Average True Range gives the calculation, and our ATR guide explains it.
depth(k)  = (swing high k - swing low k) / ATR(14)
contracts = depth(k+1) < 0.8 x depth(k), for every k
pivot     = highest swing high in the base
breakout  = first close above the pivot
So each pullback must be under 80% of the one before. We also asked for rising lows, and for every high to sit within 1 ATR of the first.
The logic is a squeeze: the swings shrink, the range narrows, and a move out of it may follow. Other tools measure that narrowing too. For example, Bollinger Band Width tracks the gap between the bands, and the momentum squeeze indicator flags bands inside a Keltner channel.
How we tested the VCP on forex
We ran fixed rules over MetaTrader 4 history from Capital Point Trading, MetaTrader 4, build 1471. The main test used 23 currency pairs on the daily chart, from 12 June 2018 to 24 August 2026. We also ran the strict rule on hourly EURUSD, GBPUSD and USDJPY from 22 December 2025 to August 2026, and on hourly gold from 1 July 2025.
Each base had to start in an uptrend, with the close above the 50-day simple moving average and the 50-day above the 200-day. Then we asked two questions. Did price close above the pivot within 20 bars? And if it did, was price higher 10 bars after the break? As a base rate, we used every fifth uptrend day in the same data.
We placed no trades, so every figure is the outcome of a rule, before spread, swap and commission. Volume means tick volume, a count of price changes.
The chart examples come from the TradingView web chart with OANDA data, captured on 15 October 2026. Their trend test is lighter, a close above a rising 50-bar average, because the short chart history could not hold a 200-bar average. Our method follows the editorial testing policy.
Detection settings we used
Every value below changes which bases count. We tried three variants.
| Setting | Strict | Two contractions | Loose |
|---|---|---|---|
| Pullbacks | 3 | 2 | 3 |
| Each pullback | Under 80% of the last | Under 80% of the last | Smaller than the last |
| Highs | Within 1 ATR of the first | Within 1 ATR of the first | Within 1.5 ATR of the first |
| Lows | Rising | ||
| Swing points | 3 bars on either side, all within 80 bars | ||
| Trend filter | Close above SMA 50, SMA 50 above SMA 200 | ||
| Pivot | Highest swing high in the base | ||
| Breakout | A close above the pivot within 20 bars | ||
| Failure | A close below the last low before price reaches pivot + 2 ATR | ||
The failure line matters most for risk. It treats the base as dead if price falls back under its last low before it gets two ATRs clear of the pivot.
Reading a volatility contraction pattern on a chart
On our charts, the yellow zigzag joins the swing points of the base and the green dashed line marks the pivot. Marker 1 gives each pullback depth in ATR and the rule that found the example. Marker 2 sits on the first close above the pivot.
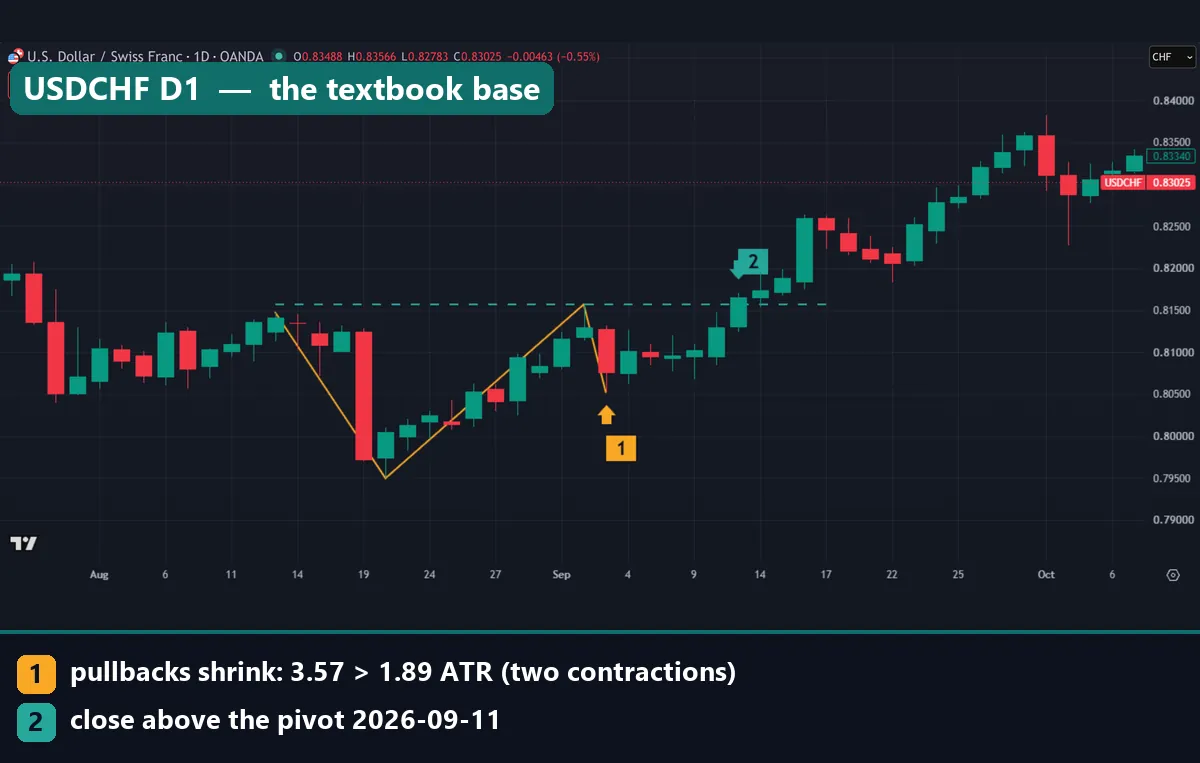
This USDCHF daily chart is the textbook case. Its first pullback ran from 13 to 20 August 2026 and measured 3.57 ATR. A second, from 2 to 3 September, measured 1.89 ATR, about half the first, and its low sat well above the August low. Price drifted under the pivot for about a week, closed above it on 11 September, and traded above 0.835 by early October.
An hourly base that broke, then failed
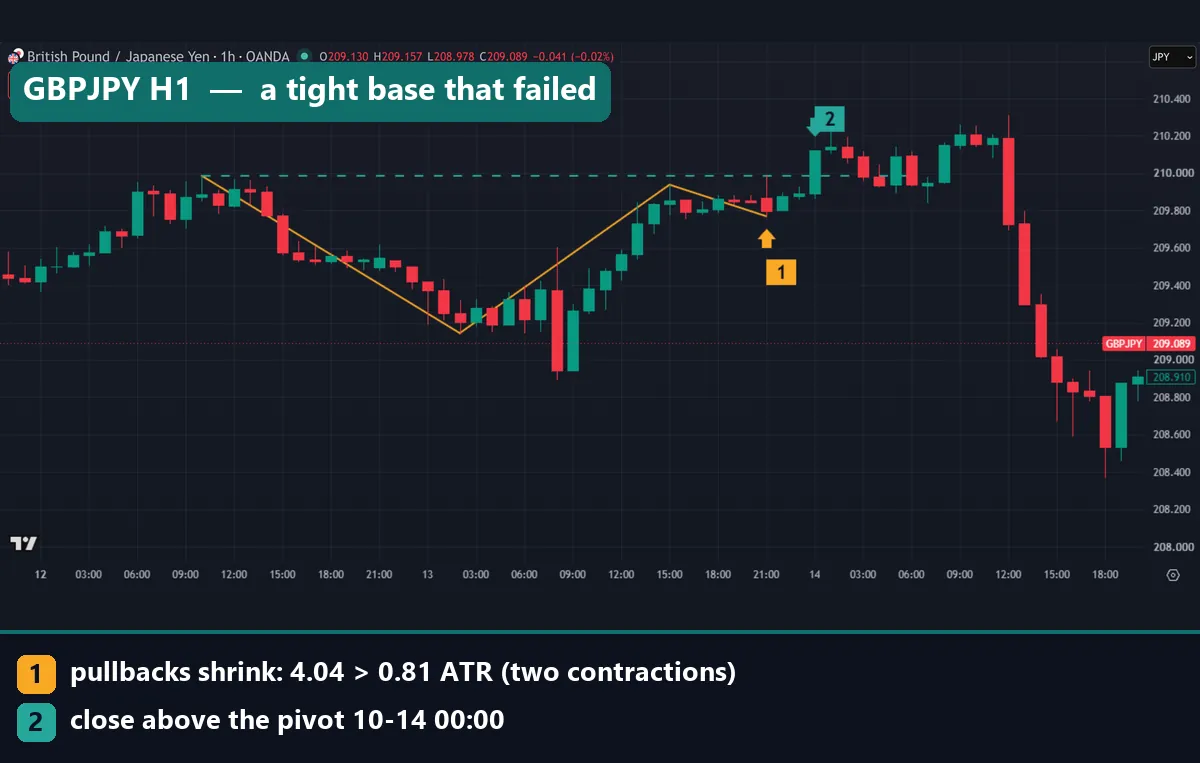
The GBPJPY hourly chart shows how fast a short-term base can turn. The first pullback, from 10:00 UTC on 12 October to 02:00 UTC on 13 October 2026, measured 4.04 ATR. The second, from 15:00 to 21:00 UTC on 13 October, measured just 0.81 ATR.
At midnight UTC on 14 October, price closed at 210.124, above the 209.986 pivot. Then it stalled. From 12:00 UTC that day, large red candles took it through the last low and down toward 208.4. Our guide on why chart patterns fail covers this kind of reversal.
Worked example: USDCHF daily, August to September 2026
The numbers behind the USDCHF chart, from TradingView OANDA data:
- First swing high: 0.81471 on 13 August 2026
- First swing low: 0.79498 on 20 August
- Second swing high and pivot: 0.81568 on 2 September
- Second swing low: 0.80523 on 3 September
- First close above the pivot: 0.81656 on 11 September
First, measure the pullbacks. The first is 0.81471 minus 0.79498, or 197.3 pips. The second is 0.81568 minus 0.80523, or 104.5 pips. In ATR terms they were 3.57 and 1.89, so the second is under 80% of the first.
Next, the second high sits 9.7 pips above the first, well inside 1 ATR, and the lows rise. So the shape passes.
Then plan the risk. The failure line is the last low, 0.80523, which sits 113.3 pips below the break close. Size any trade from that distance. Our guide on using ATR as a stop loss shows another way to set it.
Finally, check the outcome. The break close sat only 8.8 pips above the pivot. Yet price never came back to the last low on our chart and climbed above 0.835 instead. This one worked, but one good chart is not evidence.
What 134 daily bases did next
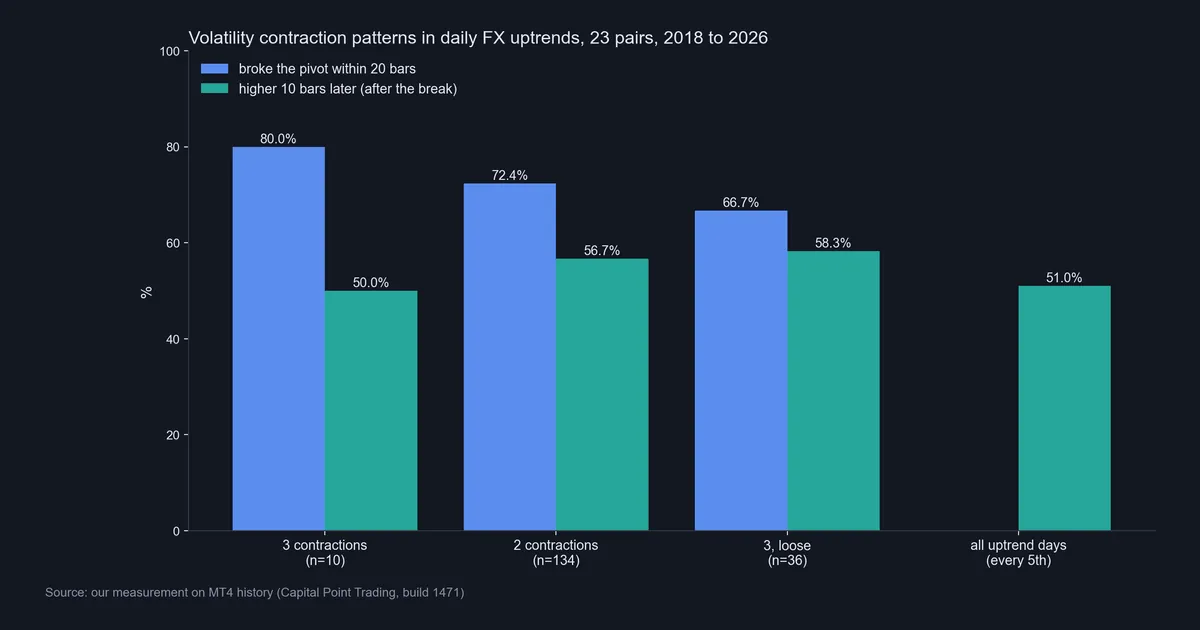
Now the full sample. The strict rule found only 10 daily bases across 23 pairs in eight years, which is too few to judge. Of those, 80.0% broke the pivot, and half of the breaks were higher 10 days later.
So we loosened the rule. With two contractions, the count rose to 134, and 72.4% closed above the pivot within 20 bars. After the break, 56.7% were higher 10 days later, with a median move of 0.39 ATR. By comparison, uptrend days in general were higher 51.0% of the time, with a median move of 0.04 ATR.
The loose rule found 36 bases. Of those, 66.7% broke, and 58.3% of the breaks were higher 10 days later. That is the top figure, but it rests on a small sample.
Why 56.7% is not proof
First, the sample is small. With fewer breaks than bases, a handful of cases moves the percentage by several points. Our guide on backtest sample size explains why.
Second, we tried three variants on the same data, and picking the best of several flatters it. Statisticians call this the multiple comparisons problem, described on Wikipedia. Our guide on curve fitting in trading covers the same trap.
Third, nobody has run this rule on fresh data yet, so the gap is in-sample only. A walk-forward analysis would come next. Also, a 0.39 ATR median move is small before transaction costs. So treat 56.7% against 51.0% as a lead to check, not a result to trade.
A loose base on the USDJPY hourly chart
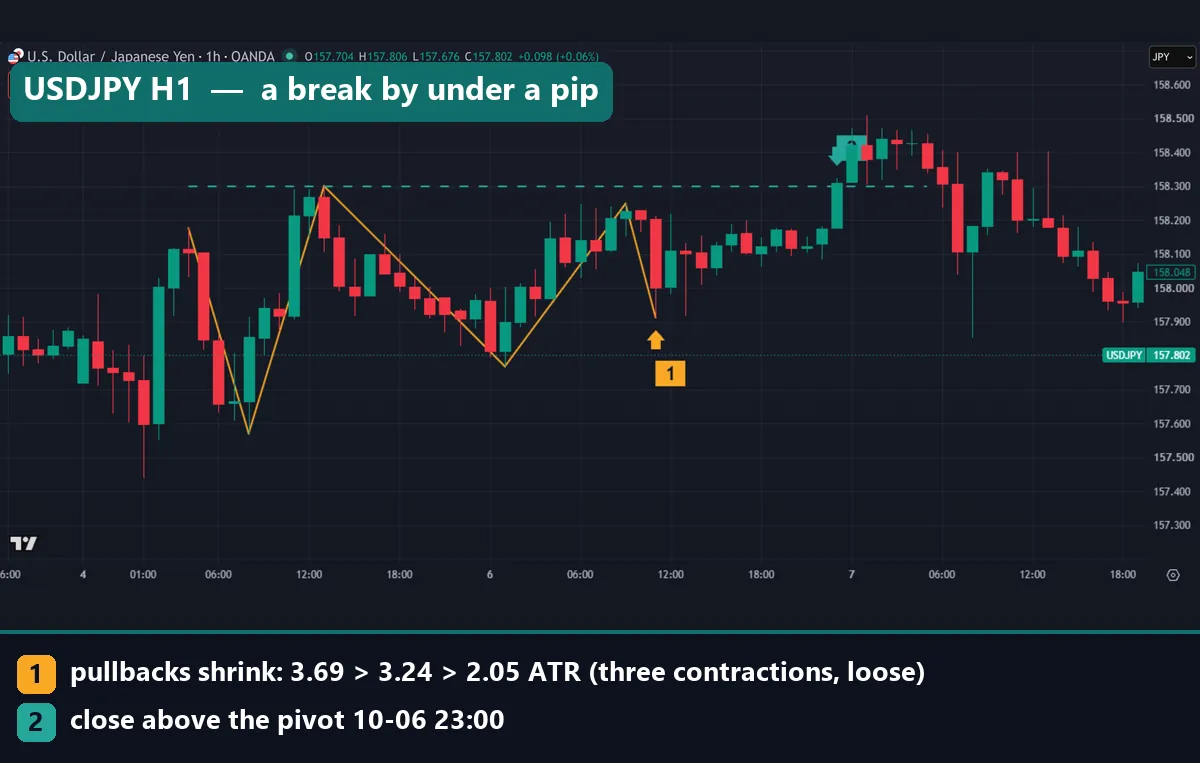
This USDJPY hourly chart uses the loose rule. Its pullbacks measured 3.69, 3.24 and 2.05 ATR. Because the second is only slightly smaller than the first, it fails our strict 80% test.
The base ran from 04:00 UTC on 5 October to 11:00 UTC on 6 October 2026, under a 158.3 pivot. At 23:00 UTC on 6 October, price closed at 158.309, less than one pip above it. Price then pushed toward 158.5. But by the morning of 7 October it was back under the pivot, and by evening it traded below 158.0.
Download the complete indicator database
Put these concepts on your charts. One email unlocks the full library of 1,380+ indicators with compiled MT4 and MT5 files, plus my TradingView scripts. No paywall, no spam, unsubscribe any time.
Get free access to my indicator database
One email unlocks 1,380+ free MT4, MT5 and TradingView indicators — the complete library. No single-tool download; you get the whole database.
Where it fails: limits of the VCP in forex
First, it is rare. The strict version found 10 daily cases across 23 pairs and 3 on our hourly data.
Second, volume does not help. Minervini wants volume to dry up in the last dip. But spot FX trades over the counter between many dealers, as the BIS Triennial Survey of FX turnover shows, so there is no single volume tape. In our two-contraction sample, tick volume in the last dip was a median 0.93 times the first. That is a very weak dry-up. For the strict rule it was 0.83 times, and for the loose rule 0.91 times.
Third, breaks fail. Of the two-contraction bases that broke, 17.5% closed back below the last low before getting two ATRs clear of the pivot. That figure was 25.0% for the strict rule and 20.8% for the loose one.
Fourth, hindsight helps the eye. In real time, you cannot tell whether a dip is the last one or the start of a deeper fall. Also, each swing point needs three more bars to confirm, so the base shows up late.
Finally, the pattern grew out of stocks. We did not test stocks, and a forex result does not carry over.
A loose base and a base that never broke
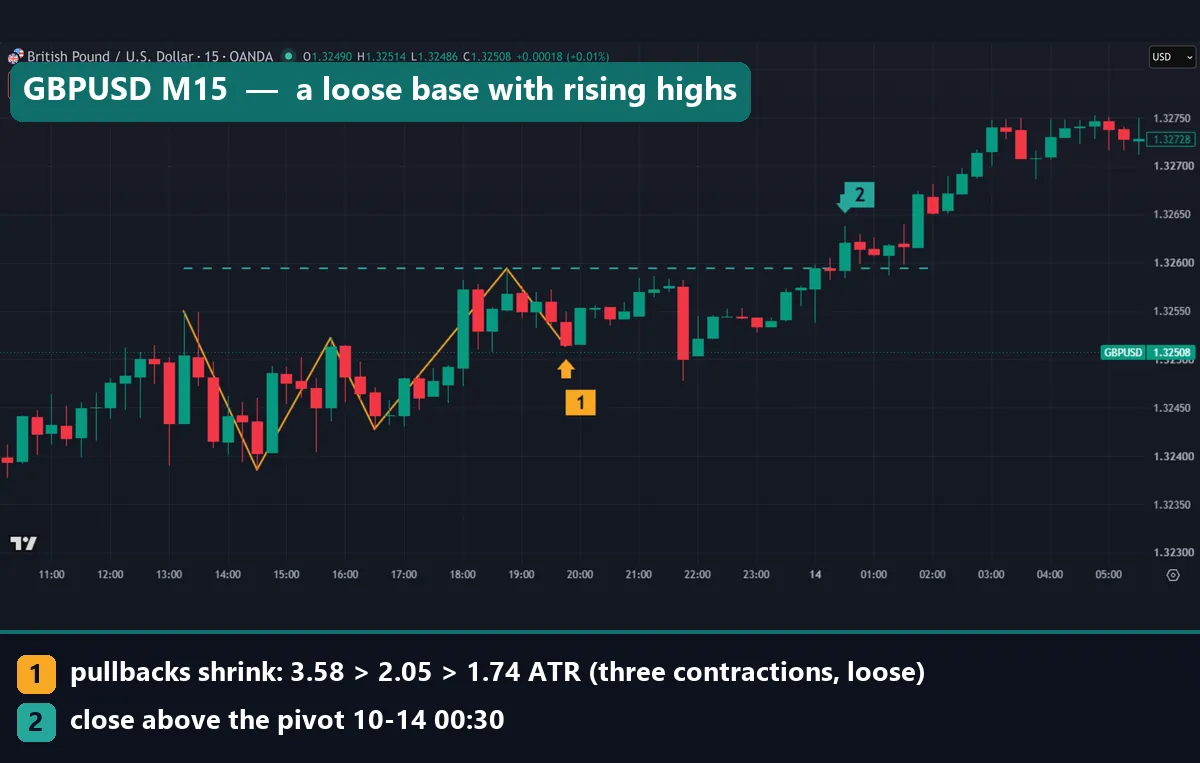
The GBPUSD 15-minute chart shows the loose rule on a short timeframe. Its pullbacks measured 3.58, 2.05 and 1.74 ATR, and the highs rose from 1.3255 to 1.32594, which the 1.5 ATR tolerance allows. Price closed at 1.32621, above the pivot, at 00:30 UTC on 14 October 2026 and climbed to about 1.3275 within a few hours. We tested no 15-minute data, so this is only an illustration.
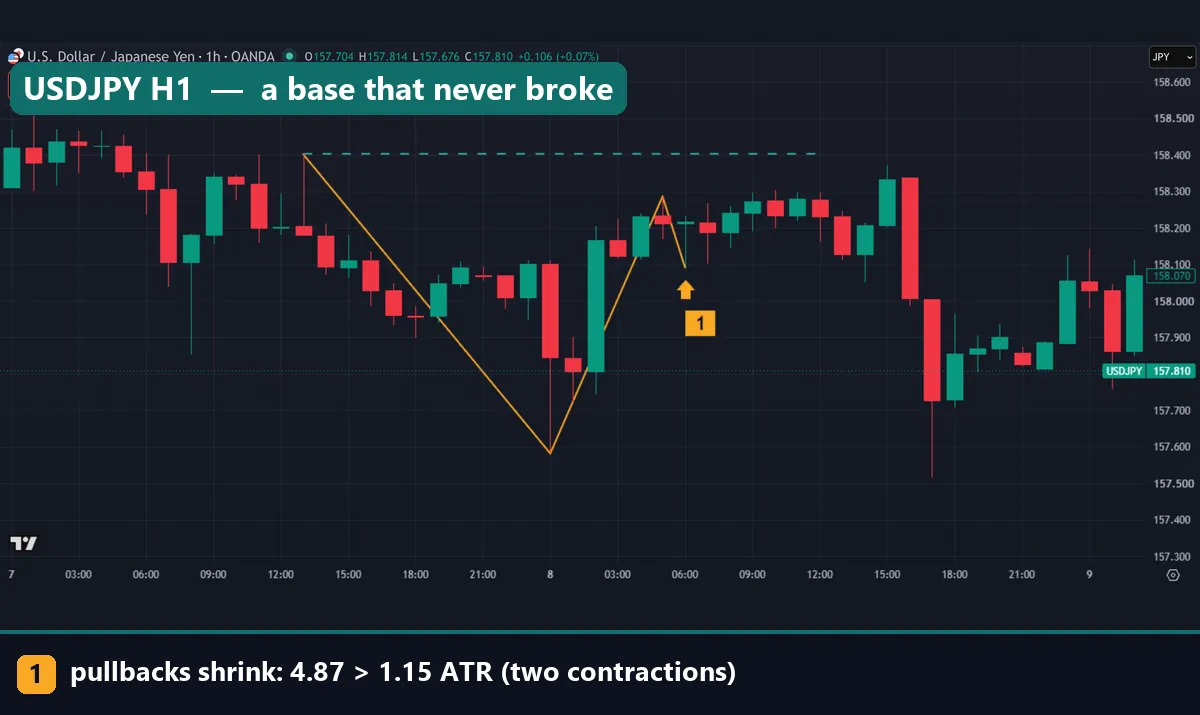
This USDJPY hourly chart shows the other side. Its pullbacks on 7 and 8 October measured 4.87 and 1.15 ATR, so the shape passed. Yet price never closed above the 158.402 pivot. It came close at 15:00 UTC on 8 October. Then the next two hourly candles fell through the last low at 158.092 and closed below 157.8, which is the failure line at work.
Common mistakes with the volatility contraction pattern
- Counting dips that do not shrink. If the second pullback is nearly as deep as the first, the base is not tightening. Measure each dip in ATR.
- Buying a break by a hair. The USDJPY hourly break cleared the pivot by under a pip and reversed within hours. Decide in advance how far a close must clear the pivot, then test that choice.
- Reading tick volume as real volume. A quiet last dip on MT4 means fewer price changes, not that sellers have left.
- Trusting one good chart. USDCHF worked, while GBPJPY hourly and USDJPY daily did not hold. Judge the rule on a sample, after costs.
Where to go next
- Cup and handle meaning, the closest relative of the VCP.
- Break and retest strategy, for what to watch after price clears a level.
- Trend following trading, the wider approach a VCP belongs to.
For the original stock-market version, the books page on Mark Minervini’s own site lists Trade Like a Stock Market Wizard, where he sets out the pattern.
FAQ: volatility contraction pattern questions
What does VCP stand for in trading?
Volatility contraction pattern: an uptrend base whose pullbacks shrink, followed by a close above its top.
Who created the volatility contraction pattern?
Mark Minervini, a US stock trader, describes it in his book Trade Like a Stock Market Wizard. He built it for stocks; we tested it on forex.
How many contractions does a VCP need?
Minervini does not fix one number. In our forex test, three strict contractions gave only 10 daily cases, while two gave 134.
Where is the pivot in a volatility contraction pattern?
We used the highest swing high in the base. The first close above it counts as the breakout, and a wick alone does not.
Does the VCP work in forex?
Only weakly in our data. After the break, 56.7% of two-contraction bases were higher 10 days later, against 51.0% for uptrend days, in-sample and before costs.
Can I use volume to confirm a VCP in forex?
Not as stock traders do. MT4 and OANDA volume is tick volume, and in our sample it barely fell in the last dip.
What timeframe is best for the VCP?
We measured the daily chart, and the strict rule found only 3 hourly cases. Our hourly and 15-minute charts are examples, so we cannot rank timeframes.
Where should the stop go on a VCP trade?
Our rule treats a close below the last low as a failure, so that low is the natural stop. Size from that distance and test the rule yourself first, because results are not guaranteed; past performance is not indicative of future results.
Last updated: 15 October 2026.

About the author
Written by Dominic Walsh, a Forex trader and MT4/MT5 indicator, Expert Advisor and script developer. Every tool on forexmt4systems.com is tested on live charts before release and ships with ready-to-use compiled MT4 (.ex4) and MT5 (.ex5) files. Learn more about the trader and developer behind this site.
How we build, test and correct every tool: Editorial & Testing Policy. Trading carries risk; see the disclaimer.