
The squeeze momentum indicator flags the moment Bollinger Bands slip inside a Keltner Channel, then shows which way momentum leans when they slip back out. Traders use it to spot quiet markets that may be about to wake up. This guide settles a simple question with our own data: does the move after a squeeze end turn out bigger than an ordinary move? We measured 982 daily squeezes on 23 currency pairs and 487 hourly ones. The short answer is no, not by much, and the sections below show why.
What the squeeze momentum indicator actually is
The idea comes from John Carter, who popularised it as the TTM Squeeze. It joins two tools that measure volatility in different ways. Bollinger Bands use the standard deviation of closing prices. Keltner Channels use the average true range. So when the market goes quiet, the Bollinger Bands shrink faster than the Keltner Channel.
At some point the bands fit fully inside the channel. That state is called “squeeze on”. Then, when volatility returns, the bands push back outside the channel. That first bar is the release, often called the squeeze “firing”.
The most used version on TradingView is a community script by LazyBear named “Squeeze Momentum Indicator”. It draws a histogram in a lower pane and marks the squeeze state with dots on the zero line. If the two band families are new to you, our side-by-side of Bollinger Bands vs the Keltner Channel covers the basics first.
In short, the tool answers two questions. Is the market coiled right now? And if it breaks out, which way does momentum point?
How the squeeze works: bands, channel and momentum
First, the Bollinger Bands. The middle line is a 20-period simple moving average of the close. The outer bands sit 2 standard deviations above and below it. Our guide to how Bollinger Bands are built walks through the math.
Next, the Keltner Channel. Its middle line is a 20-period exponential moving average. The outer lines sit 1.5 times the average true range away from it. True range is the full bar range, including any gap from the previous close. Our explainer on what ATR measures covers that part.
Then comes the test itself, written as one line:
squeeze ON  = upper BB < upper KC  and  lower BB > lower KC
squeeze OFF = the first bar where that stops being true
The momentum part is separate. In LazyBear’s script, the histogram is a linear regression of price against a midpoint. That midpoint blends the 20-bar high-low middle with a 20-bar moving average. So the bars above zero mean price sits above its recent centre, and below zero means it sits under it. Carter’s own version uses a similar momentum read. Still, both parts are lagging: they only describe bars that have already closed.
How we tested the squeeze
We tested the squeeze state, not the histogram colours. That keeps the rule exact and repeatable. Our full approach is set out in the editorial testing policy.
- Data: MetaTrader 4, build 1471, Capital Point Trading terminal history read from the .hst files.
- Daily sample: 23 forex pairs, from 12 June 2018 to 24 August 2026.
- Hourly sample: H1 bars on EURUSD, GBPUSD, USDJPY and XAUUSD from the same terminal.
- Rule: squeeze on while both Bollinger Bands (20 SMA, 2 standard deviations) sit inside the Keltner Channel (20 EMA plus or minus 1.5 times the 20-EMA of true range).
- Measure: the close 10 bars after release against the release close, in units of ATR.
- Control: the same 10-bar move measured from ordinary bars, sampled every 5 bars.
Our chart images come from the TradingView web chart with OANDA data, captured on 9 October 2026. On those charts we drew a yellow box over each squeeze-on stretch. All results are before spread, swap and commission.
Settings we used, and what each one changes
These are the inputs behind every number in this article. They match Carter’s classic setup and LazyBear’s defaults closely. Our Bollinger Band settings guide covers other combinations.
| Setting | Our value | What changing it does |
|---|---|---|
| BB length | 20 | Shorter reacts faster but flips on and off more often |
| BB standard deviations | 2 | Lower makes the bands narrower, so squeezes appear more often |
| KC length | 20 | Sets the EMA and the true-range average together |
| KC multiplier | 1.5 | Higher widens the channel, so more bars count as squeeze on |
| KC band style | True range | Uses the full bar range, gaps included |
| Move window | 10 bars | Our test choice, not an indicator input |
The multiplier matters most. A small change to it shifts how many squeezes you see. So compare tools only when both use the same numbers.
Reading a squeeze on the chart
On our charts the teal lines are the built-in Bollinger Bands. The yellow lines are the Keltner Channel. The squeeze is on whenever both teal bands sit between the yellow lines.
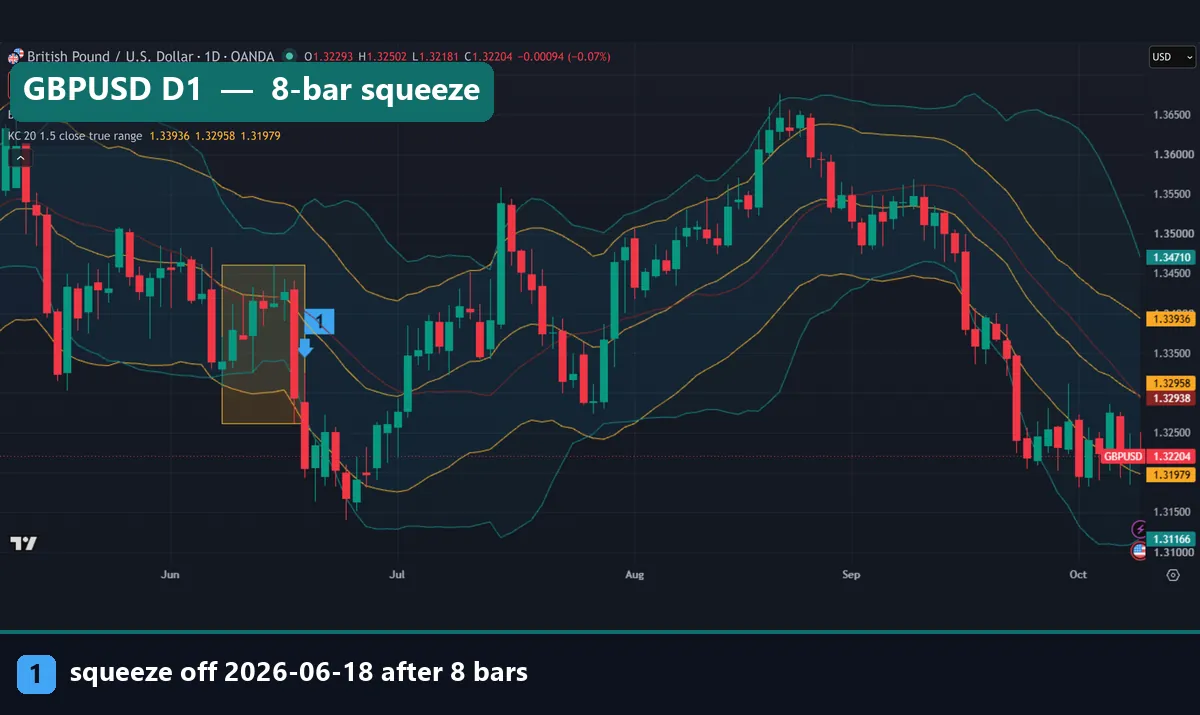
Take GBPUSD on the daily chart. The squeeze turned on on 8 June 2026 and ended on 18 June after 8 bars. The box spans 1.3262 to 1.3461. Then price dropped out of the bottom of the box over the next few days. After that, the pair turned and climbed through July. So the first push and the bigger trend pointed in opposite directions.
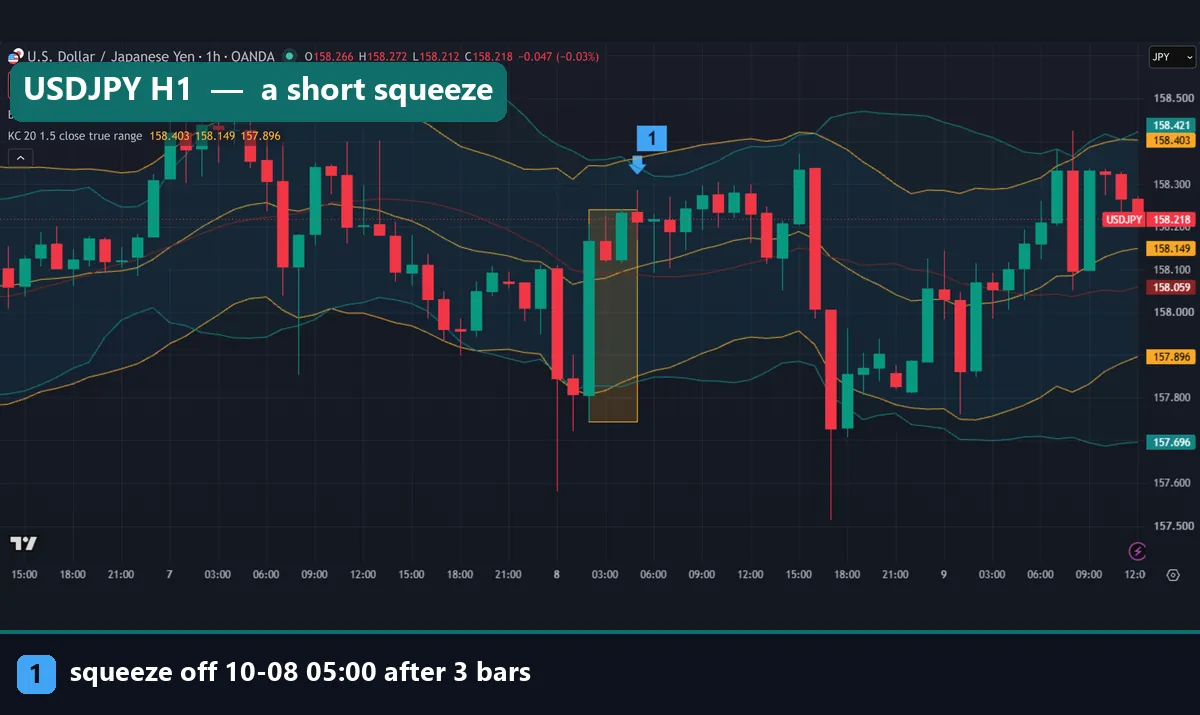
Now look at a short squeeze. On USDJPY H1 it began at 02:00 UTC on 8 October 2026 and ended at 05:00 UTC, after just 3 bars. The box runs from 157.745 to 158.24. For most of that day price drifted sideways near the top of the box. Then a sharp drop came in the evening. In other words, the release told us little about the next few hours.
For a cleaner view of band width on its own, see our guide to Bollinger Band Width. It tracks the same contraction as a single line.
Worked example: EURUSD daily, July 2026
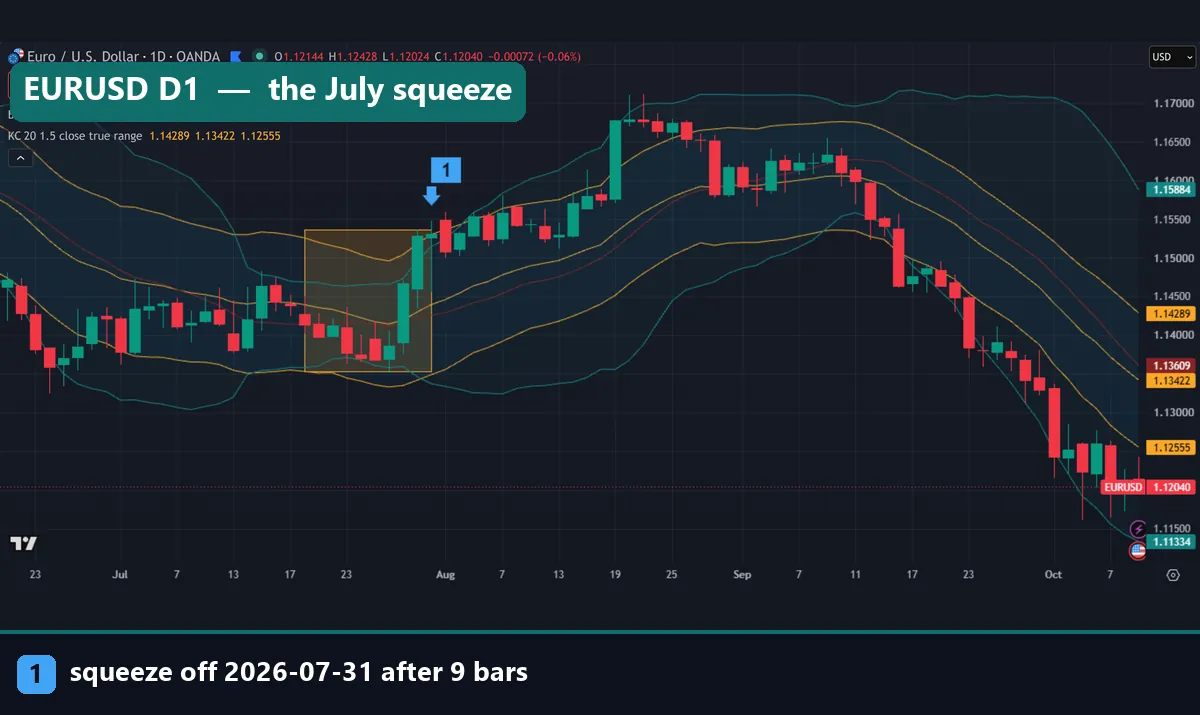
Our first image shows the clearest case in our recent captures. Here are the numbers from the chart and our marks file.
- The squeeze turned on on 20 July 2026.
- It ended on 31 July 2026, after 9 bars.
- The box high was 1.1537 and the box low was 1.13532.
- That is a range of about 184 pips while the market was coiled.
The last bars inside the box were large green candles that lifted price to the top of it. Then price kept rising through August. By the third week of August it was trading close to the 1.17000 grid line on the chart.
That looks like a textbook squeeze. However, look at what came next. From early September the pair fell steadily. By early October it was well below the bottom of the July box. So the post-release rally lasted a few weeks, and then the whole move reversed.
This is the honest reading. The squeeze marked a quiet period, and quiet periods do end. Still, the chart alone cannot tell you how far the next move goes or how long it lasts. That needs a larger sample, which is the next section.
What 982 daily squeezes did next
Here is the core result. The median daily squeeze lasted 5 bars. The median H1 squeeze lasted 4 bars.
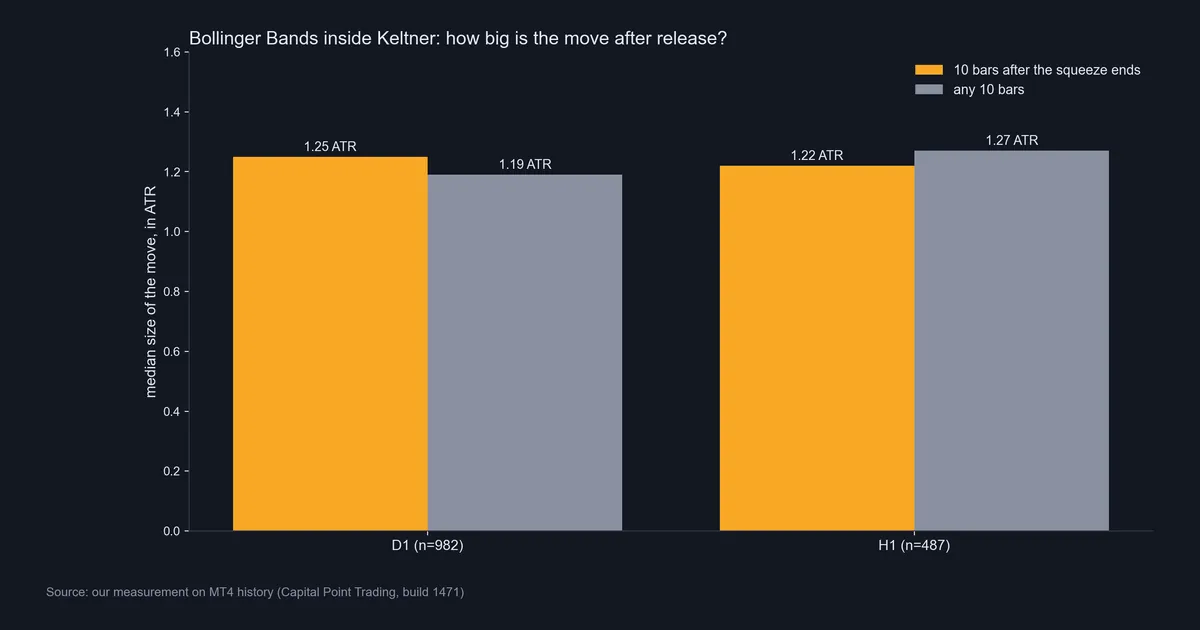
Then we measured the move 10 bars after each release, in ATR. On daily charts the median was 1.25 ATR. Ordinary 10-bar stretches moved 1.19 ATR. On H1 the squeeze moved 1.22 ATR, while ordinary bars moved 1.27 ATR. So the gap is tiny on D1 and slightly negative on H1.
In plain terms, the market after a squeeze moved about as far as it does on any other day. The idea that a squeeze “stores energy” did not show up in this data.
The direction test looked better at first. The first bar after release pointed the same way as the full 10-bar move 59.6% of the time on D1 and 60.8% on H1. But that number is partly mechanical. That first bar is itself part of the 10-bar move. So it pulls the result toward a match, even with no real edge.
A gold squeeze that did break out
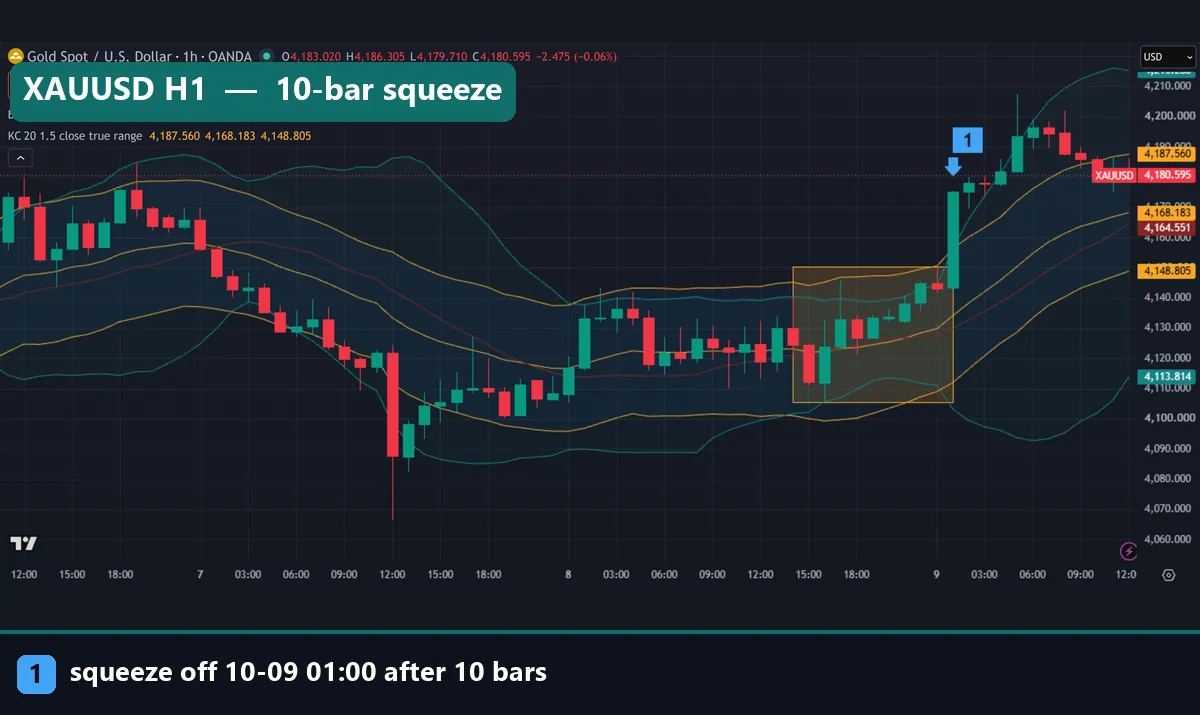
Gold on H1 shows the kind of case people remember. The squeeze ran from 14:00 UTC on 8 October to 01:00 UTC on 9 October, 10 bars in all. The box spanned $4,105.50 to $4,150.43. Then a large green bar broke out, and price traded above $4,200 within hours. Cases like this are real. Yet the median says they are not the norm.
Download the complete indicator database
Put these concepts on your charts. One email unlocks the full library of 1,380+ indicators with compiled MT4 and MT5 files, plus my TradingView scripts. No paywall, no spam, unsubscribe any time.
Get free access to my indicator database
One email unlocks 1,380+ free MT4, MT5 and TradingView indicators — the complete library. No single-tool download; you get the whole database.
Where it fails
First, the squeeze does not predict size. Our 982 daily cases moved about as far as ordinary bars. If you trade it for a bigger-than-normal move, the data does not support that.
Second, it does not predict direction on its own. The histogram shows where price sits against its recent centre. That is a description of the past, not a forecast. The GBPUSD case above broke down first and then rallied for weeks.
Third, short squeezes add noise. Many squeezes last only 1 to 3 bars. Those often come from one quiet session rather than a true coil. They release quickly and lead nowhere.
Fourth, the signal comes late. By the time the bands leave the channel, the expansion bar has already printed. On the EURUSD chart, the big green candles printed while the squeeze was still on.
Fifth, settings change everything. A 2.0 Keltner multiplier marks far more bars as squeeze on than our 1.5. Two traders can look at the same chart and see different signals.
Finally, there is no volume behind it. The test uses price only. That is fine for forex, but it means the tool cannot tell a coil from a holiday lull.
Building the squeeze on TradingView
You do not need a community script to see the squeeze. Add the built-in Bollinger Bands with default settings. Then add the built-in Keltner Channels and change its inputs.
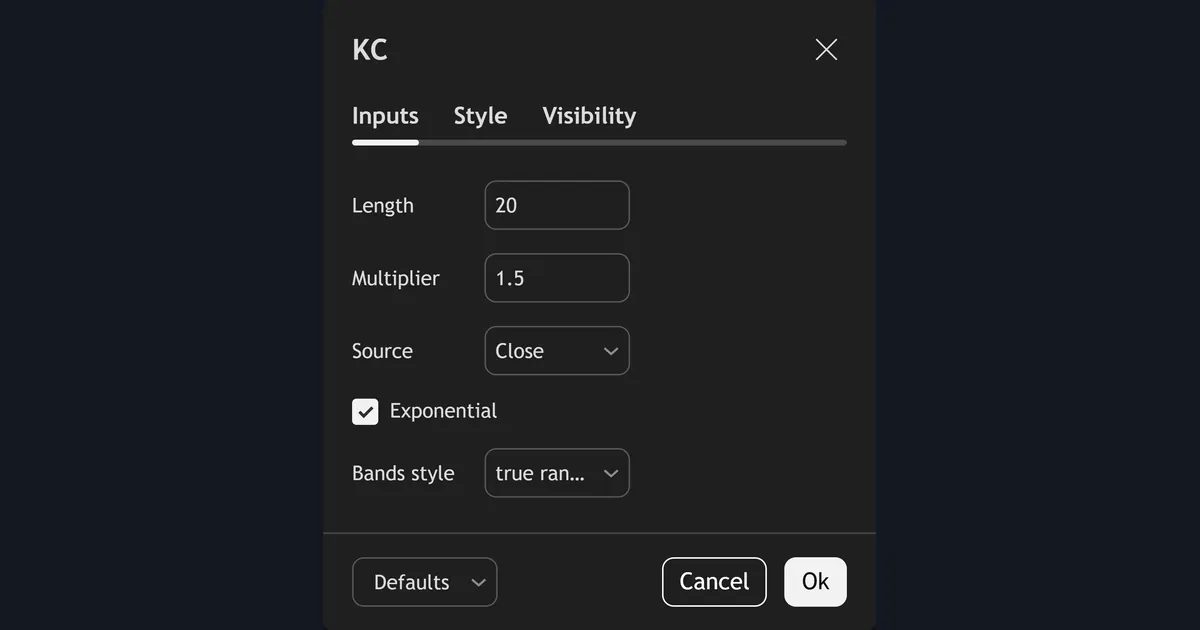
Our settings panel shows Length 20, Multiplier 1.5 and Source Close. Exponential is ticked, and Bands style is set to true range. Then colour the Keltner lines so they stand apart from the bands. We used yellow against teal.
On MetaTrader, our free Bollinger squeeze download is one option, and a separate Keltner Channels indicator lets you draw the channel yourself. Our install guide for MT4 and MT5 indicators covers the folder steps. The downloads are compiled files only.
A live case: GBPJPY in October 2026
Our last image shows a squeeze that had just ended when we captured it.
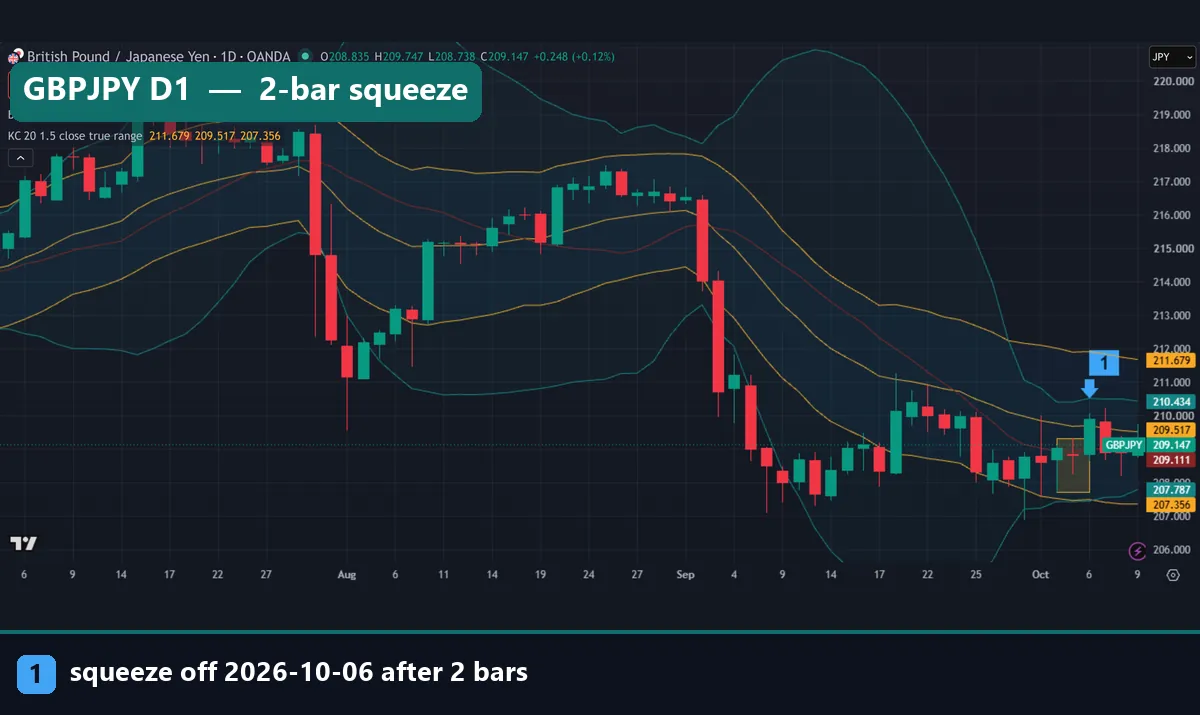
On GBPJPY daily, the squeeze turned on on 2 October 2026. It ended on 6 October after only 2 bars. The box spans 207.712 to 209.32. By 9 October price was trading at 209.147, still inside that box.
So this release has not led to a move yet. That is common. A 2-bar squeeze after a long slide often marks a pause, not a coil. Also note how wide the bands were in September. A quiet week after a fast drop can trigger a squeeze simply because the drop has left the average.
Common mistakes with the squeeze
- Treating release as a trade signal. The release only says volatility rose. Our data shows the next 10 bars move about as far as any 10 bars.
- Reading histogram colour as a forecast. A rising histogram describes closed bars. Instead, confirm direction with price structure, such as a break of the box high or low.
- Ignoring the stop distance. A breakout from a narrow box can reverse quickly. Size the stop with ATR, as in our guide on using ATR as a stop loss.
- Mixing settings across tools. LazyBear’s script, Carter’s version and a home-made BB plus KC setup can disagree. So check the multiplier before you compare signals.
Where to go next
If the squeeze fits your style, pair it with a channel method. Our Keltner Channel strategy guide shows trade rules built on the same channel. For the momentum side, our MACD explainer covers a different momentum read. Also, the linear regression line indicator shows the regression idea behind the histogram on the price chart.
For outside reading, these four sources are worth your time:
- The TTM Squeeze article at StockCharts ChartSchool, which explains Carter’s dots and histogram.
- LazyBear’s Squeeze Momentum Indicator on TradingView, the community script most people mean.
- John Bollinger’s band rules at BollingerBands.com, from the author of the bands.
- The Keltner channel entry on Wikipedia, for the channel’s history.
FAQ
What does the squeeze momentum indicator show?
It shows when Bollinger Bands sit inside a Keltner Channel, which marks low volatility. A histogram then shows whether price sits above or below its recent centre.
Who created the squeeze?
John Carter popularised it as the TTM Squeeze. LazyBear later published the “Squeeze Momentum Indicator” script on TradingView, which is the version most traders now use.
Is the move bigger after a squeeze ends?
Not in our test. Daily releases moved a median 1.25 ATR over 10 bars against 1.19 ATR for ordinary bars. On H1 the squeeze moved less, 1.22 against 1.27 ATR.
How long does a squeeze usually last?
In our data the median daily squeeze lasted 5 bars. The median H1 squeeze lasted 4 bars. Many lasted only 1 to 3 bars.
What settings should I use?
We used Bollinger Bands 20 and 2 with a Keltner Channel of 20 and 1.5 on true range. Those match the classic setup. Changing the multiplier changes how often squeezes appear.
Can I build it from built-in TradingView tools?
Yes. Add Bollinger Bands, then add Keltner Channels with length 20, multiplier 1.5 and true range bands. The squeeze is on while both bands sit inside the channel.
Does the squeeze work on forex?
It runs on any chart, since it uses price only. But on 23 forex pairs it did not produce larger moves than normal, so treat it as a volatility filter, not a signal.
Should I trade every squeeze release?
No. Use it to find quiet markets, then wait for price structure and size risk with ATR. Remember that results are not guaranteed; past performance is not indicative of future results.
Last updated: 9 October 2026.

About the author
Written by Dominic Walsh, a Forex trader and MT4/MT5 indicator, Expert Advisor and script developer. Every tool on forexmt4systems.com is tested on live charts before release and ships with ready-to-use compiled MT4 (.ex4) and MT5 (.ex5) files. Learn more about the trader and developer behind this site.
How we build, test and correct every tool: Editorial & Testing Policy. Trading carries risk; see the disclaimer.