
A Keltner channel strategy trades closes outside a volatility band drawn around a 20-period EMA. Some traders buy a close above the upper band as a breakout. Others fade it and expect a return to the middle. This guide settles which of those two readings the data supports. We counted every first close outside the channel on 23 daily FX pairs since 2018, plus four hourly markets, and checked what came next. The short answer: most closes outside the band did not stay outside, and the “breakout” side did no better than chance five bars later.
What a Keltner channel is
A Keltner channel is three lines on the price chart. The middle line, called the basis, is a moving average of price. Then an upper band sits above it and a lower band sits below it. The gap between each band and the basis is a multiple of recent range, so the channel widens when bars get bigger and narrows when they shrink.
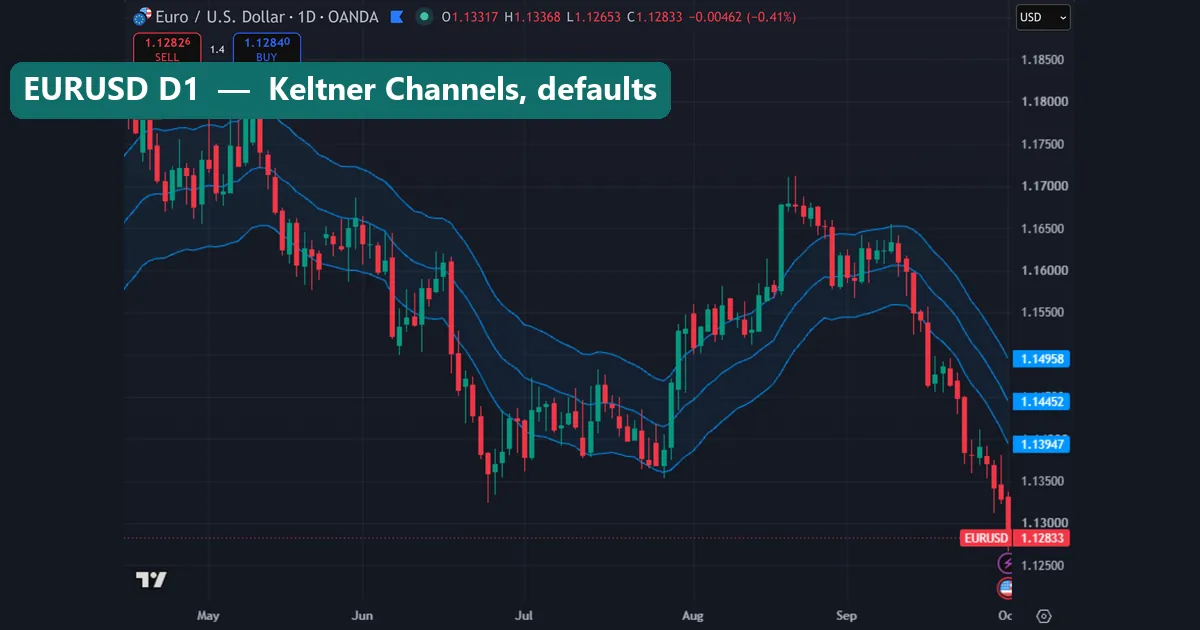
On the EURUSD daily chart above, for example, the channel is wide in June and narrow in late July, because the June bars were larger.
The idea is old. Chester Keltner described a ten-day moving average rule in his 1960 book, How to Make Money in Commodities. His version used a 10-day simple average of the typical price, with the 10-day average high-low range added and subtracted. Later, in the 1980s, Linda Bradford Raschke popularised the version most charts use now: an EMA basis with bands set by Average True Range. The Keltner Channels article at StockCharts ChartSchool records both versions.
If you came here to choose between this tool and Bollinger Bands, our Bollinger Bands vs Keltner Channel comparison covers that question. This guide stays on the channel itself and what its signals did.
How Keltner Channels are calculated
TradingView’s built-in indicator has three parts. First, the basis is an EMA of the close over 20 bars. Next, the indicator takes the true range of each bar. True range is the largest of three gaps: high minus low, high minus the previous close, and the previous close minus low. So it counts overnight gaps as well as the bar itself.
Then it smooths true range with its own 20-bar EMA and multiplies the result. With the default settings the formulas are:
basis = EMA(close, 20)
width = EMA(true range, 20)
upper = basis + multiplier x width
lower = basis - multiplier x width
With multiplier 1, each band sits one smoothed true range from the basis. With multiplier 2, it sits twice as far away. Our ATR explainer covers true range in more depth, and our guide to the 20 EMA covers the basis line on its own.
Note one detail. Many sites describe the bands as “2 x ATR(10)”, which is the StockCharts default. TradingView’s default is different: multiplier 1, with a 20-bar EMA of true range. So the same name can mean a much narrower channel on one platform than another. TradingView’s own Keltner Channels help page on TradingView lists every input.
Two ways to run a Keltner channel strategy
Traders read the same signal in two opposite ways.
The first is the breakout or trend reading. A close above the upper band means buyers pushed price further than recent volatility would suggest. So the trader buys, expecting the move to carry on. A close below the lower band is a short. This is close to classic trend following, with the band as the trigger.
The second is the mean reversion reading. Here a close outside the band means price stretched too far from its average. So the trader sells a close above the upper band and buys a close below the lower band, with the basis as the target.
Both readings cannot be right at once. So we asked two plain questions about every first close outside the channel. Did price close back inside within five bars? And was the close five bars later further in the breakout direction?
How we tested
We used MetaTrader 4 history from Capital Point Trading, build 1471, read straight from the terminal’s history files. The daily test covers 23 FX pairs from 12 June 2018 to 24 August 2026, which is 37,748 daily candles. The hourly test covers EURUSD, GBPUSD, USDJPY and XAUUSD from 1 July 2025 to 26 August 2026.
We rebuilt TradingView’s default Keltner Channels in code: EMA 20 basis, bands from an EMA 20 of true range. Then we ran it twice, once with multiplier 1 and once with multiplier 2. A “first close above” is a bar that closes above the upper band after the previous bar closed inside. The lower side mirrors it.
For each event we recorded whether any of the next five bars closed back inside the channel. We also compared the close five bars later with the signal close. For a base rate, any daily close in our universe was higher five days later 51.6% of the time.
The chart images come from the TradingView web chart (OANDA feed) with default Keltner Channels, taken on 1 October 2026. Our editorial testing policy explains how we run and report tests like this one.
Keltner channel settings we tested
This table shows TradingView’s default inputs and what we changed for the second run.
| Input | TradingView default | Our run A | Our run B | What it does |
|---|---|---|---|---|
| Length | 20 | 20 | 20 | Bars in the basis EMA and in the width EMA |
| Multiplier | 1 | 1 | 2 | How many widths each band sits from the basis |
| Source | Close | Close | Close | Price fed into the basis |
| Exponential | On | On | On | EMA basis; off gives a simple average |
| Bands style | True range | True range | True range | What the width measures |
The multiplier matters most. Doubling it cut the number of closes outside by about two thirds. On daily FX, for example, closes above the upper band fell from 1,948 events at multiplier 1 to 690 at multiplier 2.
Reading Keltner Channels on a chart
The slope of the basis tells you the drift. The width tells you how big recent bars have been. Then the position of the close tells you where price sits inside that range.
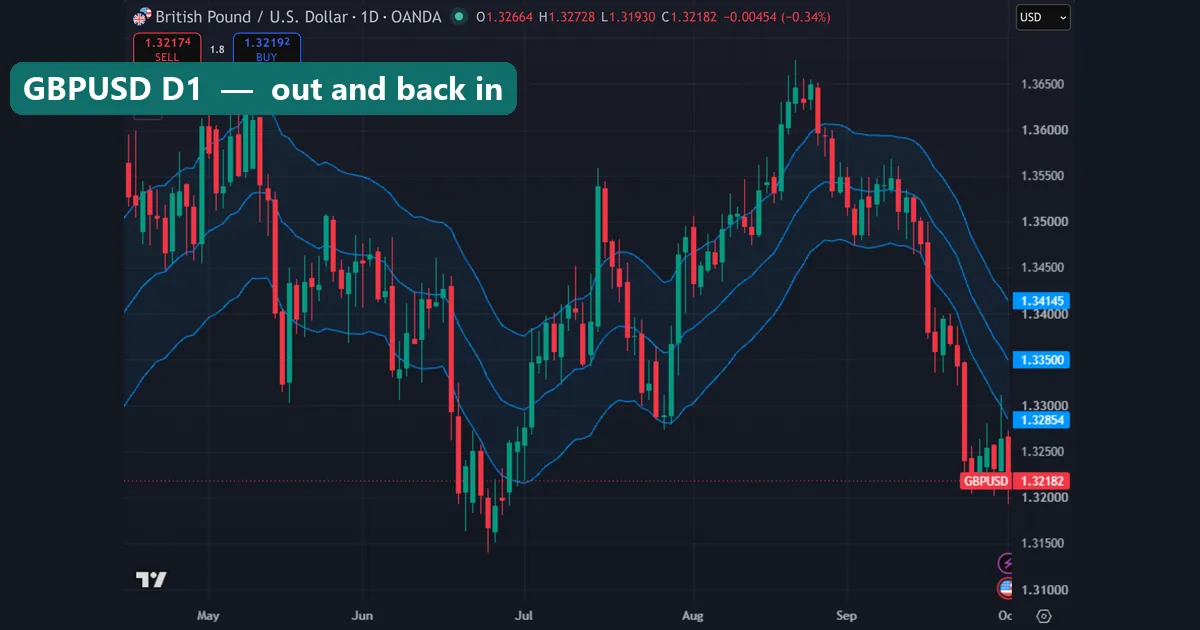
On GBPUSD daily, a large green candle in mid-August closed well above the upper band near 1.365. But price then fell back inside the channel within days. Late June shows the reverse: closes below the lower band near 1.32, then a rally back into the channel. In late September, however, several bars closed below the lower band in a row, and the latest close of 1.32182 still sat below the lower band at 1.32854.
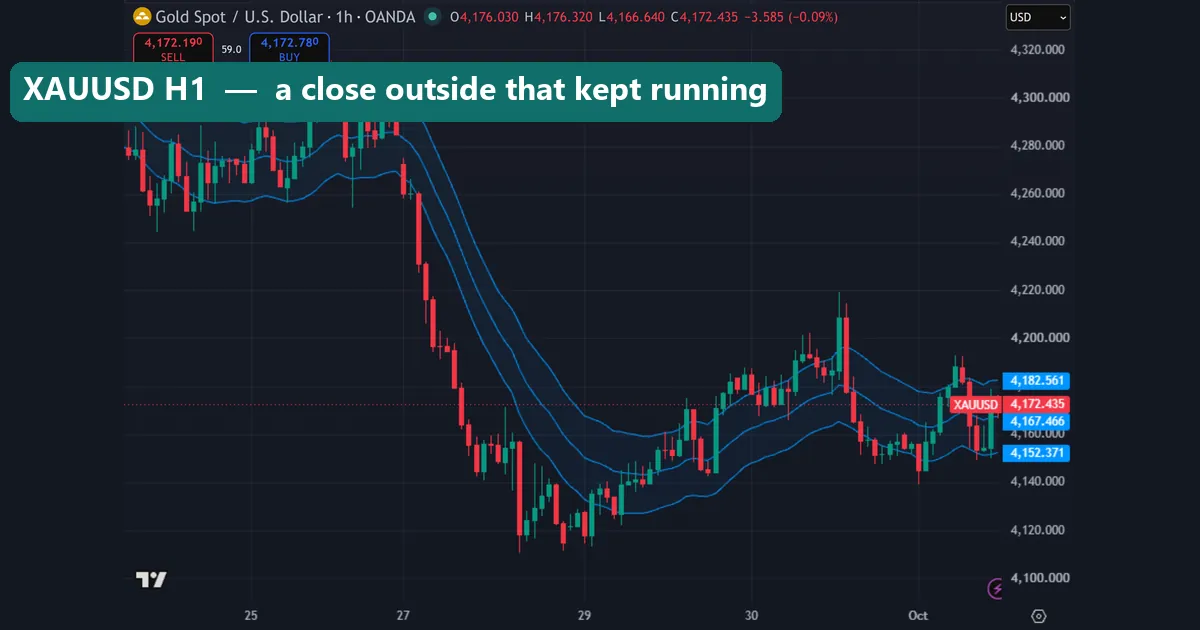
Gold on the hourly chart shows the case that hurts faders. On the 27th, price broke below the lower band and kept closing outside it for many bars, as the whole channel turned down behind it. A trader buying the first close below that band would have bought near the top of a long fall. So “outside the band” alone says nothing about how far a move can run.
What our Keltner channel strategy test found
On 23 daily FX pairs with multiplier 1, we found 1,948 first closes above the upper band. Of those, 76.6% closed back inside within five bars. Only 50.1% were higher five bars later, which is below the 51.6% base rate for any daily close.
Below the lower band we found 1,784 events. Then 79.8% closed back inside within five bars, and 46.2% were lower five bars later. Since the base rate for higher is 51.6%, a random daily close was lower five bars later a little under half the time. So the short side also sat near or below chance.
Multiplier 2 made the bands rarer and the return more likely. There were 690 closes above, with 87.8% back inside and only 44.2% higher. There were 594 closes below, with 89.4% back inside and 44.9% lower.
The hourly results on EURUSD, GBPUSD, USDJPY and XAUUSD looked similar. At multiplier 1, 71.9% of 1,017 upper closes and 76.1% of 1,021 lower closes went back inside. Five bars later, 51.0% and 48.8% had moved in the breakout direction. At multiplier 2, 81.2% of 478 and 86.7% of 406 returned, with 49.8% and 42.9% follow-through. We have no separate hourly base rate in our file, so read those against 50%.
Worked example: EURUSD daily
On the EURUSD daily capture from 1 October 2026, the legend shows the upper band at 1.14958, the basis at 1.14452 and the lower band at 1.13947. The latest close was 1.12833.
First, find the width. The upper band minus the basis is 0.00506, so one smoothed true range was about 50.6 pips. At multiplier 2, the lower band would sit two widths under the basis, near 1.13440. The close of 1.12833 sat below even that line.
Next, look up the matching row. Daily closes below a multiplier 2 band went back inside within five bars 89.4% of the time, across 594 events. Only 44.9% were lower five bars later. So our history leans toward a return, not a run.
Still, that is all it says. It gives no entry, no stop and no target, and it says nothing about how far price fell before it turned.
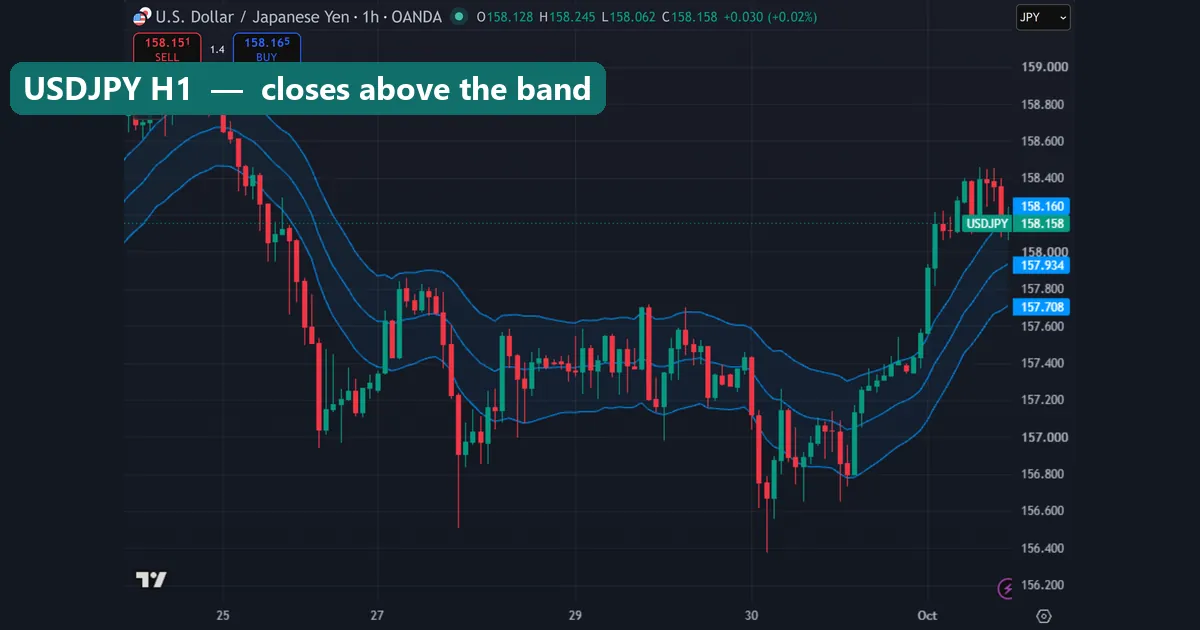
USDJPY hourly shows the upper side on 1 October. The close of 158.158 sat almost on the upper band at 158.160, only about 22.6 pips from the basis. So on an hourly chart, small moves cross the bands.
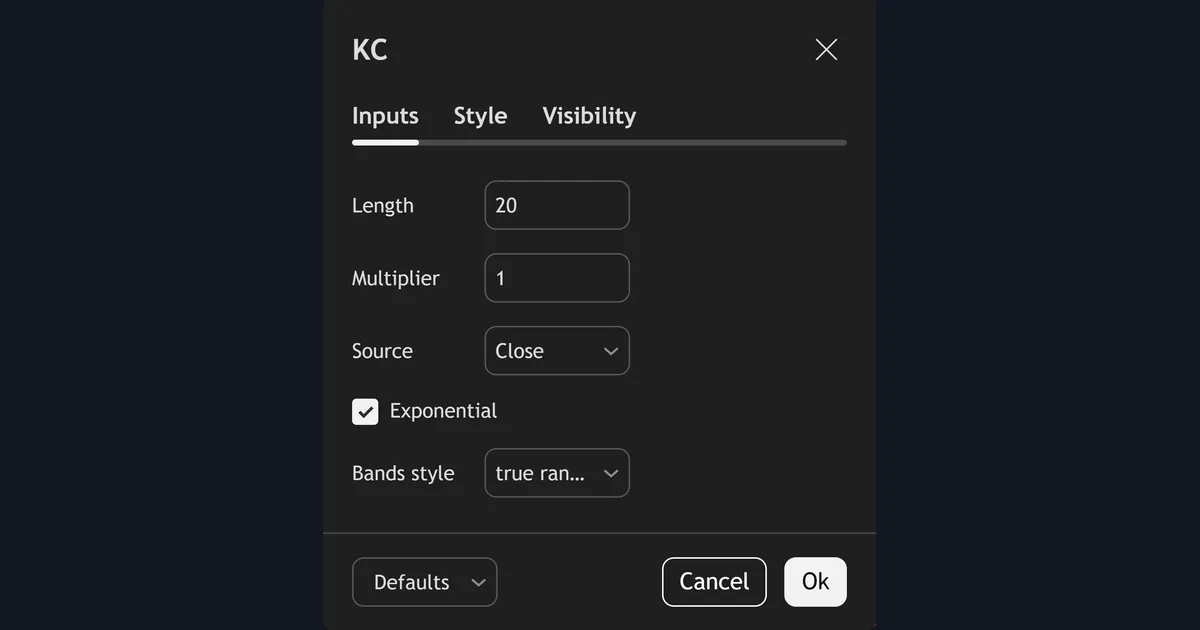
To repeat our setup, keep the defaults shown above and change only the multiplier to 2 for the wider run.
Download the complete indicator database
Put these concepts on your charts. One email unlocks the full library of 1,380+ indicators with compiled MT4 and MT5 files, plus my TradingView scripts. No paywall, no spam, unsubscribe any time.
Get free access to my indicator database
One email unlocks 1,380+ free MT4, MT5 and TradingView indicators — the complete library. No single-tool download; you get the whole database.
Where it fails
The breakout reading fails most plainly. On daily FX, a first close above the upper band was higher five bars later 50.1% of the time at multiplier 1 and 44.2% at multiplier 2. Both sit below the 51.6% base rate. So buying the close outside the band bought no edge in our sample.
The mean reversion reading looks better, but it is not a strategy yet. “Back inside within five bars” only means one close crossed back over the band. That could be a move of a few pips. Also, price can run hard first, as gold did on the hourly chart, and a fader with no stop would sit through that whole move.
We also did not test costs. Spread and commission take a bigger share of a narrow hourly channel than a daily one. Our guide to backtesting transaction costs shows why that matters.
Finally, the hourly sample covers about 14 months on four symbols. That is enough to see a pattern, but it is one market regime. Our note on backtest sample size explains why small samples swing.
Two charts that show the limits
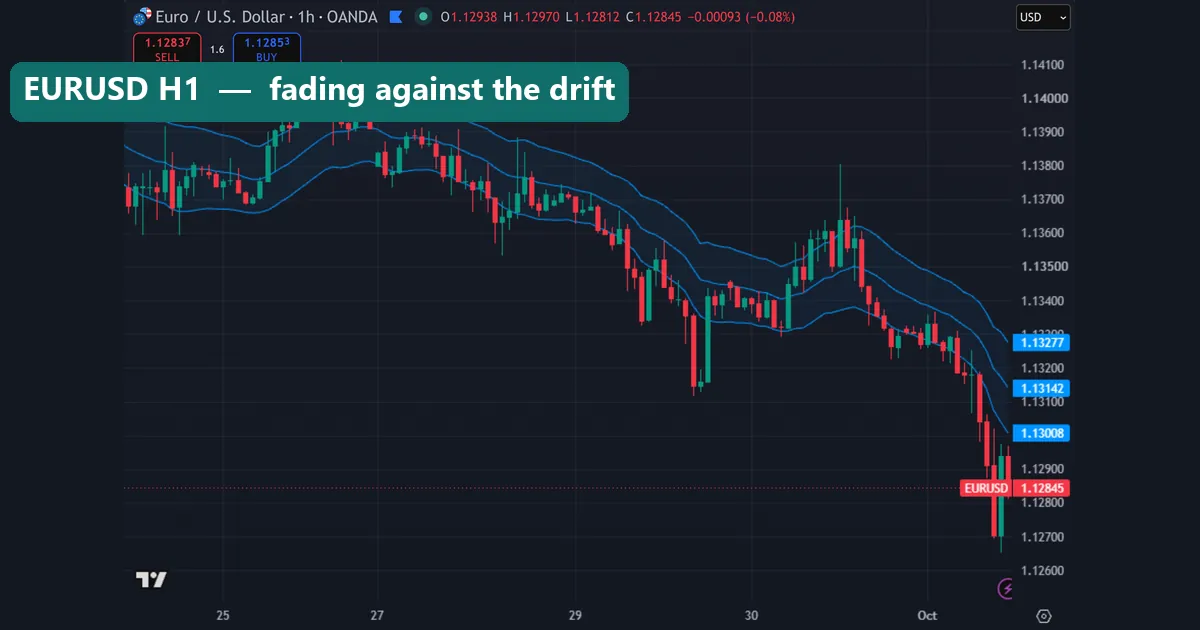
EURUSD hourly shows both points at once. On 1 October price fell through the lower band at 1.13008 and closed at 1.12845, even as the whole channel was already sloping down. So a fade signal here pointed against a clear down drift.
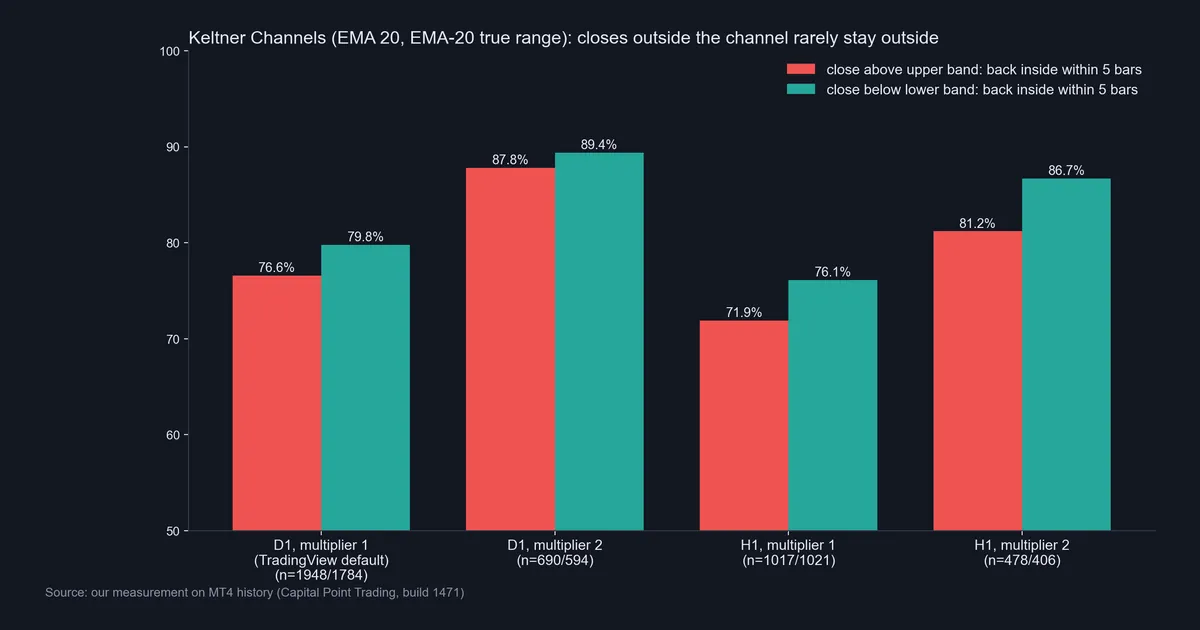
Our measurement in the chart above sums it up. Every bar is well above 70%, so closes outside the channel mostly do not stay outside. And the wider the band, the more often price came back.
Common mistakes with Keltner Channels
- Treating every close outside as a breakout. In our daily data, follow-through after five bars sat at or below chance at both multipliers.
- Calling “back inside” a winning trade. A return to the band is not a return to the basis. Without a stop and a target, you cannot know the result. Our guide on how to use a stop loss covers the missing half.
- Copying settings across platforms. TradingView’s default is multiplier 1 with an EMA of true range. StockCharts uses 2 x ATR(10). So a rule from one site may fire far more often on another.
- Ignoring the slope of the basis. A fade against a steep basis, like gold on the 27th, fights the drift. Check the basis direction before you read the band.
Where to go next
If you want to add a stop to the reversion idea, our guide on using ATR as a stop loss uses the same true range measure as the channel. Then work out whether the rule pays with our trading expectancy primer.
For volatility squeezes, the Bollinger Band Width guide shows a related way to measure a narrowing range. Also, our SMA vs EMA explainer shows what changes when you untick the Exponential box.
For MetaTrader, our Keltner Channels indicator page and the related ATR channels indicator draw the same kind of envelope. Before you trust any rule, follow our steps on how to backtest a trading strategy.
For outside reading, the Keltner channel entry on Wikipedia gives a short history, and the Keltner Channel definition at BabyPips gives a plain forex view.
FAQ: Keltner channel strategy questions
What are the default Keltner Channel settings on TradingView?
Length 20, multiplier 1, source Close, Exponential on and bands style true range. So the basis is EMA 20 and each band sits one 20-bar EMA of true range away.
Is a close above the upper Keltner band a buy signal?
Not on its own in our data. On 23 daily FX pairs, 50.1% of 1,948 first closes above the band were higher five bars later, against a 51.6% base rate for any close.
Do Keltner Channels work for mean reversion?
Price often came back. At multiplier 1, 76.6% of daily closes above and 79.8% of closes below returned inside within five bars. But we did not test stops, targets or costs, so that is not a full strategy.
Should I use multiplier 1 or 2?
Multiplier 2 gives fewer signals, and in our test more of them returned inside: 87.8% above and 89.4% below on daily FX. Multiplier 1 fires about three times as often, with lower return rates.
How are Keltner Channels different from Bollinger Bands?
Keltner bands use true range, while Bollinger Bands use standard deviation of the close. Our separate Bollinger Bands vs Keltner Channel article covers the full comparison.
Who invented Keltner Channels?
Chester Keltner described the first version in his 1960 book. Later, Linda Bradford Raschke popularised the EMA and ATR version that most platforms now use.
Does the Keltner channel strategy work on hourly charts?
The pattern looked much the same. On EURUSD, GBPUSD, USDJPY and XAUUSD hourly, 71.9% to 86.7% of closes outside went back inside within five bars, and follow-through sat between 42.9% and 51.0%.
Can I trade a Keltner channel strategy without a stop loss?
We would not. Some closes outside kept running for many bars, as gold did on our hourly chart, so plan the stop and size before the entry; results are not guaranteed; past performance is not indicative of future results.
Last updated: 1 October 2026.

About the author
Written by Dominic Walsh, a Forex trader and MT4/MT5 indicator, Expert Advisor and script developer. Every tool on forexmt4systems.com is tested on live charts before release and ships with ready-to-use compiled MT4 (.ex4) and MT5 (.ex5) files. Learn more about the trader and developer behind this site.
How we build, test and correct every tool: Editorial & Testing Policy. Trading carries risk; see the disclaimer.