
Weekend Wall Street is IG’s own weekend market on its Dow product, quoted while the US stock market is shut. This article settles what that price is, what it is not, and what the gap it tries to anticipate really looks like. We hold no IG weekend prices, so we cannot test that market or say whether it predicts Monday. Instead, we measured the Friday-to-Sunday gap on ordinary Dow, S&P 500 and Nasdaq CFDs. In short, most gaps were small and came back, while the big ones often stayed.
What Weekend Wall Street actually is
The name belongs to one provider. IG’s weekend trading page lists Weekend Wall Street beside Weekend US Tech 100, Weekend UK 100 and other indices. IG’s weekday Wall Street page, linked from there, is titled as a Dow Jones overview. So this is a Dow-based product from one firm, not an exchange session. Other brokers offer weekend indices too, under other names. We name no best one, and nothing here recommends a broker.
IG says it has no real-time data on the underlying market during weekend hours. Instead, it bases prices on underlying market conditions such as volatility, plus client activity and news flow. That fits the calendar, because the NYSE hours and calendars page puts the core session at 9:30 a.m. to 4:00 p.m. ET, and the exchange does not trade at weekends. So the weekend quote is one firm’s estimate, not a live index level.
IG’s page carries its own warning too. When we read it on 3 November 2026, it said 70% of retail investor accounts lose money when trading spread bets and CFDs with this provider. If these products are new to you, start with what CFDs are and what stock indices are.
What IG says the market is for
IG gives two uses: reacting to weekend news instead of waiting for the reopen, and hedging, by opening an opposite position on the same weekend market to offset a possible loss on a weekday position. Our page on hedging in forex covers the general idea and its drawbacks.
One detail is easy to miss. IG says a weekend position still open at the cut-off rolls into the equivalent weekday position, with any attached stops or limits in place. So a weekend trade can become a Monday trade unless you close it first.
How the weekend gap works
The index CFDs in our test stop quoting on Friday evening, yet the news does not stop. When they restart on Sunday evening, the first price can sit well away from Friday’s close. That jump is the gap, and it is what a weekend price tries to anticipate. We calculate it like this:
gap % = (first price after the weekend / last H1 close before it - 1) x 100
So a Friday close of 38,253 and a first price of 36,764.5 give -3.89%. Forex pairs show the same effect, and our page on the weekend gap in forex covers it. Our guide to forex trading on the weekend explains why spot forex stops. For the wider family, see the types of gaps.
IG’s timetable shows how the two markets meet. Its UK page says weekend index trading closes at 10.40pm on Sunday, UK time, and the weekday market resumes 20 minutes later at 11pm. So the weekend market stops just before the reopen it tries to anticipate.
How we tested the weekend gap
We used the TradingView web chart and pulled OANDA’s H1 bars on 3 November 2026 for three symbols: US30USD (Dow), SPX500USD (S&P 500) and NAS100USD (Nasdaq 100). OANDA is our data feed here, not a recommendation. One chart below uses M15 for a closer view. The method follows our editorial testing policy.
Our sample is 124 weekends, from 23 June 2024 to 1 November 2026. Before mid-June 2024, OANDA’s hourly opens repeat the previous close, so we left those 53 weekends out. Every result is prices only, before spread, swap, financing, commission and dividends.
The settings behind our numbers
No indicator runs here, because this is a plain price measurement. These choices shape the results.
| Parameter | Value in our test | Why it matters |
|---|---|---|
| Instruments | OANDA Dow, S&P 500 and Nasdaq 100 CFDs | Ordinary CFDs, not IG’s weekend market |
| Bar size | H1 | Fine enough to separate Friday’s last hour from Sunday’s first |
| Weekend | A break of 40 hours or more between two H1 bars | Finds each weekend without a calendar |
| Friday’s close | Close of the last H1 bar before the break | The gold dashed line on our charts |
| First price | Open of the first H1 bar after the break | The vertical dashed line on our charts |
| End of Monday | 16:00 New York | Matches the end of the NYSE core session |
| Back to Friday’s close | Any touch before that time | A generous test, because a wick counts |
| Big gap | Over 0.5% | Our own cut-off, not a market standard |
| Sample | 124 weekends from 23 June 2024 | The period where this feed shows real opens |
Reading the gap on a chart
Each capture marks the same things. The gold dashed line is Friday’s close, the vertical dashed line is the reopen, and the numbered tag matches the legend under the image. Ignore the price row and the sell and buy boxes at the top, because they show the live quote from capture day. The time axis shows UTC, so 16:00 New York sits at 20:00 on the axis during US summer time.
Then ask two questions. How far is the first candle from the gold line? And did price touch that line again before 16:00 New York on Monday?
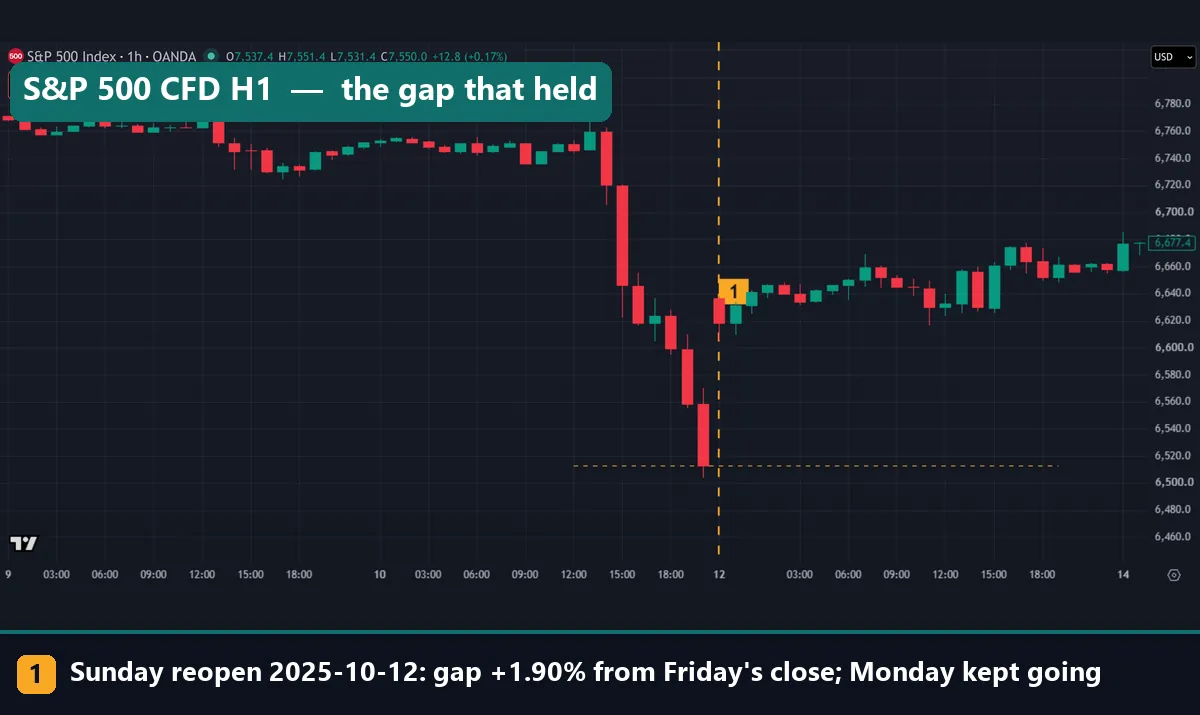
The S&P 500 CFD shows a gap that held. Price fell hard into the close on Friday 10 October 2025. It then reopened on 12 October at 6,636.7, up 1.90% from 6,513. Monday never came back to the line, and it ended at 6,661.2.
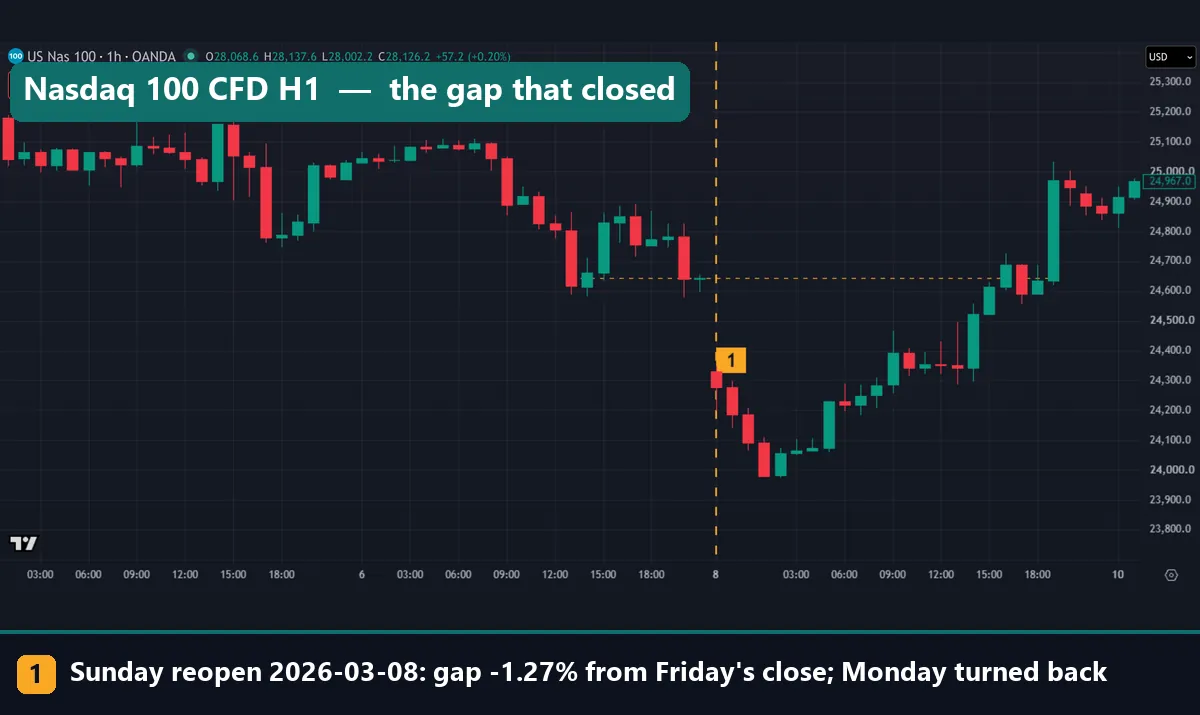
The Nasdaq 100 CFD shows the opposite. On 8 March 2026 it reopened at 24,332, down 1.27% from 24,645. At first it kept falling, to about 23,980 on the chart. Then it turned, crossed the line on Monday and ended at 24,971. So a clear gap alone did not tell us which outcome was coming.
Worked example: the April 2025 reopen
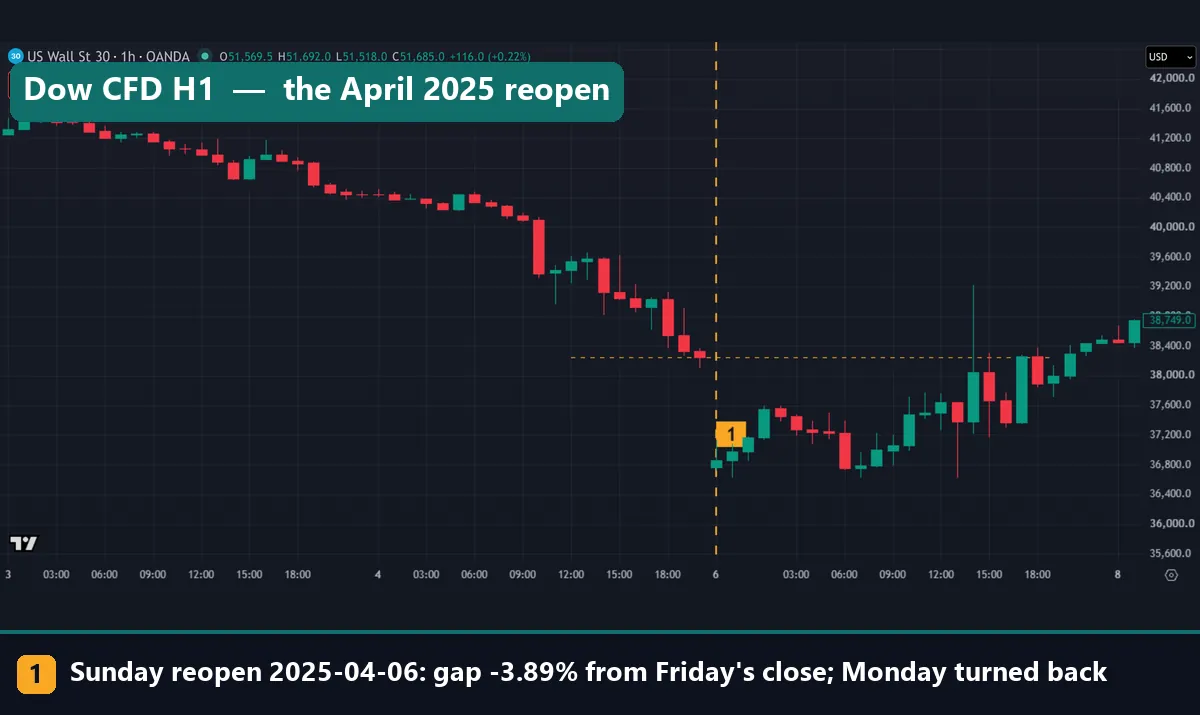
The largest gap in our file came on Sunday 6 April 2025. The Federal Reserve’s May 2025 FOMC minutes mention higher-than-expected tariffs announced on 2 April. They also call risky asset prices extremely volatile amid tariff-related developments. That is the context, but we did not separate how much of this one gap it explains.
| CFD | Friday’s close | First price | Gap | Monday 16:00 New York |
|---|---|---|---|---|
| Dow | 38,253 | 36,764.5 | -3.89% | 37,996 |
| S&P 500 | 5,068 | 4,835.2 | -4.59% | 5,069.8 |
| Nasdaq 100 | 17,364.8 | 16,548 | -4.70% | 17,434.2 |
Take the Dow line. Divide 36,764.5 by 38,253, subtract 1, and you get -3.89%, or 1,488.5 points. The feed printed nothing between those two prices, so a sell stop anywhere in that space could not fill at its level. The SEC’s Investor.gov entry on stop orders explains why: a triggered stop becomes a market order, and the fill may differ from the stop price in a fast market. That entry covers stocks, so your provider’s rules decide the details for a CFD.
All three touched Friday’s close by 16:00 New York. On the first chart, the Dow’s first touch came from an hourly wick to about 39,200. It then swung around the line and stood 257 points under it at 16:00. So the largest gap in our file did not stick.
The second largest went the other way. On 12 October 2025 the gaps were +1.50%, +1.90% and +2.32%, and none came back on Monday. We offer no cause for that one, because we did not confirm it from a primary source.
How big the gap usually is
Most weekends barely register. Across the 124 weekends, the median absolute gap was 0.12% on the Dow CFD, 0.127% on the S&P 500 CFD and 0.174% on the Nasdaq 100 CFD. Still, the tail is real.
| 124 weekends | Dow CFD | S&P 500 CFD | Nasdaq 100 CFD |
|---|---|---|---|
| Median absolute gap | 0.12% | 0.127% | 0.174% |
| Gap over 0.25% | 33.1% | 33.9% | 39.5% |
| Gap over 0.5% | 16.1% | 18.5% | 18.5% |
| Gap over 1% | 4.8% | 6.5% | 11.3% |
| All gaps: back to Friday’s close by Monday 16:00 | 83.9% | 78.2% | 74.2% |
| All gaps: Monday kept going from the reopen | 42.7% | 52.4% | 49.2% |
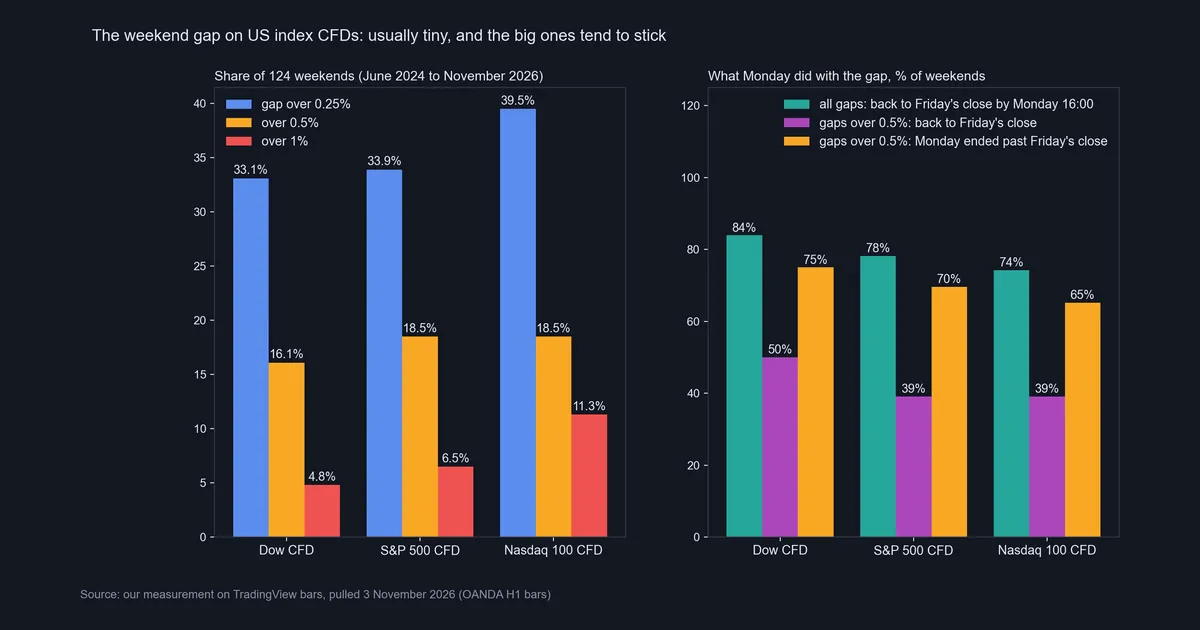
The left panel shows how rarely gaps grow large. The right panel holds the main result of this test: the teal bars for all gaps sit far above the purple bars for gaps over 0.5%. That chart rounds its right-hand labels to whole numbers.
What Monday did with the gap
Size changes the picture. Gaps under 0.5% came back to Friday’s close by Monday 16:00 in 90.4% (Dow), 87.1% (S&P) and 82.2% (Nasdaq) of cases. Gaps over 0.5% came back in only 50.0%, 39.1% and 39.1%. On those big gaps, Monday ended past Friday’s close, in the gap’s direction, in 75.0%, 69.6% and 65.2%. So small gaps tended to fade, and big ones tended to stick.
Two cautions apply. First, “back” only means a touch. Even after small gaps, Monday still ended past Friday’s close in the gap’s direction in 51.9%, 57.4% and 57.4% of cases. So a fill is not a reversal. Second, the big-gap samples hold just 20 to 23 cases, and they overlap. All three indices had a big gap on the same 19 weekends, which is closer to one small sample than three.
Sticking is also not the same as running on. Monday kept going from the reopen on 42.7%, 52.4% and 49.2% of all weekends, and on 45.0%, 47.8% and 47.8% of big gaps. So big gaps tended to stay past Friday’s close, without a clear push further.
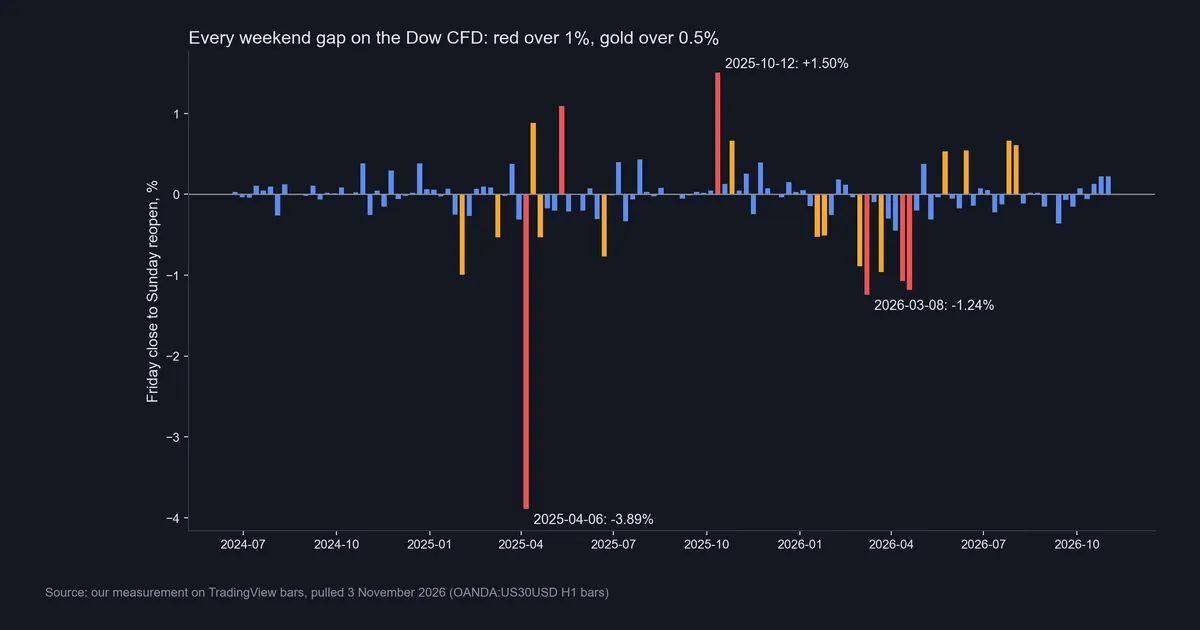
The big gaps also cluster. In our window, none of the Dow’s 20 came before 2025. Seven fell in the first half of 2025 and nine in the first half of 2026. So the quiet median describes a normal week, not those spells.
Download the complete indicator database
Put these concepts on your charts. One email unlocks the full library of 1,380+ indicators with compiled MT4 and MT5 files, plus my TradingView scripts. No paywall, no spam, unsubscribe any time.
Get free access to my indicator database
One email unlocks 1,380+ free MT4, MT5 and TradingView indicators — the complete library. No single-tool download; you get the whole database.
Where it fails
Start with the biggest hole: none of this tests Weekend Wall Street. We have no IG weekend prices. So we cannot say how that market behaves, how close it lands to the reopen, or whether it predicts Monday. Our CFD numbers describe the gap it tries to anticipate, and nothing more.
The gap figures have limits of their own:
- Short window. We have 124 weekends, and two six-month spells hold most of the Dow’s big gaps.
- Small samples. The big-gap results rest on 20 to 23 overlapping cases.
- A generous test. A one-hour wick counts as back to Friday’s close, even if price never stayed there.
- One feed. Another provider’s CFD can open at a different price, so its gap can differ.
- No costs. These are prices only. The first price may also not be one you could trade, because spreads widen in thin conditions.
We print no weekend spread or margin either. IG’s weekend page showed no such figure when we read it, and those costs should come only from the provider’s own pages.
Two weekends that break the pattern
Two more captures show why a tendency is not a rule.
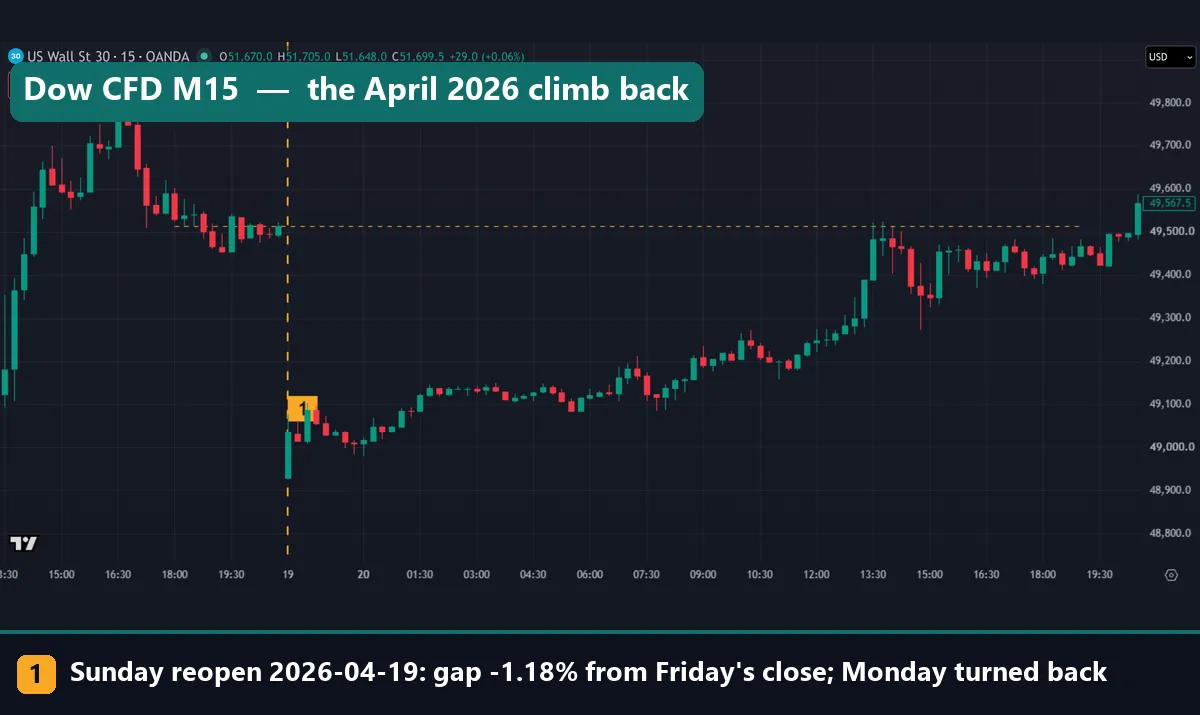
On 19 April 2026 the Dow CFD reopened at 48,928.2, down 1.18% from 49,514.5. Price reached the gold line in the 13:30 candle on the axis, which was 09:30 in New York, the start of the NYSE core session. It ended at 49,495.6, just under the line. Yet the S&P and Nasdaq gaps that weekend, -1.10% and -1.13%, did not get back on Monday. One weekend proves no rule.
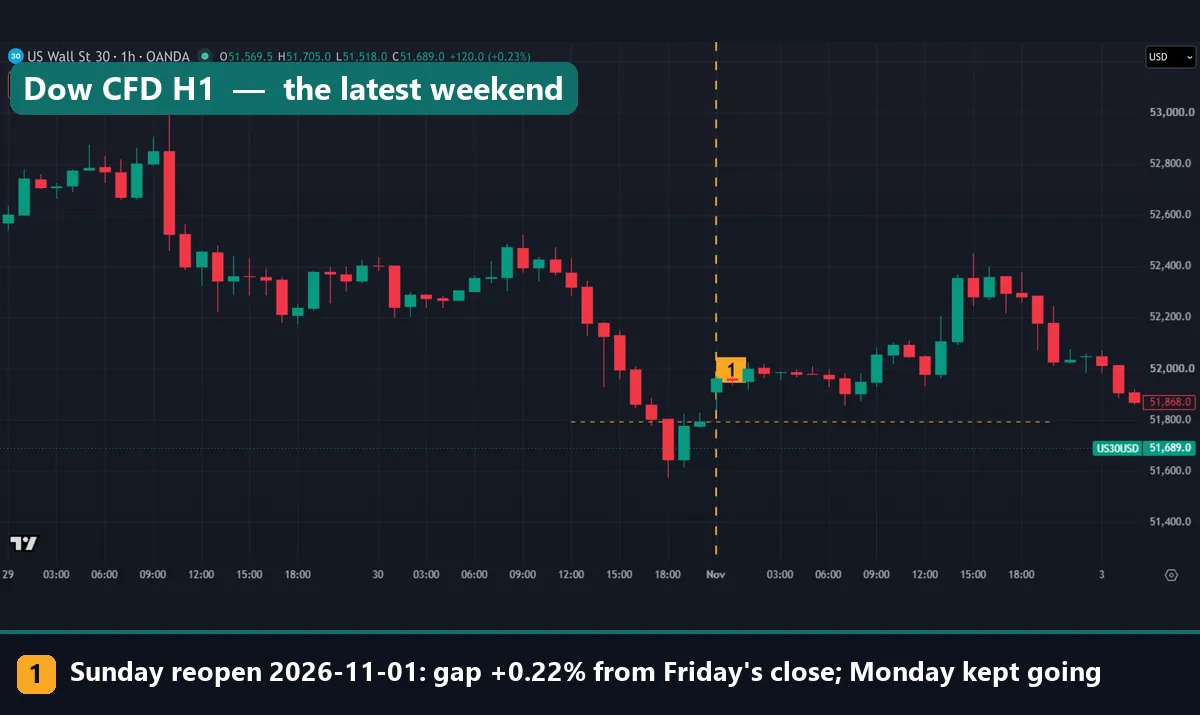
The latest weekend in our file was small: +0.22% on the Dow, from 51,795 to 51,909.5. Small gaps usually came back, yet this one stayed open and Monday ended at 52,028. The S&P’s +0.29% and the Nasdaq’s +0.39% went the other way. Both fell back through Friday’s close and ended below it, at 7,552.2 and 28,026. So one weekend gave two different answers. New York left summer time that day, so 16:00 there sits at 21:00 on this axis.
Common mistakes
- Reading the weekend quote as a Monday forecast. We did not test that, and CFD data cannot. So treat it as one firm’s estimate.
- Assuming every gap fills. The all-gaps figure hides the split. Over 0.5%, only half or fewer came back on Monday, and a touch is not a reversal.
- Trusting a stop across the weekend. A stop does not fill at its level when the market jumps past it. So plan around the gap as well as the stop distance, and let that shape your position size.
- Trusting gap data you have not opened. An hourly feed can repeat the previous close as its open, and that hides every gap. So check the raw bars before you count anything. Our list of backtesting mistakes covers this kind of data trap.
Where to go next
For the Dow itself, read our guide to Dow Jones futures on TradingView. For the tech side, see Nasdaq 100 futures on TradingView. Our guide to pre market trading covers the next window where index prices move without the cash market.
FAQ about Weekend Wall Street
What is Weekend Wall Street?
It is IG’s weekend market based on its Wall Street product, a Dow market. IG quotes it separately from the weekday market, using market conditions, client activity and news flow.
Is Weekend Wall Street the same as the Dow Jones?
No. The Dow is an index, and the NYSE does not trade at the weekend. Weekend Wall Street is one provider’s price, built partly from its clients’ activity.
When does Weekend Wall Street trade?
IG’s UK page says weekend index trading ends at 10.40pm on Sunday, UK time, and the weekday market returns at 11pm. It lists both 10pm on Friday and 8am on Saturday as start times, so check the page.
Does the weekend price predict Monday?
We cannot say. We have no IG weekend prices, so we never tested it. Our data covers the gap on ordinary CFDs, not the weekend quote itself.
How big is a normal weekend gap on US indices?
Across our 124 weekends, the median absolute gap was 0.12% on the Dow CFD, 0.127% on the S&P 500 CFD and 0.174% on the Nasdaq 100 CFD. However, gaps over 1% came on 4.8%, 6.5% and 11.3% of weekends.
Do weekend gaps always fill?
No. All gaps touched Friday’s close by Monday 16:00 New York on 83.9%, 78.2% and 74.2% of weekends. For gaps over 0.5%, that fell to 50.0%, 39.1% and 39.1%, on just 20 to 23 cases.
Does Monday keep going in the direction of the gap?
About half the time. Monday kept going from the reopen on 42.7%, 52.4% and 49.2% of weekends, and on 45.0%, 47.8% and 47.8% of gaps over 0.5%. So the gap’s direction alone told us little.
Can I use these numbers as a trading rule?
No. The window is short, the big-gap samples are small and overlapping, and every figure excludes costs. Use them to think about weekend risk, and remember that results are not guaranteed; past performance is not indicative of future results.
Last updated: 3 November 2026.

About the author
Written by Dominic Walsh, a Forex trader and MT4/MT5 indicator, Expert Advisor and script developer. Every tool on forexmt4systems.com is tested on live charts before release and ships with ready-to-use compiled MT4 (.ex4) and MT5 (.ex5) files. Learn more about the trader and developer behind this site.
How we build, test and correct every tool: Editorial & Testing Policy. Trading carries risk; see the disclaimer.