
The ascending triangle pattern is taught as a bullish setup: a flat top, rising lows, then a break upward. This guide settles how often that really happens, using counted cases instead of opinion. We ran one fixed rule over 23 forex pairs and found 82 daily patterns. Only 47.6% of them broke upward first, which is close to a coin flip. Our older pages explain the types of triangle pattern and the rising wedge versus ascending triangle difference. This is the measured one.
What an ascending triangle pattern is
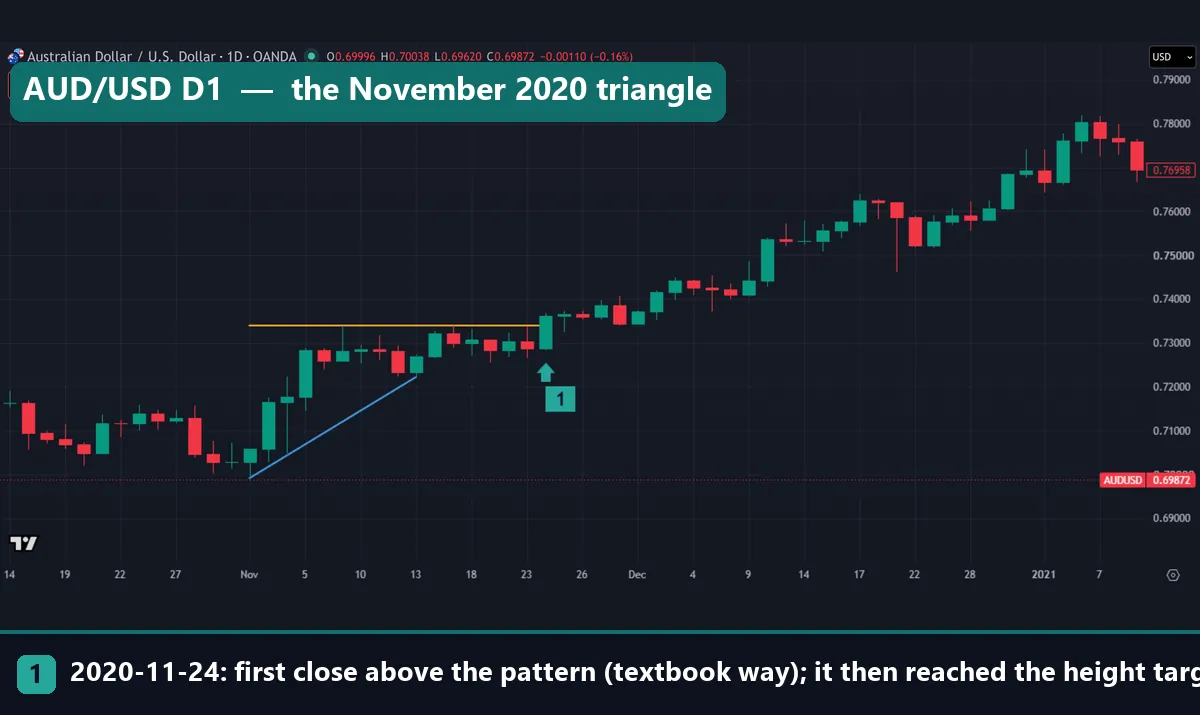
An ascending triangle has two edges. The top edge is flat, because price stalls near one level at least twice. The bottom edge slopes up, because each pullback stops higher than the last. So the range narrows toward the flat top. In the AUD/USD chart above, the gold line marks the flat top and the blue line marks the rising lows.
StockCharts ChartSchool’s ascending triangle page gives the textbook view. It calls this a bullish formation that usually appears as a continuation pattern in an uptrend, with “a definitive bullish bias” before the break. It asks for at least two reaction highs and two rising reaction lows. In plain terms, the top edge is a horizontal level, so the idea builds on support and resistance.
How the pattern is supposed to work
The usual story has two sides. Sellers defend one price, so the top stays flat. Meanwhile, buyers step in earlier on each dip, so the lows rise. Then the sellers run out and price closes above the level. That story is neat, but no chart shows who sits behind each bar.
The target comes from a simple measure. Here is our version for a break upward:
height = flat top - first rising low
target = break close + height
failure level = last rising low
A break downward mirrors it: the target sits one height below the break close, and the failure level is the flat top. This is the logic behind all measured move targets. Still, authors differ on the details. ChartSchool applies the widest distance to the breakout level. Thomas Bulkowski’s ascending triangle page on The Pattern Site multiplies the height by a published percentage first. We use the full height from the break close, because anyone can check a close.
How we tested this pattern
We found every pattern with code, under one fixed rule, so nobody picked them by eye. The daily test covers 23 forex pairs on MetaTrader 4, build 1471, using Capital Point Trading history. Dates vary by pair: the widest window runs from 12 June 2018 to 24 August 2026. That terminal has been offline since late August 2026, so no window runs later. The hourly test is far shorter: EUR/USD, GBP/USD and USD/JPY from 22 December 2025 to August 2026, plus gold from 1 July 2025 to 20 August 2026.
The price charts come from the TradingView web chart on OANDA daily bars, with the same rule applied to that feed. We picked them to show each outcome, so they illustrate the count and do not belong to it. NZD/USD, for example, is not one of the 23 MT4 pairs. We also checked every quoted price against our stored OANDA bars. Every result is before spread, swap, financing and commission. Our editorial testing policy explains how we run tests like this.
The rule we used, parameter by parameter
A triangle is a loose idea, so any test must first pin it down. ATR means average true range, which shows how far a market usually moves in one bar. The MetaTrader 4 help page on Average True Range defines it, and our guide on what ATR is in trading explains it simply.
| Parameter | Our setting | What it does |
|---|---|---|
| Swing point | 3 bars either side | Needs three later bars to confirm |
| Flat top | Swing highs within 0.35 ATR(14) of one level | Allows near misses |
| Touch spacing | At least 5 bars apart | One cluster is not two touches |
| Look-back | 40 bars | Keeps old swings out |
| Rising lows | 2 or more, up at least 0.5 ATR overall | Rejects flat ranges |
| Height | 1.5 to 10 ATR | Rejects extreme shapes |
| Break | First close above the top or below the last swing low | Ignores wicks |
| Target | One height from the break close | The measured goal |
| Failure level | The other side of the pattern | Last low or flat top |
| Time limit | 40 bars | Then it counts as “neither” |
| Tie in one bar | Failure counts first | Doubt goes against the pattern |
The median height came out at 4.0 ATR on daily bars and 5.05 ATR on hourly bars. This is our rule and one reading only. Bulkowski, for instance, wants at least three touches on one line and two on the other. A different rule would find different patterns and different counts.
Reading it on a chart
Start with the top. Mark two or more highs that sit close together, then look for higher lows beneath them. Next, wait for a close beyond one side, because a wick proves nothing under this rule. Note one detail in our pictures: the blue line stops at the last low. So a break downward means a close below that low’s price, not below a line extended to the right.
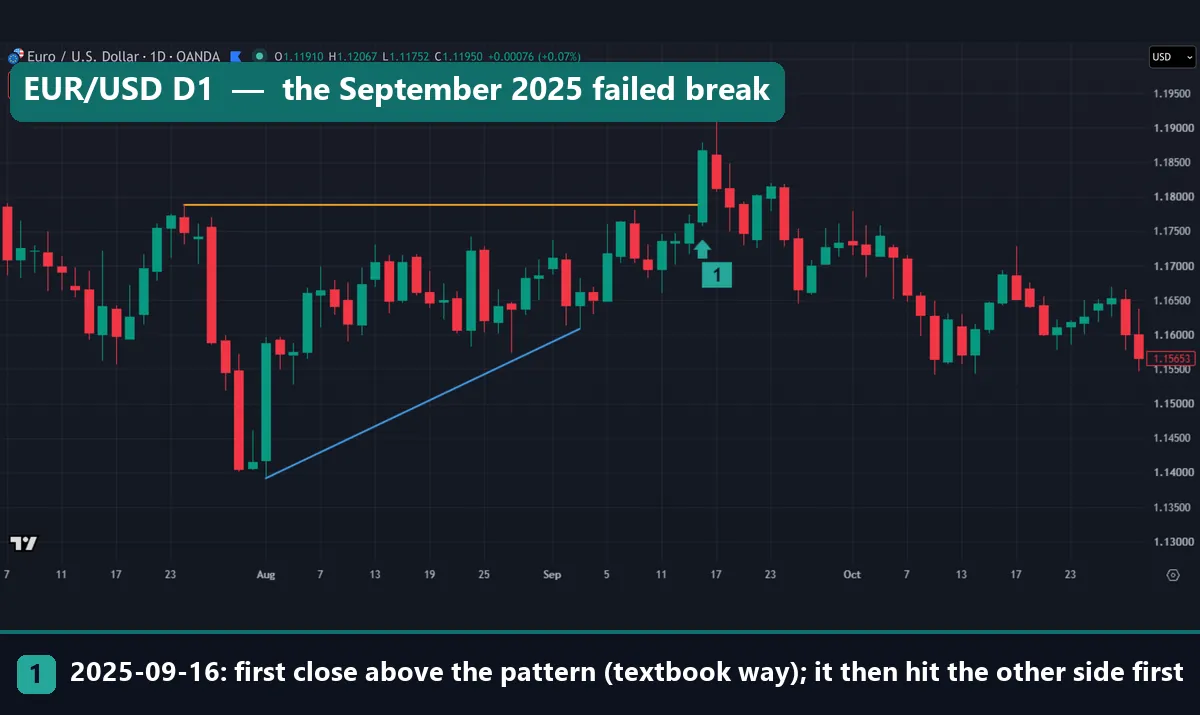
EUR/USD looked clean at first. Its flat top sat at 1.17888, and the lows rose from 1.13916 to 1.16082. The first close above came on 16 September 2025, at 1.18668. The next day’s high was 1.19188, but then price slid back. On 8 October the low reached 1.15984, through the failure level of 1.16082. So our rule scores this as “hit the other side first”, with the 1.22640 target never touched.
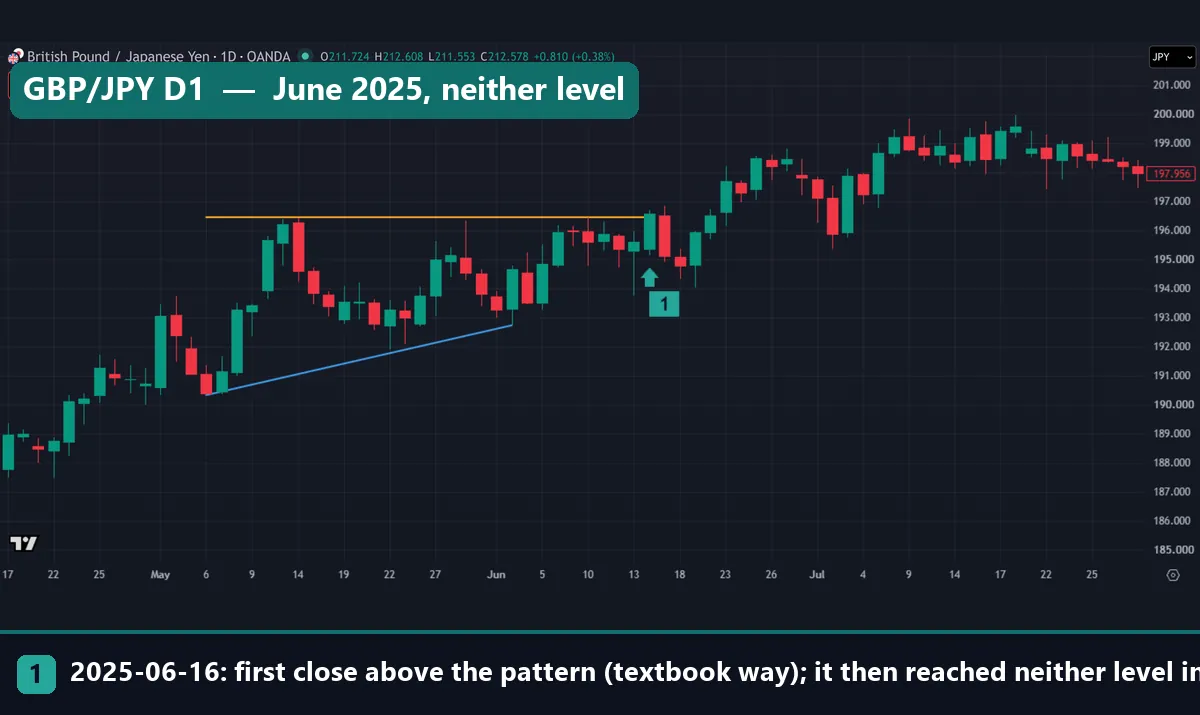
GBP/JPY shows the third outcome. Its flat top sat at 196.45, and the lows rose from 190.33 to 192.73. The first close above came on 16 June 2025, at 196.566. That set the target at 202.686 and the failure level at 192.73. Over the next 40 bars price ranged from 194.022 to 199.976, so it touched neither. Even so, it stood above the break close 10 bars later, at 197.814.
Worked example: AUD/USD in November 2020
Here is the first chart, AUD/USD daily, step by step.
- Flat top: 0.73400, the high of 9 November 2020. Price came back to 0.73398 on 17 November.
- Rising lows: 0.69912 on 2 November, then 0.72217 on 13 November.
- Height: 0.73400 minus 0.69912 gives 0.03488.
- Break: the first close above the top came on 24 November, at 0.73612.
- Target: 0.73612 plus 0.03488 gives 0.77100.
- Failure level: the last low, 0.72217, which sat 0.01395 below the break close.
Price never returned to the failure level, and its lowest point in the next 40 bars was 0.73252. Then, on 31 December 2020, 26 bars after the break, the high reached 0.77422. That passed the target, so this one scores “target first”.
Why the target is the harder line to reach
The target sat 0.03488 away, but the failure level sat only 0.01395 away, so the target was 2.5 times as far. Most patterns under this rule share that shape, because the last low sits above the first low. And a market with no direction at all reaches the nearer line more often.
So a target-first share under 50% does not condemn the pattern on its own. Instead, you have to weigh how often against how far, which is the job of a good risk reward ratio and of trading expectancy. We did not measure profit here, only which line came first.
What all 82 daily patterns did
One example proves little, so here is the full count. Of 82 daily patterns, 47.6% closed above the top first, while the rest closed below the last low first. On hourly bars, 54.3% of 46 patterns broke upward. Neither figure stands far from a coin flip. For contrast, Bulkowski reports upward breakouts 63% of the time, with a stricter rule and with stocks in his examples. So the two counts differ, but they do not measure the same thing.
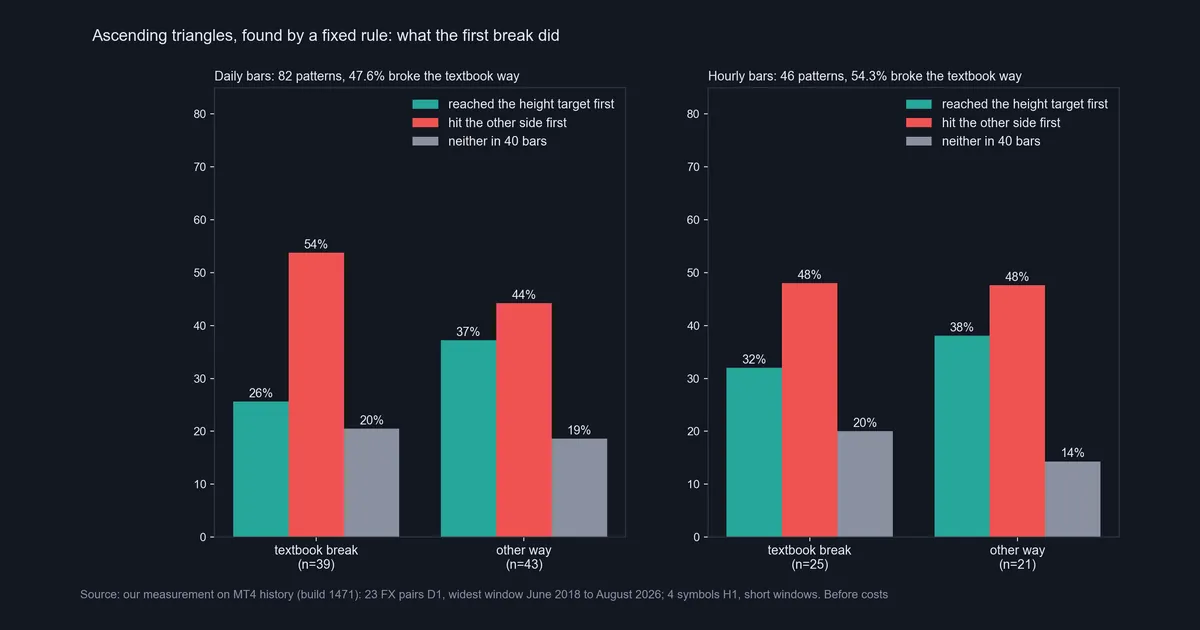
Next, see what followed the 39 daily textbook breaks. The height target came first 25.6% of the time, and the other side came first 53.8% of the time. Neither came within 40 bars in 20.5% of cases. Price stood further on 10 bars later in 46.2% of them. The 43 breaks the other way looked no worse: target first 37.2%, other side first 44.2%, neither 18.6%, further on 41.9%.
Hourly bars tell a similar story on a smaller sample. Of 25 textbook breaks, 32.0% reached the target first and 48.0% hit the other side first. Of 21 breaks the other way, the figures were 38.1% and 47.6%.
Beside the descending triangle, and the fair reading
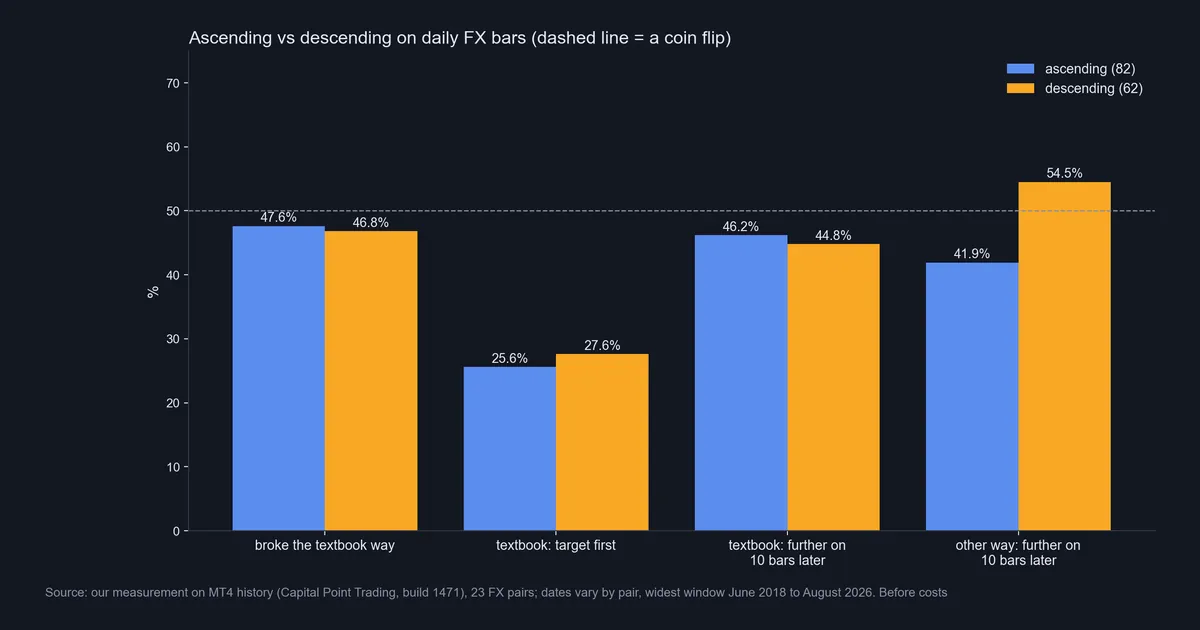
This chart puts the shape beside its mirror image, the descending triangle, on the same daily data. That test found 62 patterns, and 46.8% broke the textbook way, which for that shape means down. So both triangles missed their textbook direction about as often as they met it.
Here is the fair reading. On this rule and this data, a flat top and rising lows told us little about direction. However, that is not proof the pattern is useless, because 82 is a small sample. The NIST handbook section on confidence intervals for proportions shows how to work out the likely range around a share like this, and on so few cases that range is wide. Our page on backtest sample size covers the same problem.
Download the complete indicator database
Put these concepts on your charts. One email unlocks the full library of 1,380+ indicators with compiled MT4 and MT5 files, plus my TradingView scripts. No paywall, no spam, unsubscribe any time.
Get free access to my indicator database
One email unlocks 1,380+ free MT4, MT5 and TradingView indicators — the complete library. No single-tool download; you get the whole database.
Where it fails
The biggest weakness is the direction call. The shape says up, yet on daily bars the first close beyond the pattern went down more than half the time. If the shape is your whole reason for a trade, that is not much of a reason.
- Drawing is a judgment call. Change the tolerance or the swing length and a different set of patterns appears.
- It looks finished only afterwards. Until a close lands beyond one side, nobody knows which way it goes.
- We ran no volume test. Textbook versions add falling volume, but MT4 forex history carries tick volume only, so we left it out.
- The data is small and narrow. The daily test is forex only, and the hourly test has just 46 patterns. So a stock trader cannot carry these figures across.
- Costs are missing. A trade held for up to 40 daily bars carries swap as well as spread, and our figures include neither.
Failed breaks affect chart patterns in general, and our page on chart pattern failure covers that wider problem.
Two breaks against the textbook
The next two charts show why the direction call matters. Both patterns broke down, and both then reached their height target.
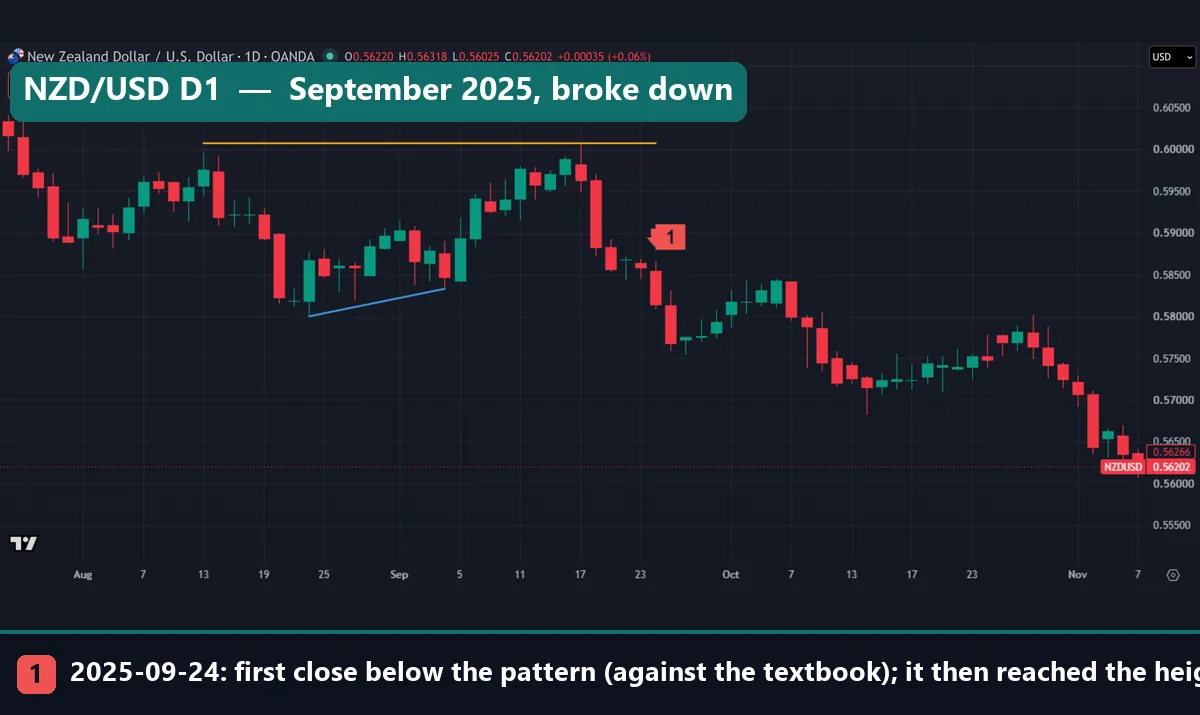
On NZD/USD the flat top sat at 0.60076, and the lows rose from 0.58000 to 0.58330. Price tagged the top on 17 September 2025 and then fell hard. On 24 September it closed at 0.58139, below the last low. That set the target at 0.56063, and on 7 November the low touched 0.56062. That is one tenth of a pip past the line, so another broker’s feed could score it differently.
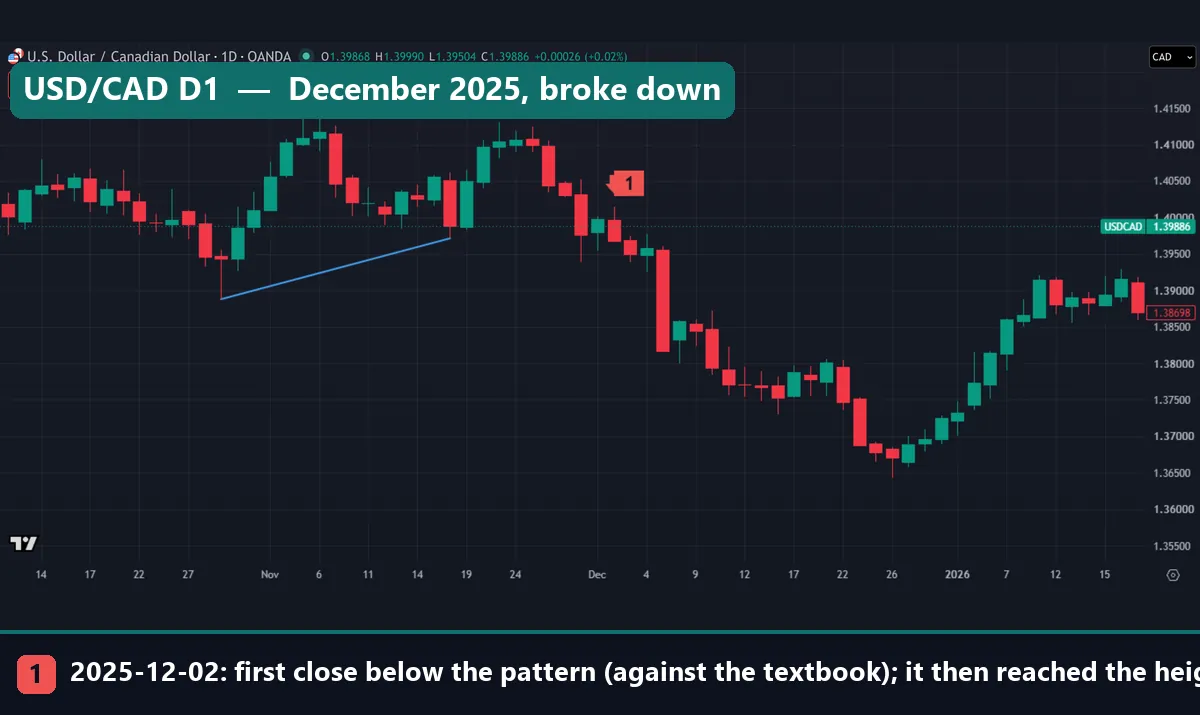
USD/CAD tells the same tale. Here the flat top sat at 1.41408, and the lows rose from 1.38880 to 1.39715. On 28 November 2025 a wick dipped to 1.39384, but the bar closed back above the last low at 1.39761, so the rule ignored it. The real break came on 2 December, with a close at 1.39677. Then price passed the 1.37149 target on 23 December, 15 bars later.
Four common mistakes
- Buying before the break. Rising lows tempt people to act early, but our first closes split almost evenly between the two sides. Waiting removes that guess, although it does not make the break reliable.
- Counting a wick as a break. The USD/CAD wick on 28 November pierced the line and then closed back above it. A wick rule would have called that break two bars early.
- Treating the target as a forecast. On daily textbook breaks it came first only 25.6% of the time, and EUR/USD never got there.
- Ignoring the other side. A pattern needs a level that says you were wrong. Our guide on how to use a stop loss covers the practice.
Where to go next
For the wider family of shapes, go to triangle pattern types, because this guide only counts one member. Flags are the other common pause shape, so compare the bull flag pattern and the bearish flag pattern. Their edges run parallel, whereas a triangle’s edges converge. For the trade after a level breaks, our break and retest strategy guide shows one common approach.
FAQ: ascending triangle pattern questions
Is an ascending triangle pattern bullish?
Textbooks call it bullish, but only 47.6% of our 82 daily forex patterns broke upward first, so the shape gave no clear lean.
How do you calculate the ascending triangle target?
Subtract the first rising low from the flat top to get the height, then add it to the break close, so in our AUD/USD example 0.03488 added to 0.73612 gave 0.77100.
How many touches does the pattern need?
Our rule and ChartSchool both ask for at least two highs and two rising lows, while Bulkowski wants three touches on one line and two on the other.
What is the difference between an ascending triangle and a rising wedge?
An ascending triangle has a flat top, whereas a rising wedge has two edges that both slope up, as our rising wedge comparison shows.
Which timeframe suits it best?
We cannot rank them, because 82 daily and 46 hourly patterns are too few to separate 47.6% and 54.3% from a coin flip.
What happens if it breaks down instead?
Treat that as a normal outcome, because it was the more common first break on daily bars, and 37.2% of those 43 breaks reached a target one height lower first.
Where does the failure level go?
We used the last rising low after an upward break and the flat top after a downward one, but that is a measuring level and not trading advice.
Can I trade on this pattern alone?
We would not, because our test found no reliable direction and measured no profit, so size any trade so a failed break is affordable, and remember that results are not guaranteed; past performance is not indicative of future results.
Last updated: 3 November 2026.

About the author
Written by Dominic Walsh, a Forex trader and MT4/MT5 indicator, Expert Advisor and script developer. Every tool on forexmt4systems.com is tested on live charts before release and ships with ready-to-use compiled MT4 (.ex4) and MT5 (.ex5) files. Learn more about the trader and developer behind this site.
How we build, test and correct every tool: Editorial & Testing Policy. Trading carries risk; see the disclaimer.