
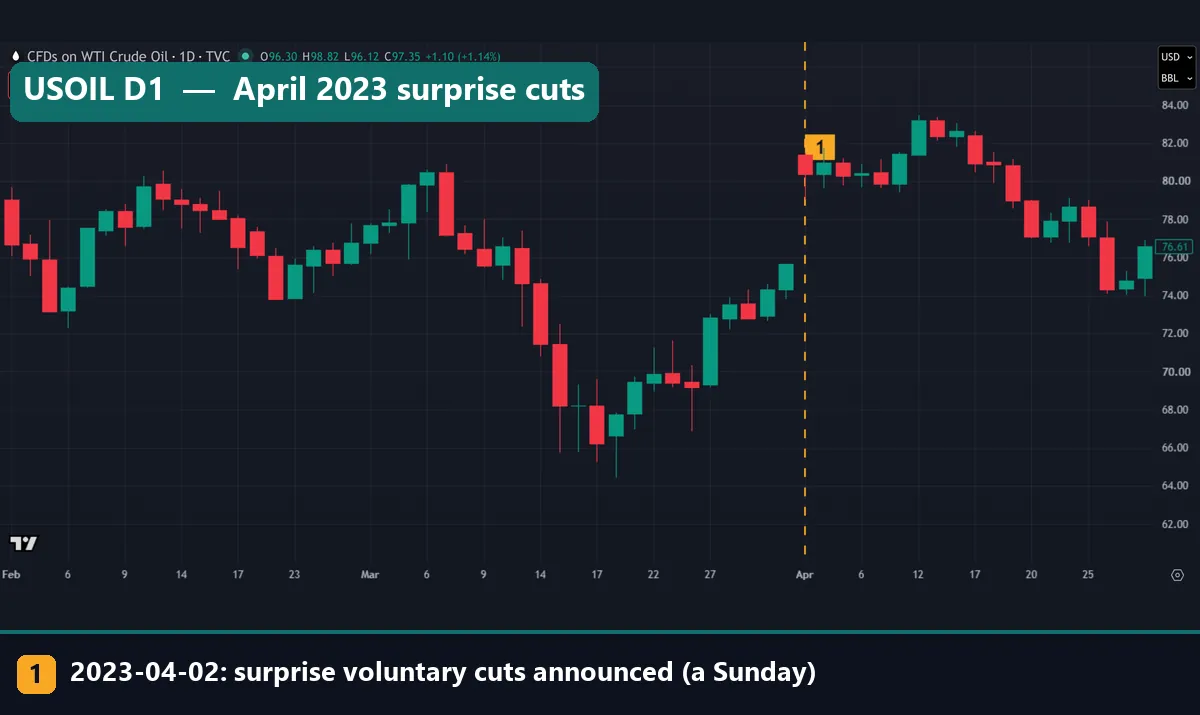
OPEC is the group of oil exporters whose output decisions sit behind many sharp moves on an oil chart. This article settles what it is and what its headlines did to the price. We marked eight well known decisions on TVC:USOIL, then measured the first bar and the next 5 and 20 trading days. The list is hand-picked, so it illustrates and does not prove. Still, the first bar was often large, but a cut did not settle the direction. For example, the surprise cut of April 2023 opened with a 7.6% gap, yet USOIL stood 11.1% lower 20 trading days later.
What OPEC is, and how OPEC+ differs
OPEC stands for the Organization of the Petroleum Exporting Countries. The OPEC entry on Wikipedia says Iran, Iraq, Kuwait, Saudi Arabia and Venezuela founded it in Baghdad on 14 September 1960. It moved to Vienna in 1965. The entry also notes that economists often cite it as a textbook cartel, meaning producers who cooperate to reduce competition.
Membership changes, so check the date on any list you read. That entry now counts 11 members: Algeria, the Republic of the Congo, Equatorial Guinea, Gabon, Iran, Iraq, Kuwait, Libya, Nigeria, Saudi Arabia and Venezuela. Angola, Ecuador, Indonesia, Qatar and the United Arab Emirates are former members. In fact, the UAE left both OPEC and OPEC+ with effect from 1 May 2026. The entry puts OPEC at 38 percent of global oil production in 2022, when the UAE was still inside, plus an estimated 79.5 percent of proven reserves.
OPEC+ is the wider group. It formed in late 2016 and adds non-members such as Russia, Kazakhstan, Mexico and Oman. Recent decisions can be narrower still. For example, OPEC’s statement of 3 April 2025 comes from just eight countries: Saudi Arabia, Russia, Iraq, the UAE, Kuwait, Kazakhstan, Algeria and Oman. So read who signed before you read the number.
How an OPEC decision reaches the oil price
OPEC itself has no formula. Instead, the mechanism is a chain of steps, and any link can break.
- Ministers set a limit. The OPEC Conference meets at least twice a year and generally works on unanimity, with one vote per member. Wikipedia also describes Saudi Arabia as the de facto leader, because of its capacity.
- Countries promise output. A target is a limit on paper. OPEC’s 2025 statement shows the gap, because the eight confirm they intend to compensate for overproduced volume since January 2024.
- Traders price the news at once. The move arrives in the next session, or as a gap if the news lands at a weekend.
- Everyone else responds. Demand shifts, and producers outside the group can add barrels.
Spare capacity sits behind all of this. The entry quotes the EIA’s definition: output that can be brought on within 30 days and sustained for at least 90 days. A group holding spare barrels can add supply quickly, so a plan to add output can move price too. The April 2025 decision on our list was exactly that. It set 411 thousand barrels per day for May 2025, or three monthly steps in one.
How we tested
We used one symbol, TVC:USOIL, which TradingView labels CFDs on WTI Crude Oil. The timeframe was D1 on the TradingView web chart, and we pulled the bars on 3 November 2026. Our marks run from 27 November 2014 to 3 April 2025. Each price chart shows 60 daily bars and stops 25 calendar days after the first bar, so the 20-day mark falls just past the right edge. Our editorial testing policy sets out how we gather and label data.
The eight decisions are hand-picked, not a full record of OPEC meetings, and this is not a statistical test. Every figure is a price change only, before spread, swap, financing and commission. Also, our linked sources confirm each decision, some to the day and others to the month, while the exact dates come from our event list. For what the symbol is and is not, read our USOIL guide.
The settings behind our numbers
OPEC has no settings, but our measurement does. So every figure below uses these rules, and you can rebuild them on a TradingView oil chart.
| Parameter | Value | Why it matters |
|---|---|---|
| Symbol and timeframe | TVC:USOIL, D1 | One reference line for all eight |
| First bar | First daily bar on or after the event date | Two decisions fell on a Sunday |
| First-bar change | close / previous close - 1 | Includes any gap |
| Gap | open / previous close - 1 | Shows the move before the session began |
| Range | (high - low) / close | Leaves out the gap |
| Normal range | Median range of the previous 60 days | Scales each day against its own period |
| Follow-through | close N days later / first-bar close - 1, N = 5 and 20 trading days | Shows whether the first move lasted |
| Left out | 5-day figure for 13 April 2020 | It lands on TradingView’s 0.009 print of 20 April 2020 |
Reading an OPEC decision on a chart
Start with the dashed line. It marks the first bar we counted, and the strip under each image names the event. Next, ignore the header row, the SELL and BUY boxes and any green USOIL tag, because they show the live quote from capture day. Then ask three questions. Did the bar gap? How wide was the range? And what happened after?
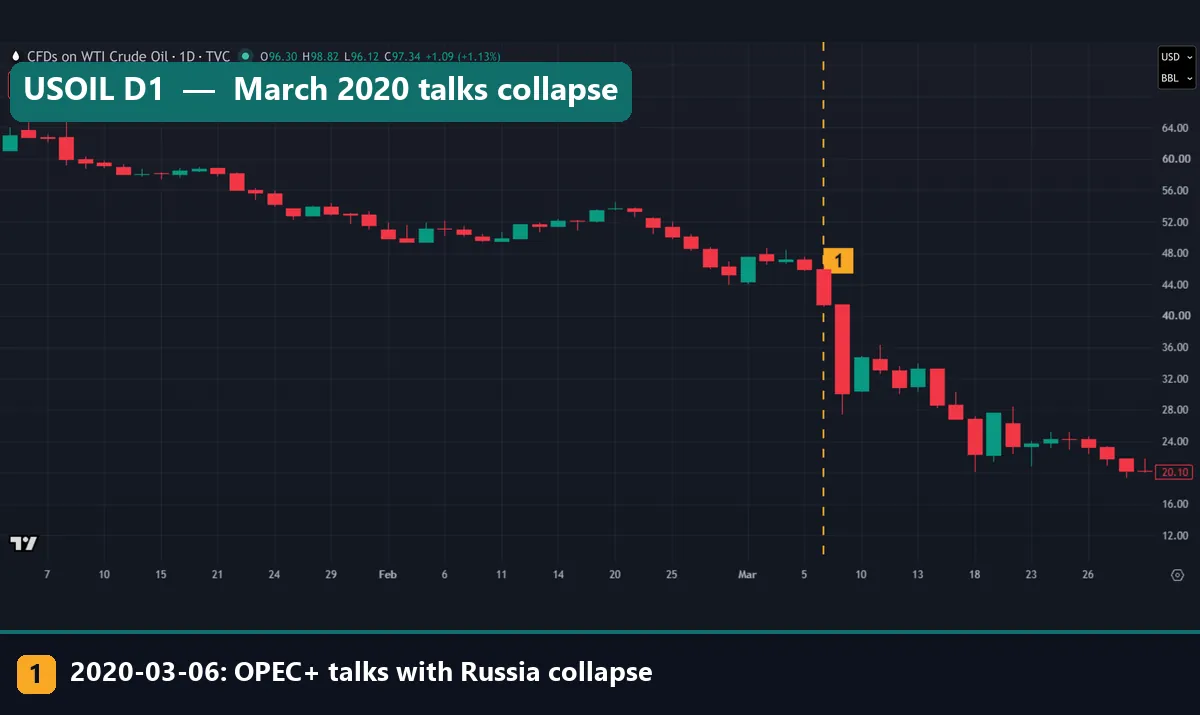
This chart shows 6 March 2020, when OPEC+ talks with Russia collapsed. Wikipedia says Russia rejected a demand for deeper cuts, which ended a three-year partnership. On that first bar, USOIL fell 9.7%, with no gap and a 12.7% range against a 2.4% median. However, the next bar did more damage, down 27.3% on 9 March. That is the worst day in our data from 2015 on, setting aside the 0.009 print. From the 6 March close, USOIL was 19.9% lower after 5 trading days and 30.6% lower after 20. Still, this was not OPEC alone, because the entry also names weak demand during COVID-19.
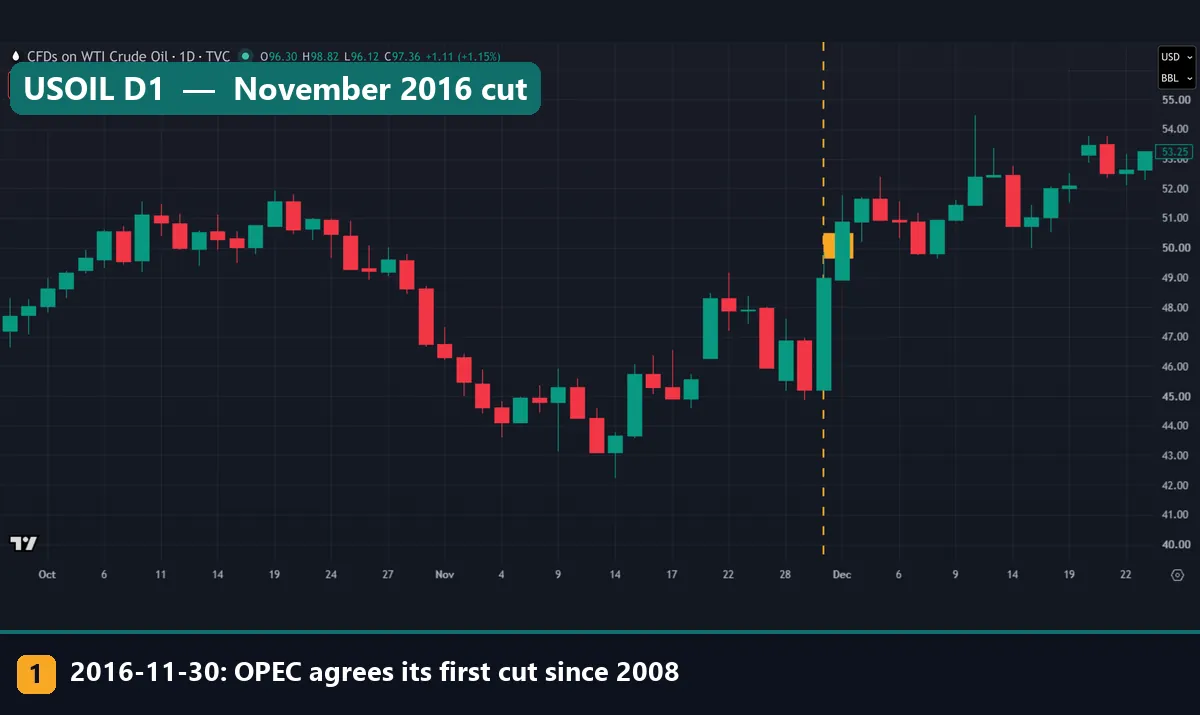
Now the opposite case. The entry calls the November 2016 deal OPEC’s first production cut since 2008, at about one million barrels per day. USOIL rose 8.3% on 30 November with no gap, and its 9.5% range was over three times the 2.9% median. Here the move lasted: up 1.7% after 5 trading days and 9.9% after 20. In this capture the orange marker box sits behind the candles, so follow the dashed line instead.
Worked example: the surprise cut of April 2023
Go back to the first chart. On Sunday 2 April 2023, OPEC+ producers announced surprise voluntary cuts. The IEA’s Oil Market Report for April 2023 sizes those curbs at 1.16 million barrels a day. It also says they triggered an immediate $7 a barrel jump in North Sea Dated crude. That is a different benchmark, so our USOIL numbers differ.
- Close before the news: about 75.62, which is 80.385 / 1.063.
- Open on 3 April: about 81.37, a gap of +7.6%.
- Close on 3 April: 80.385, a change of +6.3%. The candle is red because the bar gave back part of the gap.
- Range that day: 3.1%, level with the 60-day median of 3.1%.
- 5 trading days later: +1.3%.
- Last bar in the capture: 76.61.
- 20 trading days later: -11.1%, or about 71.46, which is 80.385 x 0.889.
So by the 20-day mark the whole gap had gone, and price stood below the pre-news close of 75.62. A reader who saw only “OPEC+ cuts output” would have expected the opposite. The gap carries its own lesson too. A stop on a short position set inside that 7.6% jump was passed, not filled at its level. So our guide to weekend gaps matters for any Sunday meeting. This is one event on one symbol, not a trade plan.
All eight OPEC decisions in one table
Here is the full list, using the rules in the settings table.
| First bar | Decision | Change | Gap | Range | 60-day median | +5 days | +20 days |
|---|---|---|---|---|---|---|---|
| 27 Nov 2014 | OPEC keeps output unchanged in Vienna | -10.3% | -6.4% | 5.6% | 2.2% | -0.5% | -18.6% |
| 30 Nov 2016 | OPEC agrees its first cut since 2008 | +8.3% | 0.0% | 9.5% | 2.9% | +1.7% | +9.9% |
| 6 Mar 2020 | OPEC+ talks with Russia collapse | -9.7% | 0.0% | 12.7% | 2.4% | -19.9% | -30.6% |
| 13 Apr 2020 | OPEC+ agrees a 9.7 million barrel a day cut (12 April, a Sunday) | -3.5% | 0.0% | 11.1% | 4.6% | left out | +13.6% |
| 5 Oct 2022 | OPEC+ agrees a 2 million barrel a day cut | +2.0% | 0.0% | 3.3% | 4.4% | -1.2% | +1.5% |
| 3 Apr 2023 | Surprise voluntary cuts (2 April, a Sunday) | +6.3% | +7.6% | 3.1% | 3.1% | +1.3% | -11.1% |
| 30 Nov 2023 | Further voluntary cuts | -2.7% | +0.1% | 5.9% | 2.9% | -7.9% | -5.7% |
| 3 Apr 2025 | Eight OPEC+ members speed up output increases | -5.8% | -0.7% | 6.5% | 2.2% | -9.6% | -12.3% |
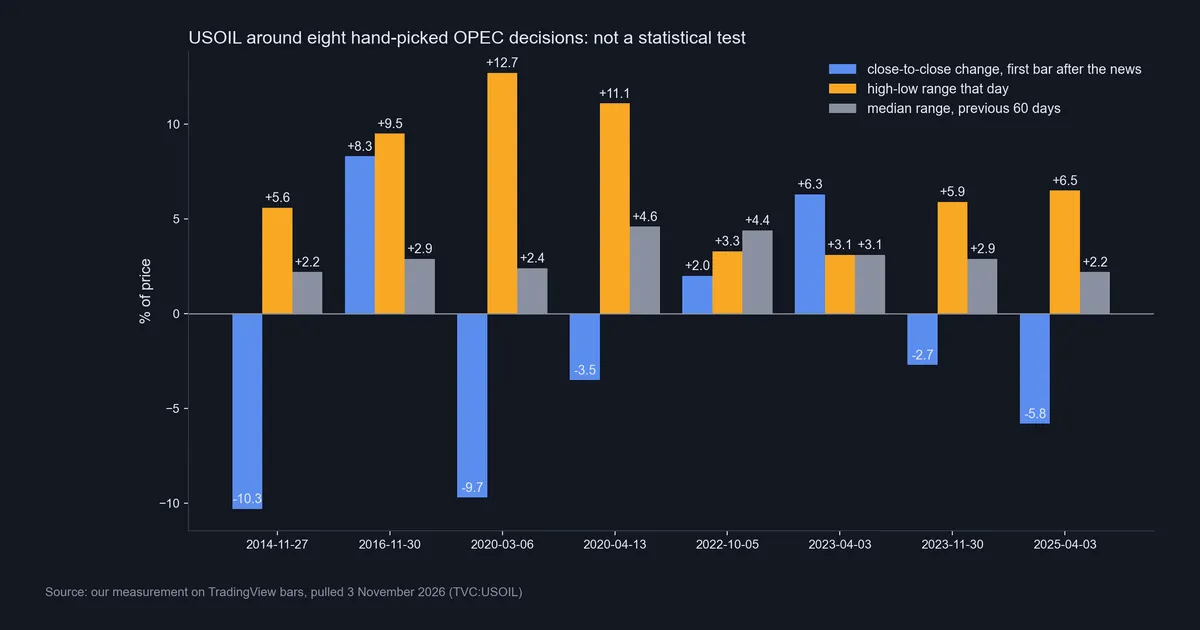
This chart is our own measurement of the first bar. Six of the eight ranges beat the 60-day median, so decision days were usually busy. October 2022 came in under it, at 3.3% against 4.4%. April 2023 tied at 3.1%, since most of that move sat in the gap. Direction was another matter, because three first bars rose and five fell. Of the five cuts, three rose and two fell.
What happened after the headline
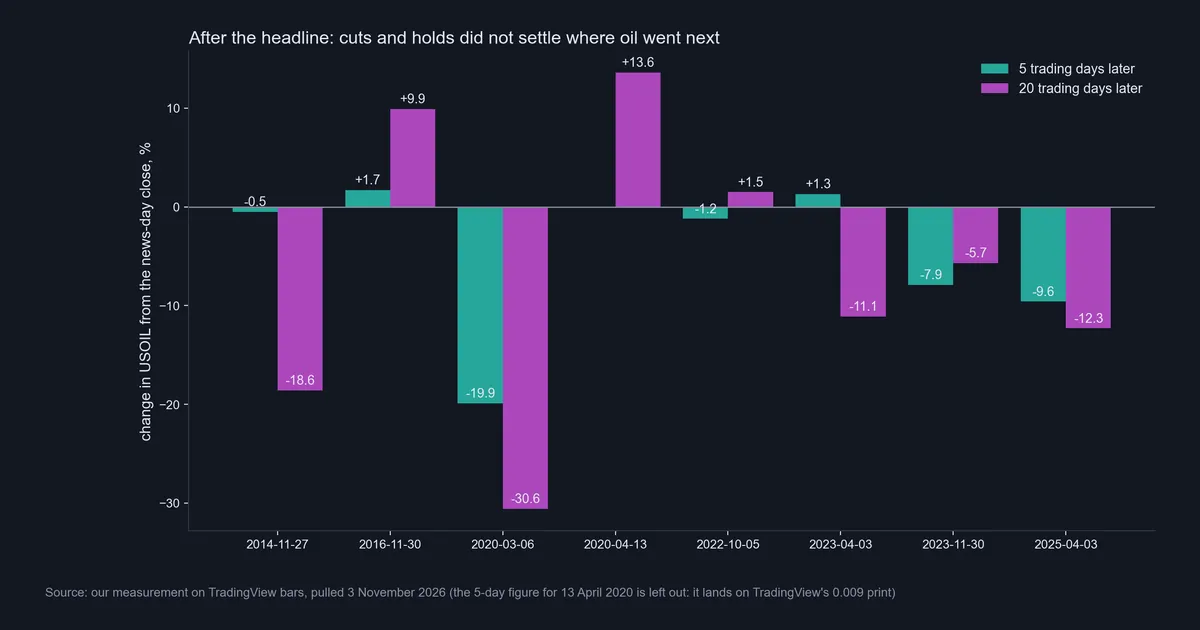
Follow-through split the same way: three of the five cuts stood higher after 20 trading days and two stood lower. April 2020 is the odd one. Wikipedia says the group agreed to remove 9.7 million barrels a day in May and June, about 10% of global output. Yet the first bar fell 3.5%, before USOIL stood 13.6% higher 20 trading days later. Its 5-day figure is missing because it lands on the 0.009 print of 20 April 2020. On that day the front-month future closed at -37.63, as our USOIL guide explains.
OPEC’s 2025 statement also confirms voluntary adjustments in April and November 2023. Yet in November 2023, USOIL fell 2.7% on the first bar, then stood 7.9% lower after 5 trading days and 5.7% lower after 20. In contrast, the three decisions that were not cuts all fell across both windows. That looks like a rule, but it rests on three hand-picked events. Besides, two of them had another large cause in the same weeks.
Download the complete indicator database
Put these concepts on your charts. One email unlocks the full library of 1,380+ indicators with compiled MT4 and MT5 files, plus my TradingView scripts. No paywall, no spam, unsubscribe any time.
Get free access to my indicator database
One email unlocks 1,380+ free MT4, MT5 and TradingView indicators — the complete library. No single-tool download; you get the whole database.
Where it fails: what an OPEC headline cannot tell you
Eight picks prove nothing. We chose them because people remember them, and the list skips every other meeting. So a different eight could tell a different story.
One date can also hold several causes. The EIA’s release of 10 April 2025 says OPEC+ members announced on April 3 that some countries would start May increases originally set for July. That came amid US tariff announcements, and the EIA ties Brent’s 12% fall, to $68 on April 4, to both. As a result, we cannot credit our -5.8% first bar on USOIL to OPEC+ alone.
Targets are not barrels either. Wikipedia describes frequent cheating and says OPEC does not punish members for non-compliance. So a headline number tells you the promise, not the output. We measured price only, not what each country pumped.
Daily bars also hide timing. A decision can land halfway through a bar, so part of that bar’s move may come before the news. Nor did we measure what traders expected beforehand, so we cannot tell a shock from a decision already in the price. Finally, USOIL is a reference line, not an exchange contract, and our numbers will not match Brent or the futures. Our guide to CFDs and our forex and futures comparison explain why those products differ.
Two more decisions: a hold in 2014 and a cut in 2022
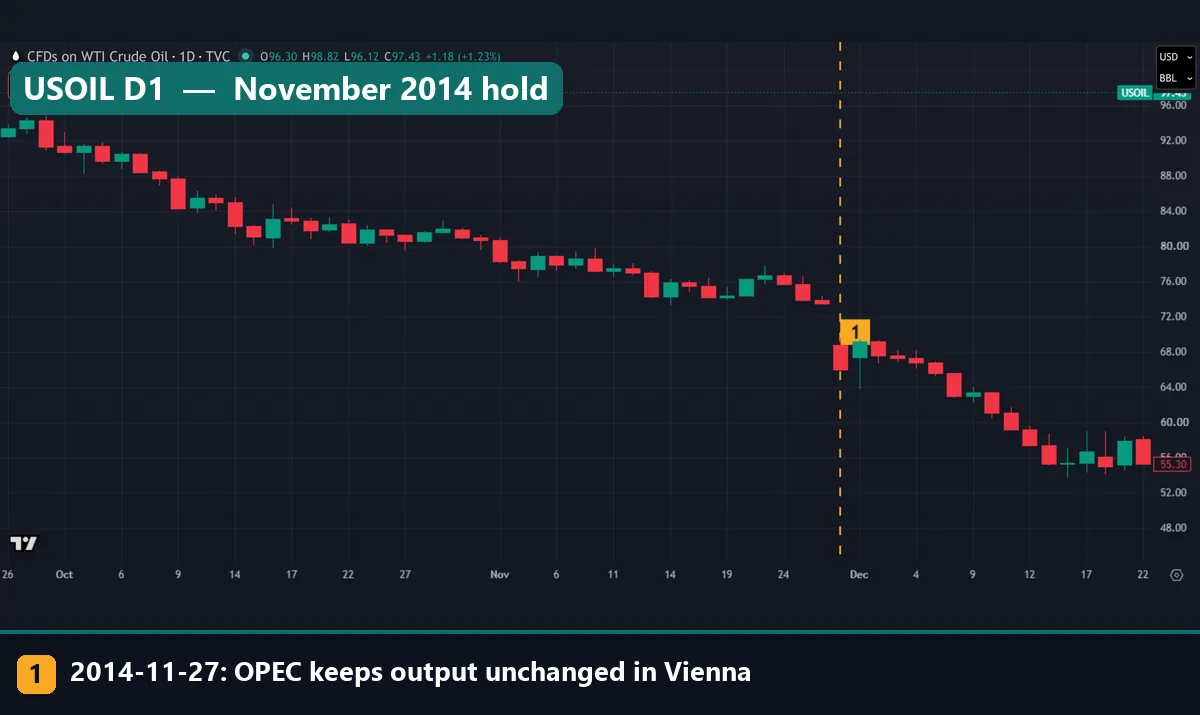
A decision not to act can move price too. On 27 November 2014 in Vienna, Wikipedia says Saudi oil minister Ali Al-Naimi blocked appeals from poorer members for cuts. OPEC kept output unchanged, and the first bar closed at 65.95, down 10.3%. It opened 6.4% below the prior close, on a Thursday rather than after a weekend. We have not checked how that open was built, so treat the split between gap and session as rough. USOIL was only 0.5% lower after 5 trading days, then 18.6% lower after 20.
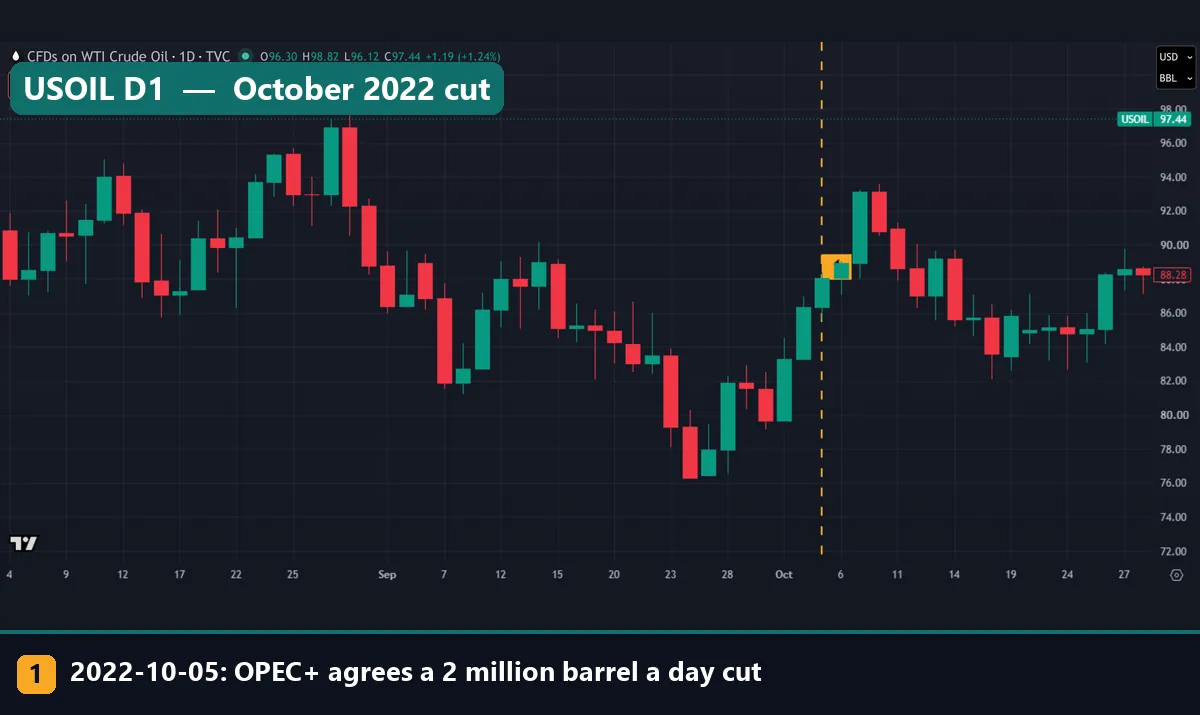
Now a cut with a small first bar. In October 2022, key OPEC+ ministers agreed cuts of 2 million barrels per day, which Wikipedia calls the first since 2020. USOIL rose just 2.0% on 5 October, and the 3.3% range sat below the 4.4% median. Look left of the line, though, because price climbed from a late September low near 76 before that date. This chart cannot tell us why. Afterward it swung both ways, a pattern our whipsaw guide covers. It stood 1.2% lower after 5 trading days and 1.5% higher after 20. Here too the marker box sits behind a candle.
Why a forex trader might care about OPEC
Oil feeds into some currencies and into inflation. Our guides to commodity currencies and forex and commodity correlations cover that link, so we will not repeat them. Our one number is a caution. On daily returns since 2023, over 962 days, USOIL’s correlation with USD/CAD was only -0.14. The sign fits the usual story, but the size is small. So an OPEC headline is not a USD/CAD signal by itself. Instead, treat a meeting like any high-impact news event, and check the date on our economic calendar first.
Common mistakes with OPEC headlines
- Reading “cut” as “up”. Two of our five cuts fell on the first bar, and two stood lower after 20 trading days.
- Mixing up who decided. OPEC, OPEC+ and eight OPEC+ members are different groups with different weight.
- Ignoring the weekend. Two of our eight decisions fell on a Sunday, and one of them opened with a 7.6% gap. A stop does not protect you at its level through a gap.
- Keeping a normal stop. The range reached 12.7% on a day when the median was 2.4%. So size for that kind of day, for example with an ATR-based stop distance.
Where to go next
For primary reading, start with the OPEC statement, the EIA release and the IEA report linked above.
- Crude oil symbols on TradingView, for choosing a WTI or Brent chart.
- USOIL explained, including the 0.009 print and the April 2020 contract.
- Forex news spikes, for how price behaves around a release.
- How to read an economic calendar, for planning around events.
FAQ: OPEC questions traders ask
What does OPEC stand for?
It stands for the Organization of the Petroleum Exporting Countries, founded in Baghdad in 1960 and now based in Vienna.
How many countries are in OPEC?
Wikipedia’s entry lists 11, after the UAE left with effect from 1 May 2026.
What is the difference between OPEC and OPEC+?
OPEC+ adds non-members such as Russia, and it dates from late 2016. Some recent decisions came from only eight of its members.
Does an OPEC cut make oil go up?
Not reliably on our list. Of five cuts, three first bars rose and two fell, and the 20-day split was the same. But the list is hand-picked.
What did oil do after the April 2023 surprise cut?
USOIL opened with a 7.6% gap and closed the first bar up 6.3%. It stood 1.3% higher after 5 trading days, then 11.1% lower after 20.
Why is one 5-day figure missing?
The figure for 13 April 2020 lands on TradingView’s 0.009 print of 20 April 2020, so we left it out.
Do OPEC decisions move forex pairs?
They can, but the daily link is weak on our data. USOIL’s correlation with USD/CAD since 2023 was only -0.14, over 962 days.
Can I trade OPEC decisions from these numbers?
No. Eight hand-picked decisions cannot support a rule, and these figures ignore all trading costs. Use them to judge how wide such a day can be, because results are not guaranteed; past performance is not indicative of future results.
Last updated: 3 November 2026.

About the author
Written by Dominic Walsh, a Forex trader and MT4/MT5 indicator, Expert Advisor and script developer. Every tool on forexmt4systems.com is tested on live charts before release and ships with ready-to-use compiled MT4 (.ex4) and MT5 (.ex5) files. Learn more about the trader and developer behind this site.
How we build, test and correct every tool: Editorial & Testing Policy. Trading carries risk; see the disclaimer.