
A pivot point calculator turns one session’s high, low and close into support and resistance levels for the next session. The maths is plain arithmetic, and you can run it on paper in under a minute. Traders treat the output as a map. The central pivot marks the day’s balance point. R1 to R3 and S1 to S3 mark where moves often stall. This guide works through the classic formula with real numbers. It also covers the Fibonacci and Camarilla variants. Then it explains where pivot levels help and where they fail.
What pivot points actually are
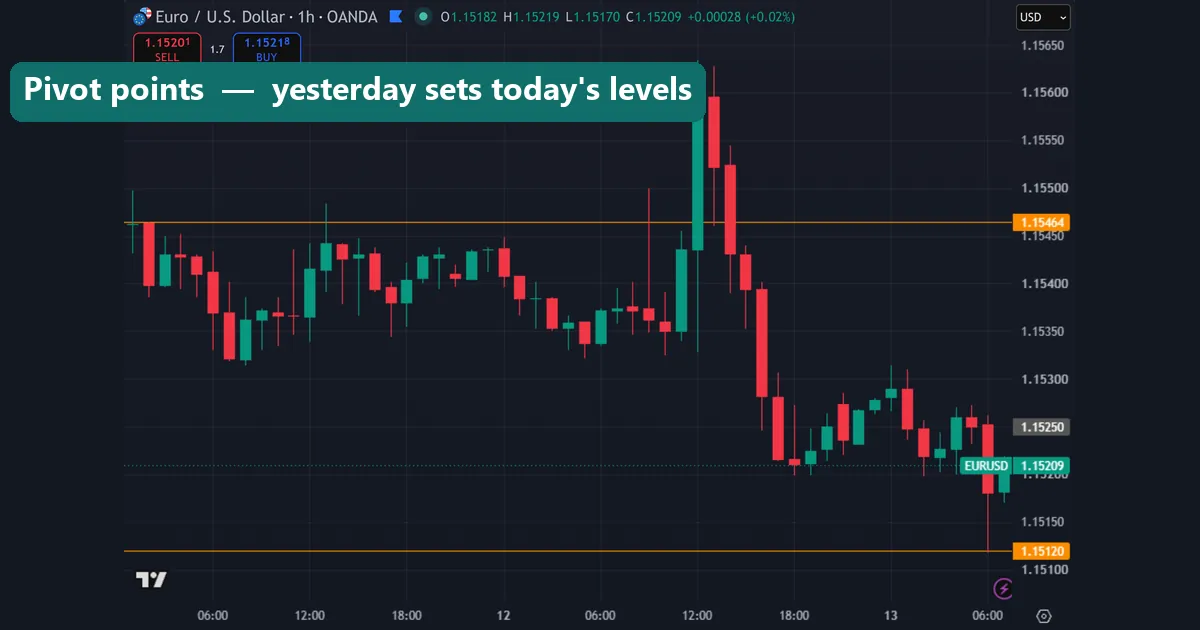
Pivot points are levels derived from the previous session’s high, low and close. Nothing else feeds them. There is no moving average inside, no volatility model, no volume weighting. You take three numbers from yesterday, push them through a short formula, and you get seven price levels for today.
The middle level is the pivot itself, written as P. It averages the range and the close, so it behaves like a rough fair-value line for the session. Resistance levels R1, R2 and R3 sit above it. Support levels S1, S2 and S3 sit below. Every trader using the same session data lands on identical numbers. So the levels appear in the same place on every screen. That shared visibility is the whole point.
The classic pivot point formula
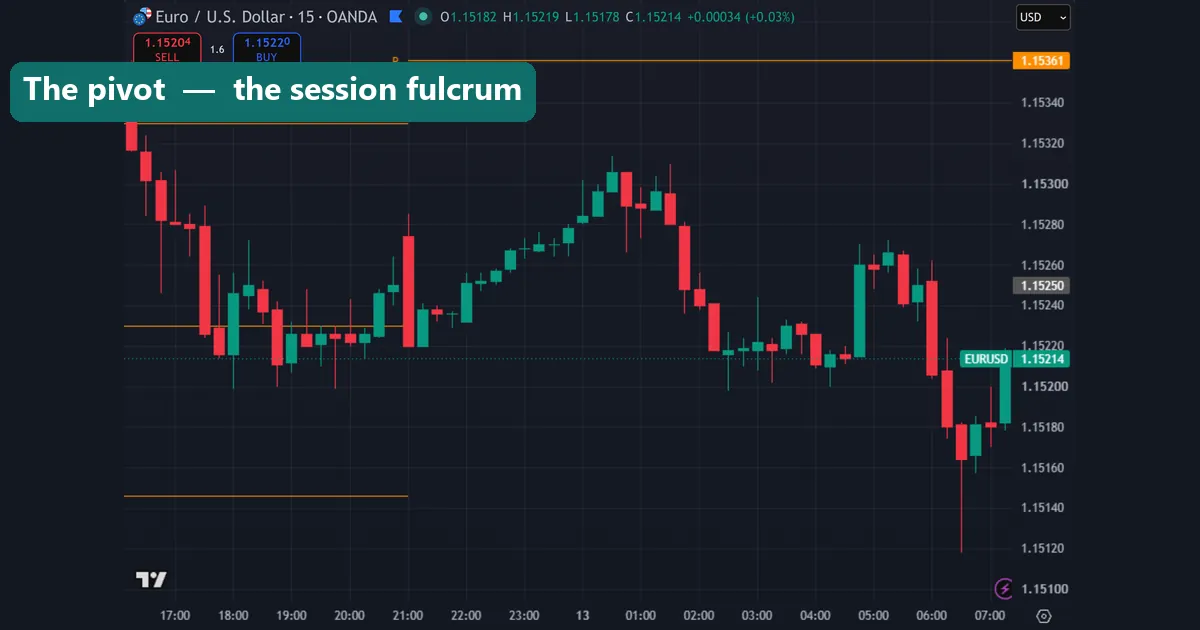
The classic set, sometimes called the standard or floor-trader set, is what most platforms draw by default. Here it is in full, where H, L and C are the previous session’s high, low and close:
P = (H + L + C) / 3R1 = 2P − LandS1 = 2P − HR2 = P + (H − L)andS2 = P − (H − L)R3 = H + 2(P − L)andS3 = L − 2(H − P)
Look at the pattern rather than memorising seven lines. The first pair reflects yesterday’s extremes mirrored around the pivot. Level two adds and subtracts one full range. Finally, R3 and S3 project a further range beyond the old high and low. They only come into play on a strong trend day.
How to calculate pivot points: a worked example
Take a EURUSD daily candle with a high of 1.0980, a low of 1.0870 and a close of 1.0940. The range, H minus L, is 0.0110 — 110 pips. Now run the numbers.
- P = (1.0980 + 1.0870 + 1.0940) / 3 = 3.2790 / 3 = 1.0930
- R1 = (2 × 1.0930) − 1.0870 = 2.1860 − 1.0870 = 1.0990
- S1 = (2 × 1.0930) − 1.0980 = 2.1860 − 1.0980 = 1.0880
- R2 = 1.0930 + 0.0110 = 1.1040
- S2 = 1.0930 − 0.0110 = 1.0820
- R3 = 1.0980 + 2 × (1.0930 − 1.0870) = 1.0980 + 0.0120 = 1.1100
- S3 = 1.0870 − 2 × (1.0980 − 1.0930) = 1.0870 − 0.0100 = 1.0770
Seven levels, one candle of input. Notice the spacing. R1 and S1 sit 60 and 50 pips from the pivot. R3 and S3 sit far out, at 170 and 160 pips. That gap matters when you plan targets, because the outer levels rarely get tested on a quiet day.
Fibonacci, Camarilla and Woodie variants
The Fibonacci version keeps the same central pivot and then spaces the levels using Fibonacci ratios of the previous range:
R1/S1 = P ± 0.382 × (H − L)R2/S2 = P ± 0.618 × (H − L)R3/S3 = P ± 1.000 × (H − L)
Using the same candle, 0.382 of the 0.0110 range is 0.0042 and 0.618 is 0.0068. So Fibonacci R1 lands at 1.0972, R2 at 1.0998 and R3 at 1.1040. Mirrored supports sit at 1.0888, 1.0862 and 1.0820. Traders who already draw retracements tend to prefer this set, because the spacing lines up with levels they watch anyway.
Two other variants show up in platform menus. Camarilla multiplies the range by small fractions of 1.1 around the previous close. That packs the inner levels tightly, which suits intraday mean reversion. Woodie weights the close twice, using P = (H + L + 2C) / 4. Its pivot leans toward where the session finished.
Comparing the pivot types
| Pivot type | Central pivot | How levels are derived | Best suited to |
|---|---|---|---|
| Classic | (H + L + C) / 3 | Mirrors of the high and low around P, then whole-range projections | General day trading; the default most traders see |
| Fibonacci | (H + L + C) / 3 | 0.382, 0.618 and 1.000 of the previous range added to and subtracted from P | Traders already using retracement levels |
| Camarilla | Built around the previous close | Range multiplied by fractions of 1.1, giving tightly packed inner levels | Short-hold intraday mean reversion |
No variant is better in the abstract. Pick one, keep it, and learn how price behaves around it on your pair. Switching sets every week only muddles the picture.
Which session should you calculate from?
Daily pivots are the common choice, and for good reason. They use the previous full trading day. Almost every platform defines that the same way, so the levels are widely shared. Intraday traders on M5 through H1 get a fresh, relevant map each morning without redrawing anything.
Weekly pivots suit swing traders holding for several days, and monthly pivots give position traders a wider frame. Forex complicates the daily question slightly, because the market never closes. Your broker’s server time decides where the daily candle breaks. A 5pm New York close and a midnight GMT close produce different levels. Check which one your platform uses, then stick with it.
How traders use a pivot point calculator in practice
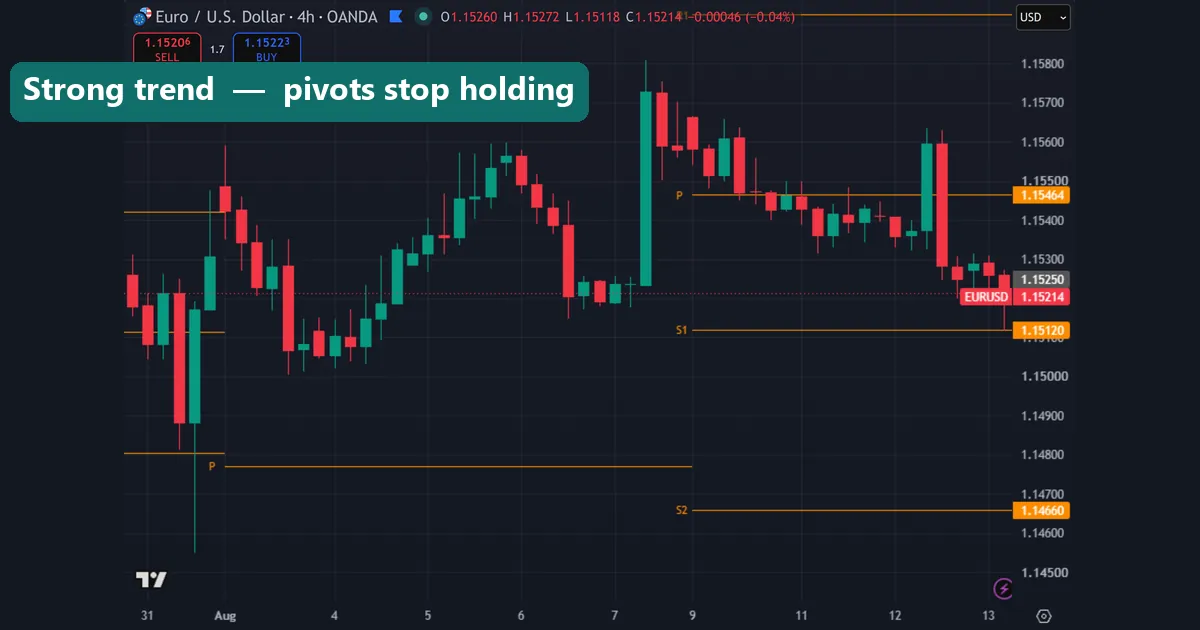
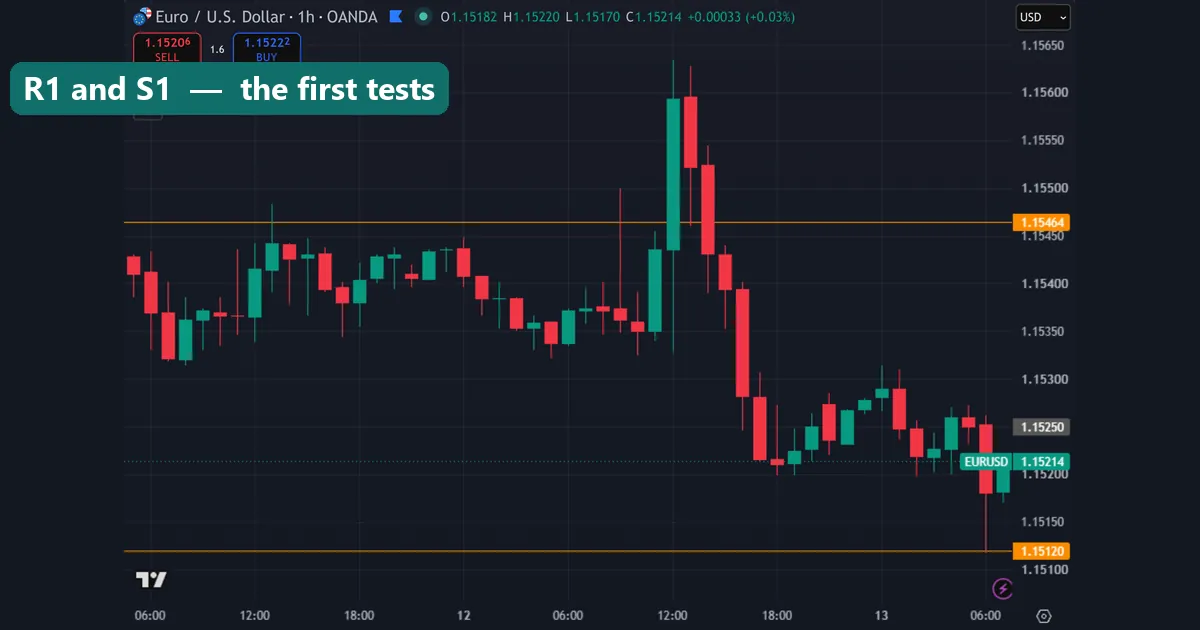
Three uses cover almost everything. First, plain support and resistance. You expect reactions at R1 and S1, so targets go just before them and stops just beyond. Second, mean reversion toward P. When price opens well above the pivot and momentum fades, traders look for a drift back. Third, breakout trading. A decisive close beyond R1 or S1 suggests the session has picked a direction. R2 or S2 then becomes the next objective.
The pivot also works as a simple bias filter. Above P, you favour longs. Below P, you favour shorts. That one rule keeps many intraday traders out of counter-trend trades they had no business taking.
You do not need to run the arithmetic yourself. The pivot points indicator ships built into TradingView. MT4 and MT5 also run pivot indicators that plot all seven levels automatically. Manual calculation is still worth doing once. It shows how sensitive the levels are to yesterday’s range. To load a downloaded version on MetaTrader, follow our walkthrough on how to install MT4 and MT5 indicators.
Download the complete indicator database
Put these concepts on your charts. One email unlocks the full library of 1,380+ indicators with compiled MT4 and MT5 files, plus my TradingView scripts. No paywall, no spam, unsubscribe any time.
Get free access to my indicator database
One email unlocks 1,380+ free MT4, MT5 and TradingView indicators — the complete library. No single-tool download; you get the whole database.
The honest limitation of pivot levels
Pivot points are arithmetic on yesterday’s data. They contain no forecast, no probability and no edge of their own. Any usefulness comes from crowd behaviour. Enough traders watch the same numbers that orders cluster there, and clusters create real reactions. Take away the audience and the levels mean nothing.
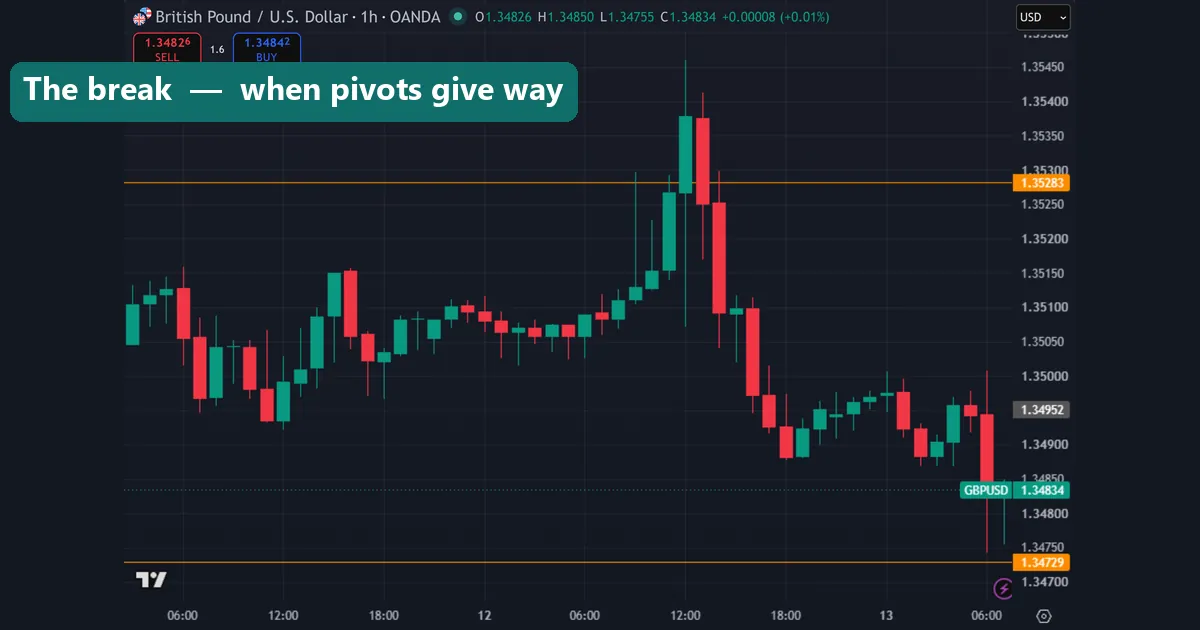
They also break down in strong trends. When a currency runs on a rate decision, price slices through R1, R2 and R3 without pausing. Every reversion trade against that move loses. Quiet, range-bound sessions are where pivots shine. Trending sessions are where they hurt. Read the day’s character first, using something as simple as an ATR value. That matters more than the levels themselves. Our guide on using ATR as a stop loss covers that volatility check.
Common pivot point mistakes
Four mistakes account for most of the trouble. Trading a level blind is the biggest. Price touching R1 tells you nothing until a candle reacts there. Wait for the rejection, or for the close through. Mixing sessions is next — daily pivots on a weekly chart produce a cluttered mess that helps nobody.
Another common error is stacking every variant at once. Classic, Fibonacci and Camarilla together give you twenty-plus lines, and with that many levels something always sits near price. Finally, plenty of traders forget position sizing entirely once they have a neat level to trade against. Size the trade from your stop distance instead, as our forex position sizing calculator guide explains.
Where to go next
Pivot levels work best alongside a few basics. Learn to size trades correctly with our forex pips calculator guide. Read the reactions at each level with candlestick chart patterns. Then pair the levels with momentum tools from our roundup of the best day trading technical indicators. For background, Investopedia explains the pivot point at Investopedia. There is also a formula reference for pivot points on Wikipedia.
FAQ
How do you calculate pivot points by hand?
Add the previous session’s high, low and close, then divide by three. That gives P. From there, R1 equals 2P minus the low, and S1 equals 2P minus the high. R2 and S2 add and subtract the full range from P.
Which pivot point type is best for forex?
Classic daily pivots suit most forex traders, mainly because they are the most widely watched. Fibonacci pivots fit traders who already use retracements, while Camarilla suits tight intraday mean reversion. Consistency matters more than the choice.
Do pivot points repaint?
No. Once the previous session closes, the high, low and close are fixed, so today’s levels never move. Only a change of session, such as the daily rollover, produces a new set of levels.
Is there a pivot points indicator on MT4, MT5 and TradingView?
Yes. TradingView includes pivot points as a built-in study with selectable types. MT4 and MT5 both run pivot indicators too. They plot P, R1 to R3 and S1 to S3 from your broker’s daily candles.
Why do my pivot levels differ from another trader’s?
Broker server time is usually the reason. A candle closing at 5pm New York gives different values than one closing at midnight GMT. Check your platform’s session settings before comparing numbers.
Are pivot point levels guaranteed to hold?
No. Pivot levels are arithmetic on old data, and price cuts straight through them during strong trends or major news. Trading involves risk, results are not guaranteed, and past performance is not indicative of future results.

About the author
Written by Dominic Walsh, a Forex trader and MT4/MT5 indicator, Expert Advisor and script developer. Every tool on forexmt4systems.com is tested on live charts before release and ships with ready-to-use compiled MT4 (.ex4) and MT5 (.ex5) files. Learn more about the trader and developer behind this site.
How we build, test and correct every tool: Editorial & Testing Policy. Trading carries risk; see the disclaimer.