
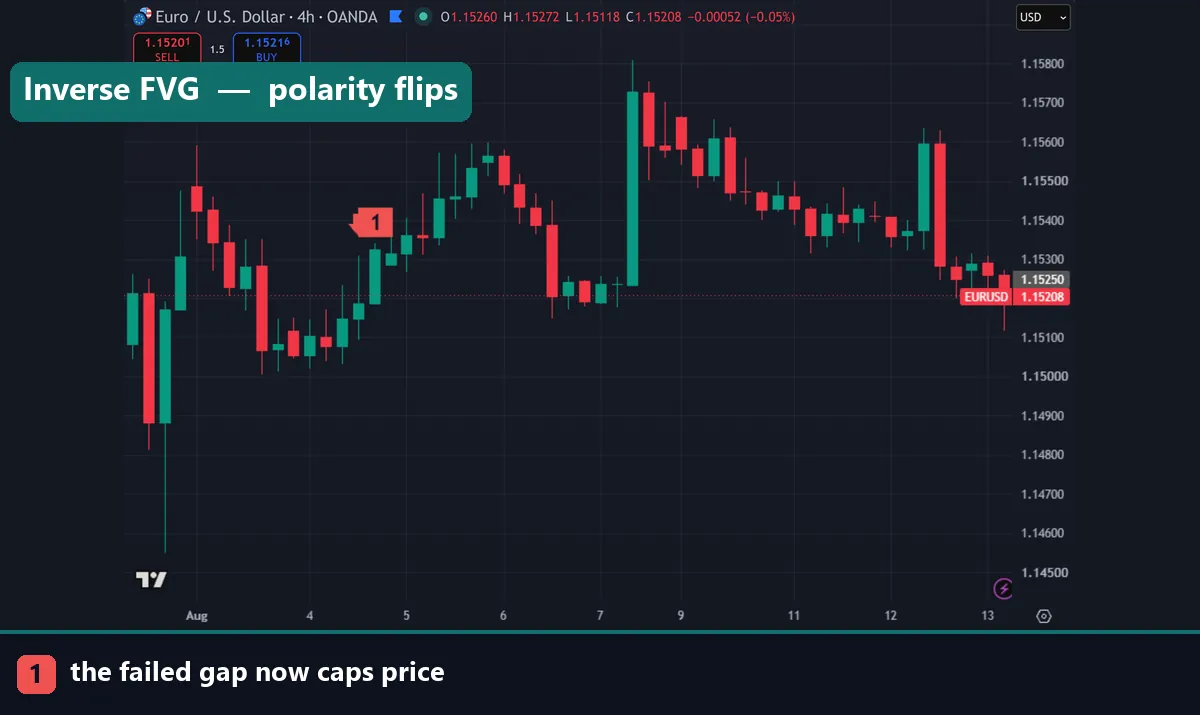
An inverse FVG is a fair value gap that price has traded straight through instead of respecting. When that happens the zone flips polarity: a bullish gap that fails becomes resistance, and a bearish gap that fails becomes support. Traders shorten the name to IFVG, or call it an inversion fair value gap. This guide defines the ordinary gap first, then explains exactly what the flip signals, how to trade the retest, and why the concept is far less clean in live markets than it looks on a finished chart.
First, what a fair value gap is
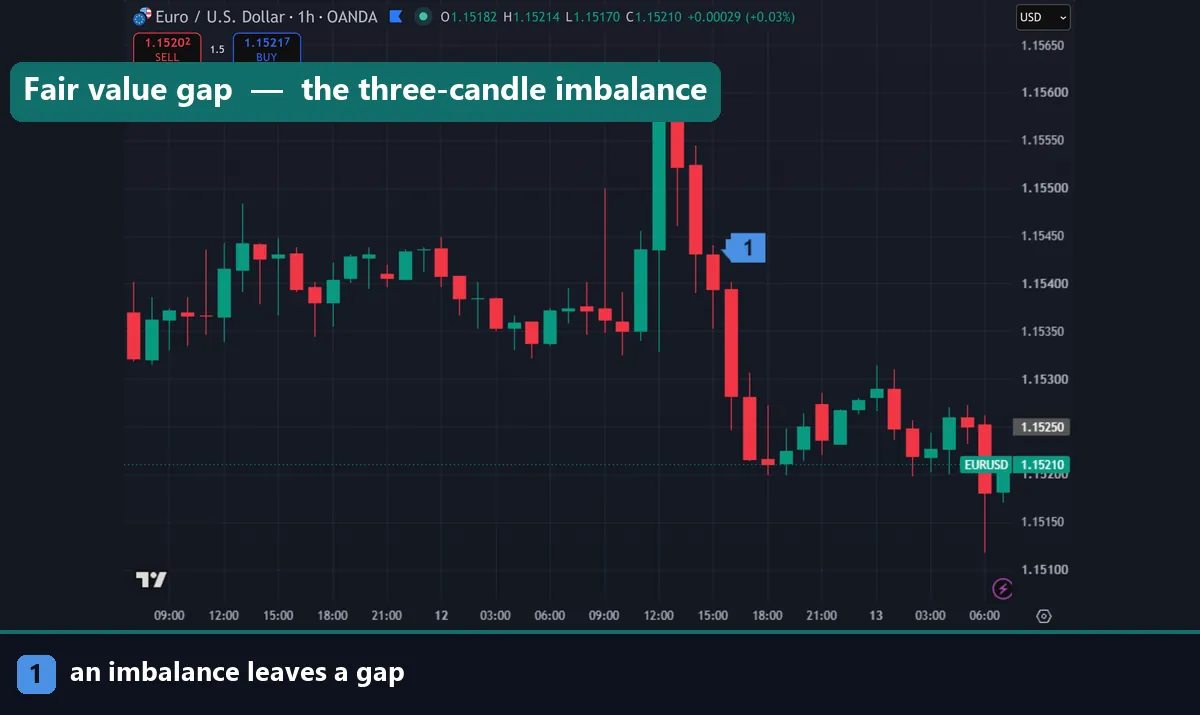
A fair value gap is a three-candle pattern. Look at candle one and candle three. If the wick of the first and the wick of the third do not overlap, the middle candle covered ground that never traded in both directions. That untouched pocket is the gap.
In a bullish FVG, the high of candle one sits below the low of candle three. The space between those two prices is the zone. A bearish FVG is the mirror image: the low of candle one sits above the high of candle three.
Why does it matter? Because the move happened too fast for orders on both sides to be filled. Many traders therefore expect price to return and trade back through the pocket later. Marking one takes seconds — draw a rectangle from the candle-one wick to the candle-three wick, and extend it right.
What an inverse FVG is
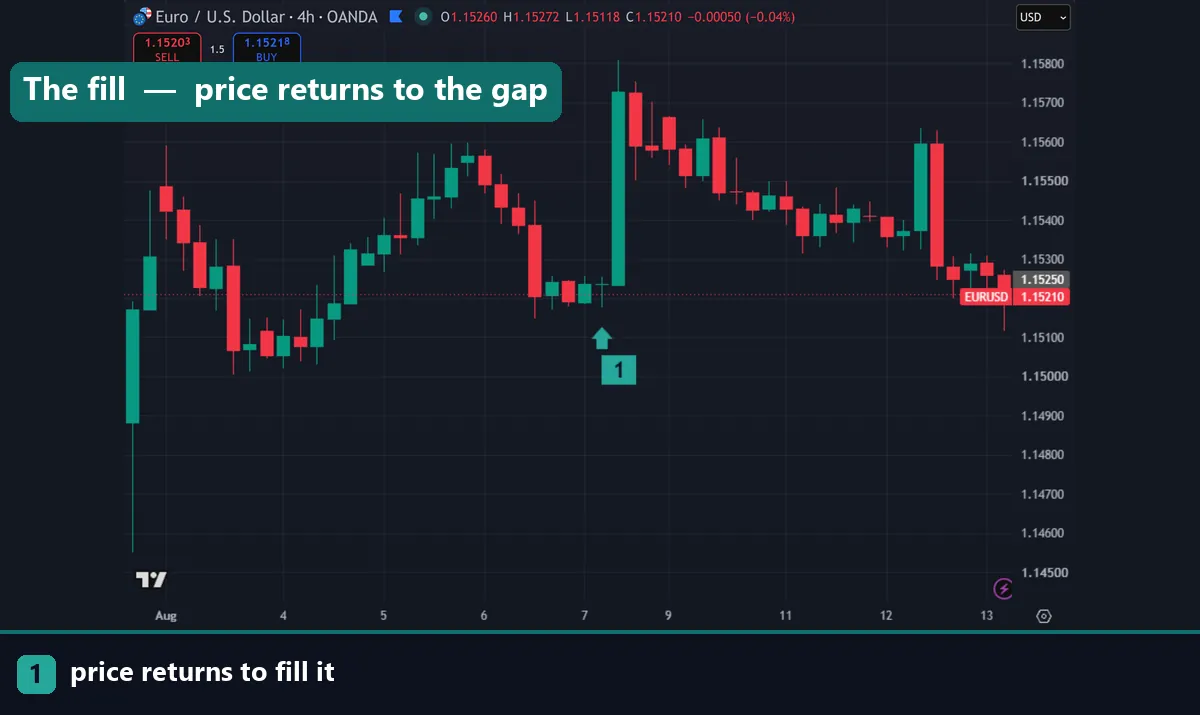
Normally you expect a bullish gap to hold as support. Price drops back into it, buyers step in, and the move resumes upward. That is the textbook outcome.
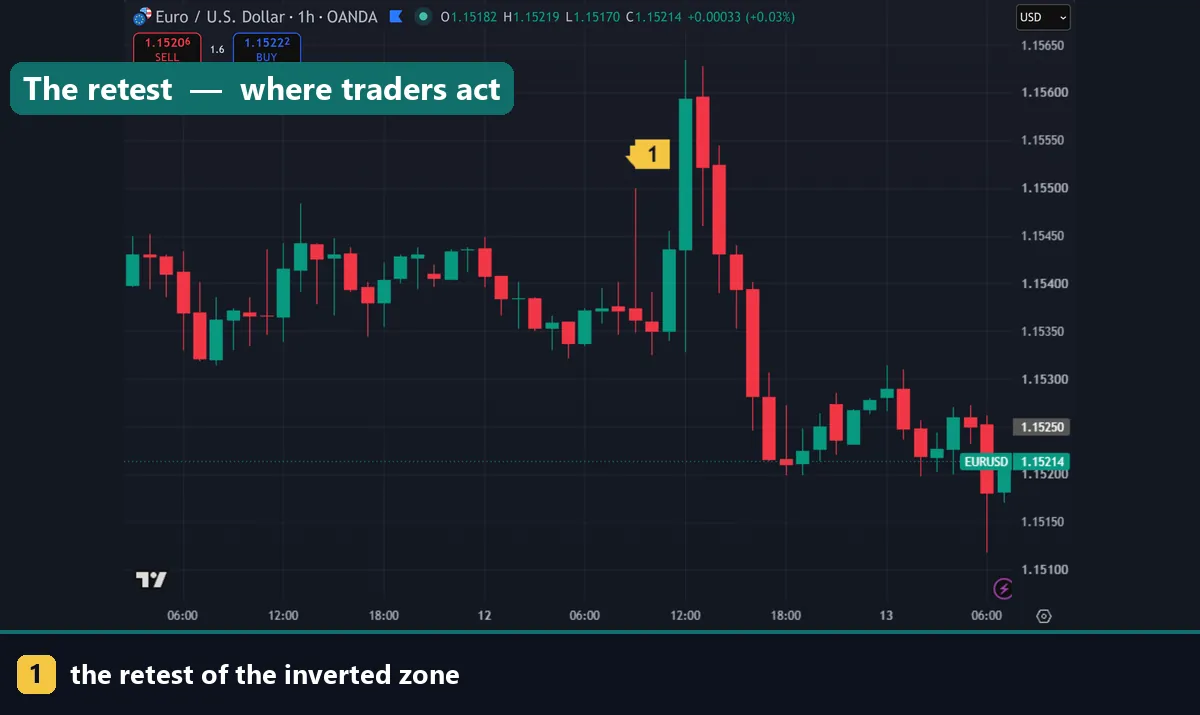
Sometimes price does the opposite. It cuts through the entire zone and closes decisively on the far side. The gap failed. At that moment an inverse FVG is born, and the zone changes role. Your bullish gap is now a resistance area. If price rallies back up into it, sellers may be waiting.
The same logic runs the other way. A bearish FVG that price closes above becomes a support area on the retest. Nothing about the rectangle changes. Only its expected role flips.
Note the word “decisively”. A single wick poking through does not invert anything. You want a candle body closing beyond the far edge of the zone, ideally with follow-through on the next bar.
Why the polarity flip matters
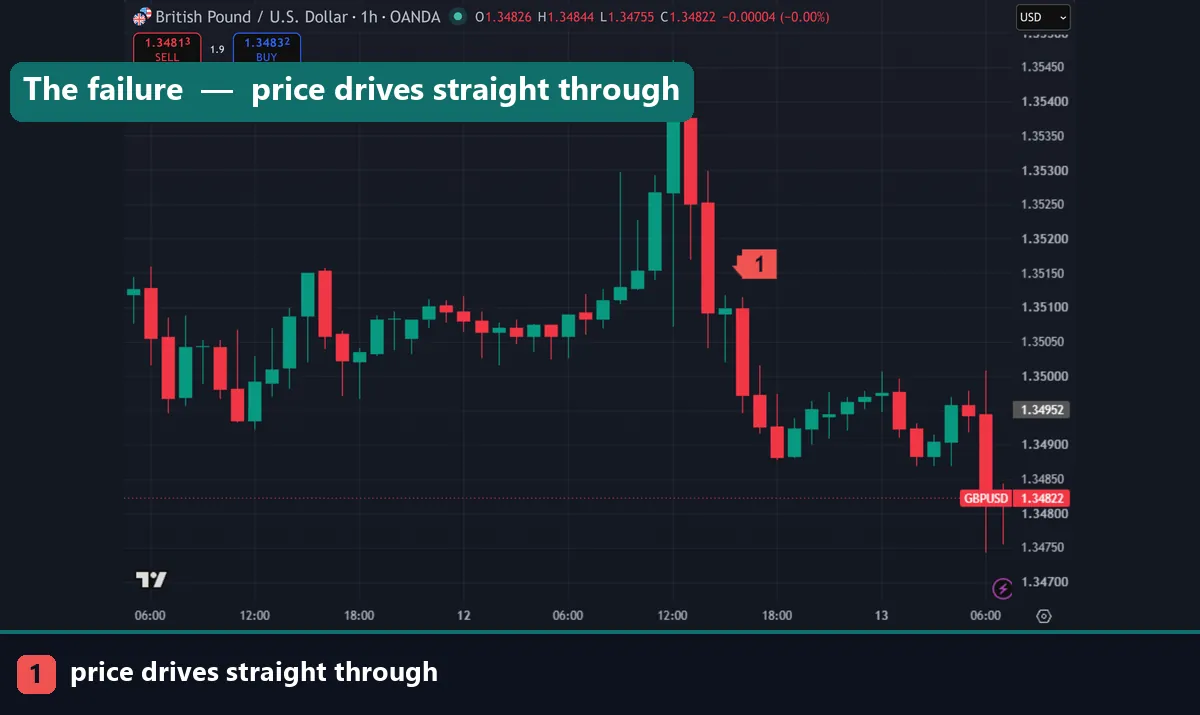
The flip carries information, and that is the real reason traders track it. A fair value gap represents unfilled interest in one direction. When price slices through without pausing, that interest got absorbed. Whoever was defending the zone ran out of size, or gave up.
Think of it as a failed defence. The buyers who should have supported a bullish gap did not show up, so the level lost its meaning as support. Fresh sellers now sit above, and any traders who bought inside the zone are underwater. Many of them will exit at breakeven on a retest, which adds supply exactly where the zone sits.
This is the same mechanic behind classic support-turned-resistance. The gap version simply gives you a defined box rather than a single line, so your stop placement gets easier. Candlestick context helps you judge whether the break was genuine, so review how to read candlestick charts if body-versus-wick reading is still shaky.
How traders use an inverse FVG
Most IFVG entries follow four steps.
1. Mark the original gap. Find a clean three-candle imbalance on your working timeframe. H1 and M15 give the most usable zones for intraday trading.
2. Wait for the failure. Price must close through the whole zone, body beyond the far edge. Half-fills do not count. Patience matters more here than anywhere else in the setup.
3. Wait for the retest. Let price come back into the inverted zone. Do not chase the breakout candle. The retest is where your risk is smallest, because the invalidation level sits close by.
4. Enter with the stop beyond the gap. Place your stop on the far side of the zone, past the original gap boundary. If price closes back through in the original direction, the inversion failed and you are out for a small loss.
Confluence sharpens the read. An inverse FVG that lines up with a swept liquidity level is stronger than one sitting alone in the middle of a range, and our liquidity sweep example shows how those two ideas stack.
Normal FVG vs inverse FVG
| Feature | Normal FVG | Inverse FVG |
|---|---|---|
| What forms it | Three candles where wick one and wick three do not overlap | A normal FVG that price closes fully through |
| Bullish version acts as | Support on the pullback | Resistance on the retest |
| Bearish version acts as | Resistance on the pullback | Support on the retest |
| Trade direction | With the original impulse | Against the original impulse |
| Entry trigger | First tap into the zone | Retest of the zone from the opposite side |
| Invalidation | Full fill plus a close through the zone | Close back through in the original direction |
| When you can see it | As soon as candle three closes | Only after the failure, never before |
That last row deserves attention. It is the single biggest practical difference between the two, and the source of most disappointment with the concept.
Download the complete indicator database
Put these concepts on your charts. One email unlocks the full library of 1,380+ indicators with compiled MT4 and MT5 files, plus my TradingView scripts. No paywall, no spam, unsubscribe any time.
Get free access to my indicator database
One email unlocks 1,380+ free MT4, MT5 and TradingView indicators — the complete library. No single-tool download; you get the whole database.
The honest limitations of inverse FVG trading
Start with the timing problem. An inverse FVG only exists once the original gap has already failed. You cannot mark one in advance, so you are always reacting. Backtests that highlight inverted zones on completed charts hide how ambiguous the moment of failure feels live.
Then there is frequency. Gaps get filled routinely. Price moves fast, leaves imbalances, and comes back to trade through them all day long. Not every fill is meaningful absorption; most are ordinary two-way trade. Treating every filled gap as a polarity flip will hand you a stream of low-quality signals.
Lower timeframes make this worse. M1 and M5 charts are littered with tiny gaps, many of them just a few pips wide and produced by thin liquidity or a news tick. Those zones carry no information at all. Stick to gaps that are visible without zooming, on H1 and above where possible.
One final caveat. The concept is discretionary, so two traders will disagree about whether a given close counts as decisive. No rule settles it, and no version of the setup removes risk from the trade.
Common inverse FVG mistakes
Calling the inversion on a wick tops the list. A long shadow through the zone shows rejection, not absorption, which is closer to the opposite of what you want. Demand a body close.
Another frequent error is trading every gap on the chart. Quality beats quantity here. Keep the ones that formed on strong displacement candles, sat unfilled for a while, and align with a level you already respected.
Third, chasing the breakout instead of the retest. Entering as price rips through the zone puts your stop far away and your entry at the worst price of the move. Let it come back.
Fourth, ignoring the wider trend. An inverted bullish gap turning into resistance means little if the daily chart is trending hard upward. Momentum context helps, and pairing zone work with something like a bullish divergence read gives you a second, independent opinion.
Last, forgetting that obvious zones attract deliberate probing. Read our guide to the liquidity trap to see how a clean-looking break can reverse immediately.
Where to go next
Gap work fits neatly alongside momentum tools, so browse our roundup of the best day trading technical indicators and pick one for confirmation. When you are ready to auto-plot imbalances on your platform, the walkthrough on how to install MT4 and MT5 indicators covers the setup. For background on gaps generally, Investopedia defines the gap at Investopedia, and Wikipedia documents the gap chart pattern on Wikipedia.
FAQ
What is an inverse FVG in simple terms?
It is a fair value gap that price broke through instead of respecting. The failed zone then flips role, so a bullish gap becomes resistance and a bearish gap becomes support on the retest.
How do I know when a fair value gap has actually failed?
Look for a candle body closing beyond the far edge of the zone, not just a wick through it. Follow-through on the next candle strengthens the case considerably.
Is an inverse FVG the same as a breaker block?
They share the same logic, but the building block differs. A breaker uses an order block that price traded through, while an inversion fair value gap uses a failed imbalance. Both rely on a broken level flipping polarity.
Which timeframe suits IFVG trading best?
H1 and H4 give the cleanest zones. M15 works for intraday entries. Below M5 you will find dozens of tiny gaps that carry no real meaning, so most traders filter those out.
Where should the stop go on an inverse FVG trade?
Beyond the far boundary of the original gap, plus a buffer for spread. If price closes back through the zone in its original direction, the inversion read was wrong and the trade should be closed.
Are inverse FVG setups guaranteed to work?
No. The pattern is discretionary, it can only be identified after the failure, and plenty of gaps get filled for ordinary reasons. Trading involves risk, results are not guaranteed, and past performance is not indicative of future results.

About the author
Written by Dominic Walsh, a Forex trader and MT4/MT5 indicator, Expert Advisor and script developer. Every tool on forexmt4systems.com is tested on live charts before release and ships with ready-to-use compiled MT4 (.ex4) and MT5 (.ex5) files. Learn more about the trader and developer behind this site.
How we build, test and correct every tool: Editorial & Testing Policy. Trading carries risk; see the disclaimer.