
A breaker block is an order block that failed. Price traded back through the zone that was supposed to hold, so the traders who bought or sold there are now trapped. That failed zone then flips polarity: failed demand starts acting as supply, and failed supply starts acting as demand. ICT traders watch the retest of that flipped zone because it marks where the losing side scrambles to get out. This guide walks through what an order block is, exactly how a breaker forms, how it differs from a mitigation block, and where the honest weaknesses sit.
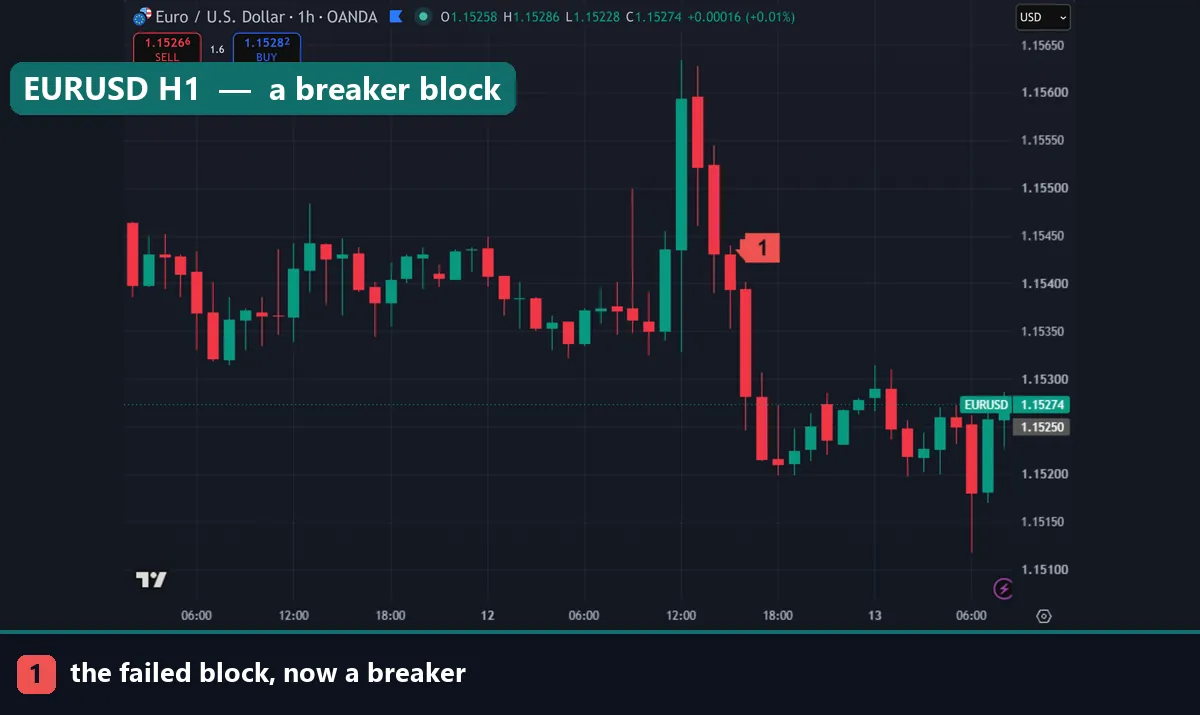
Start with the order block
You cannot read a breaker without reading an order block first. An order block is the last opposing candle before an impulsive move away from a level. Before a sharp rally, that means the final down-close candle. Before a sharp sell-off, it means the final up-close candle. The idea is that large orders were filled in that candle, and price left the area in a hurry.
Two conditions matter more than the label. First, the move away must be impulsive, not a slow drift. Second, it should leave an imbalance behind: a gap between candle wicks where price moved too fast to trade both sides. That imbalance is the fingerprint of real displacement. Without it, you are just drawing a box on a random candle.
Most traders mark the zone from the candle’s open to its close, then extend it forward. Others use the full high-to-low range. Neither version is official, so pick one convention and keep it.
What turns an order block into a breaker block
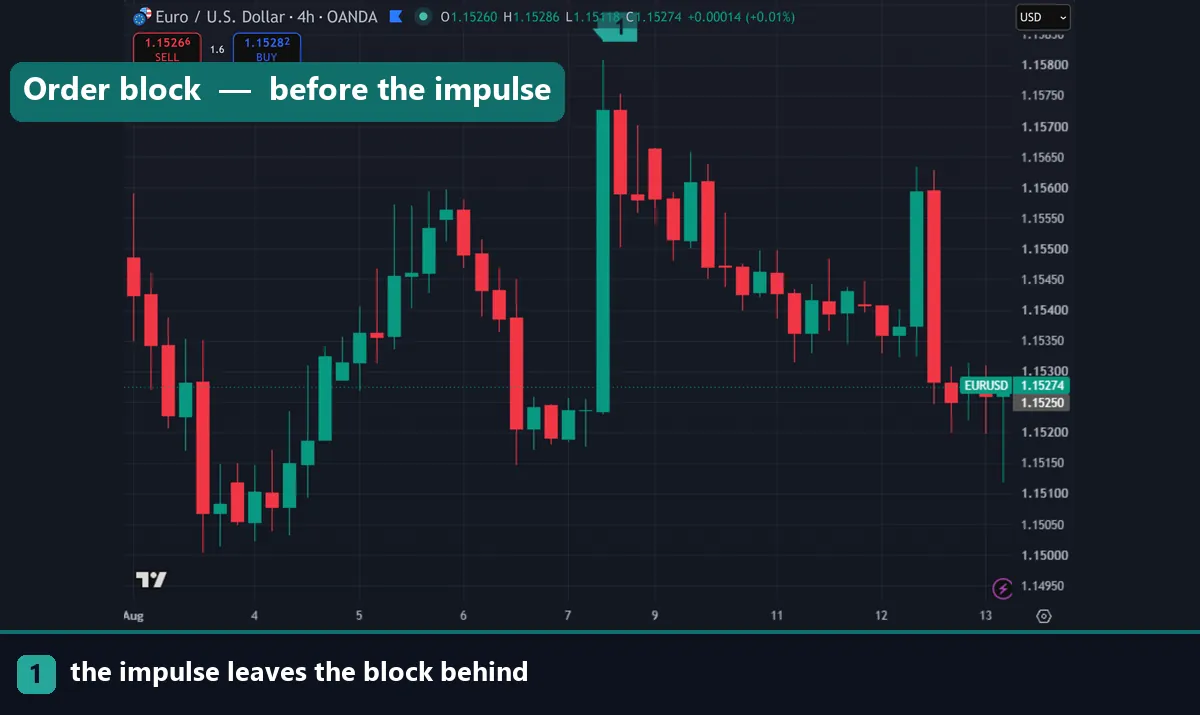
An order block holds until it does not. When price cuts back through the zone and closes decisively on the other side, that block has failed. Everyone who entered there is now offside. And that is the whole mechanic behind a breaker block.
Think about a bearish order block at a swing high. Sellers entered there and expected the market to keep falling. Instead price rips back up and closes above the block. Those sellers now hold losing positions. Many of them will exit at breakeven if the market drifts back down to their entry, which means buy orders sit waiting inside that old zone. So the failed supply area becomes a demand area on the retest.
The bearish version mirrors it exactly. A bullish order block gets broken to the downside, trapped longs wait to exit at breakeven, and the old demand zone becomes resistance. Polarity flips because the crowd inside the zone flipped from confident to desperate.
The exact sequence that forms a breaker
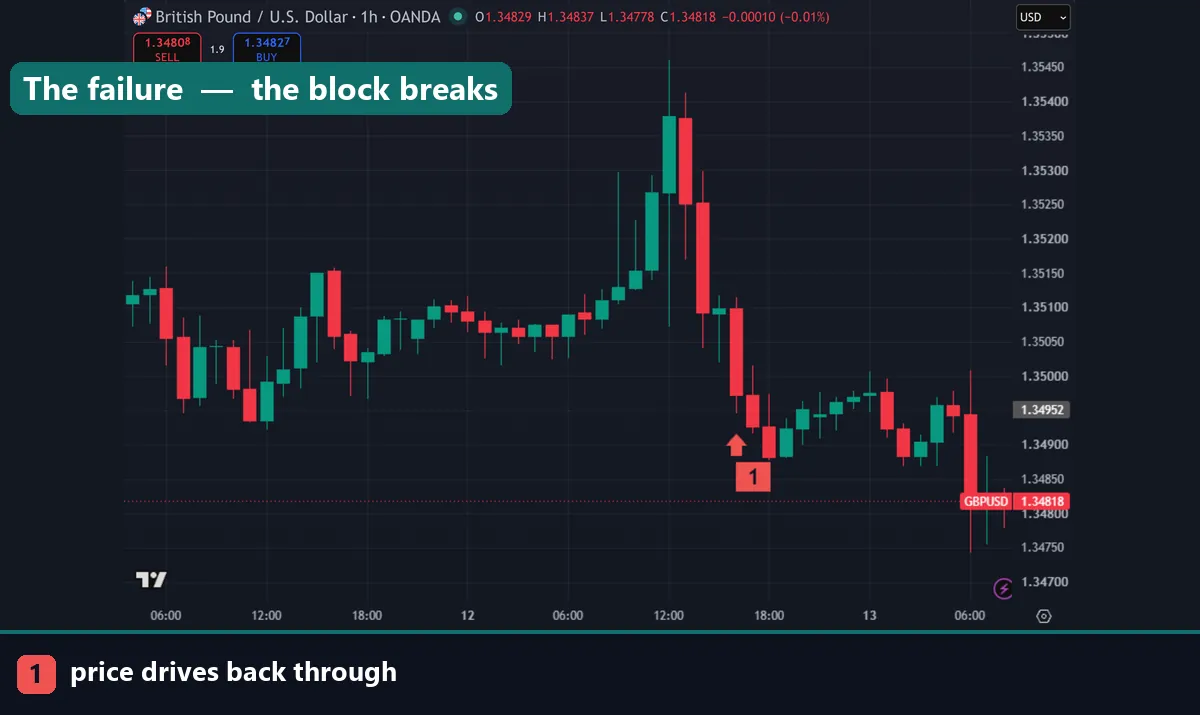
Here is the bullish sequence, step by step. Reverse every direction for the bearish version.
- A swing low prints. The market sets a visible low that other traders can see. Stop orders build up underneath it.
- Price rallies into a swing high. The down-close candle at that high is a bearish order block.
- The market drops and sweeps the low. Price runs past the earlier swing low and triggers those resting stops. This is the liquidity grab, and it is the step that separates a breaker from everything else.
- Price reverses hard and closes back above the bearish order block. The block has now failed.
- The failed block becomes a bullish breaker. On the next return to that zone, traders look for it to hold as support.
Notice the order of events. The sweep comes before the failure, never after. If price simply grinds through an order block with no stop raid first, you are looking at something weaker. A worked example of step three sits in our walkthrough of a liquidity sweep on a real chart.
Breaker block versus mitigation block
These two get confused constantly, and the difference comes down to one thing: whether liquidity was taken. A breaker requires the market to run past a prior swing high or low and trip stops before it reverses. A mitigation block has the same broken-order-block shape, but the reversal starts from a higher low or a lower high, so no stops were raided. Both zones flip polarity in exactly the same way. Most ICT traders rank the breaker higher, because the trapped-trader story has real fuel behind it — a pile of freshly triggered stops — while the mitigation block only has disappointed positioning.
Order block, breaker block and mitigation block compared
| Zone | How it forms | What it acts as | What invalidates it |
|---|---|---|---|
| Order block | Last opposing candle before an impulsive move that leaves an imbalance | Support if bullish, resistance if bearish, on the first return | A candle closing through the far edge of the zone |
| Breaker block | An order block that failed after price swept a prior swing, then closed back through the block | The opposite of its original role: failed supply becomes demand, failed demand becomes supply | A close back through the zone in the original direction, or price retracing past the swept swing |
| Mitigation block | Same failure, but with no liquidity sweep — the reversal began at a higher low or lower high | The same polarity flip, generally treated as the weaker of the two | A close beyond the zone against the new bias |
One caution on labels: educators swap these names around, and some call every failed block a breaker. Judge the sequence on the chart, not the terminology.
How traders enter on the retest
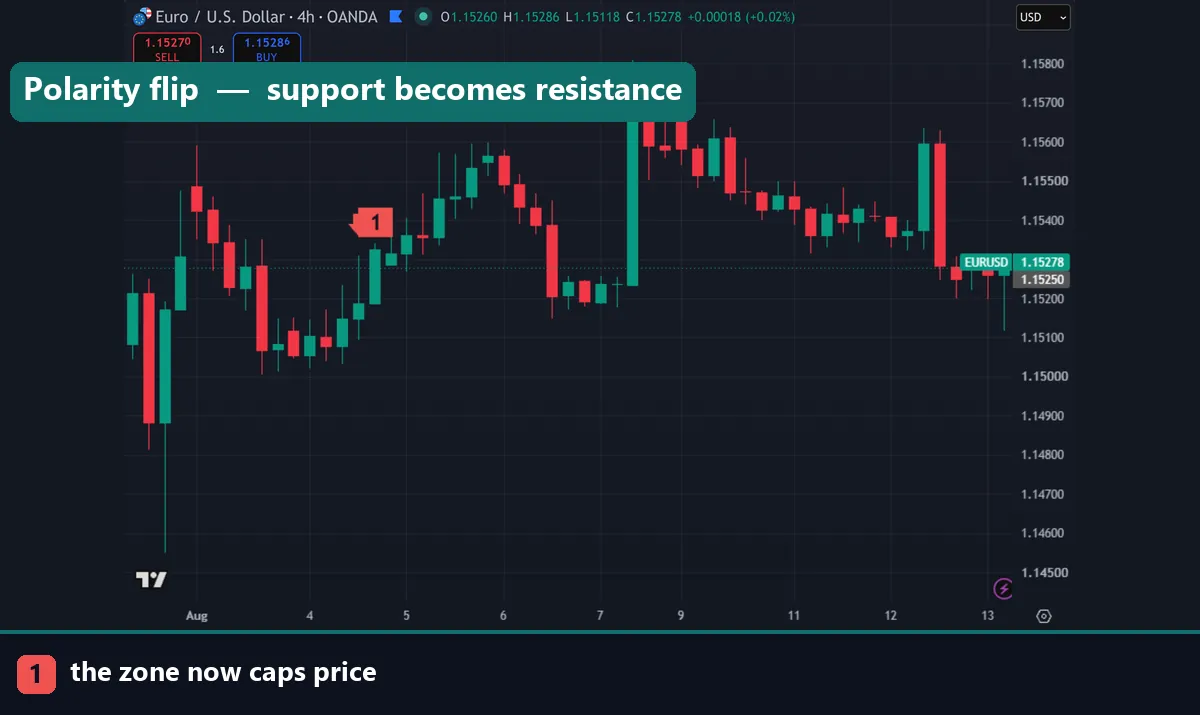
The zone only becomes tradeable once price comes back to it. Aggressive traders place a limit order at the near edge, which gives the best price and the tightest risk. Patient traders wait for the lower timeframe to confirm: a shift in market structure inside the zone, a rejection wick, or an inverse fair value gap holding as support. Confirmation costs you a few pips of entry, but it filters out the clean cuts straight through.
Stops belong beyond the far edge of the block, plus a buffer. A stop inside the zone will get taken out by ordinary noise, because zones are ranges rather than exact lines. Sizing that buffer from current volatility works better than a fixed pip count, and our guide on using ATR as a stop loss covers the arithmetic.
For targets, most traders aim at the opposite pool of liquidity: the nearest untouched swing high or low. That gives an objective exit instead of a hopeful one.
Download the complete indicator database
Put these concepts on your charts. One email unlocks the full library of 1,380+ indicators with compiled MT4 and MT5 files, plus my TradingView scripts. No paywall, no spam, unsubscribe any time.
Get free access to my indicator database
One email unlocks 1,380+ free MT4, MT5 and TradingView indicators — the complete library. No single-tool download; you get the whole database.
The honest limitation of breaker blocks
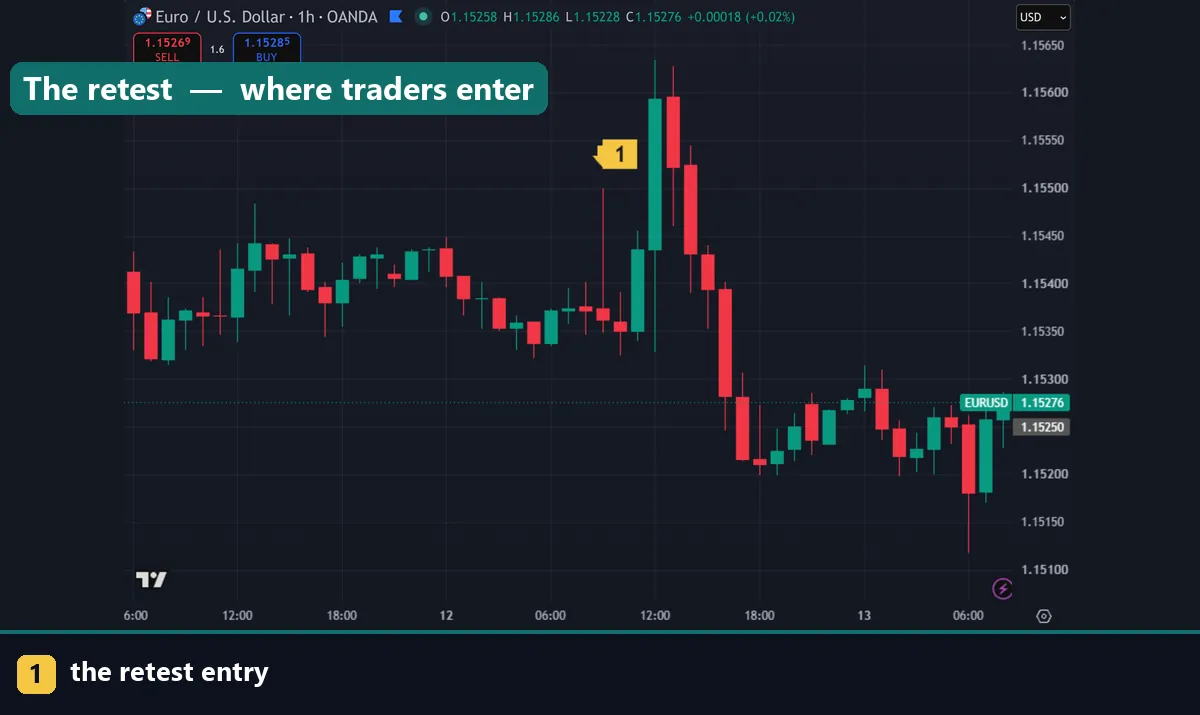
Every breaker looks obvious in hindsight. You can only label the zone after the failure has already happened. Live, with candles still forming, you cannot separate a genuine failure from ordinary noise. Several candles later the answer is clear, and by then the best entry is often gone.
Marking is discretionary too. Body or wick? A single candle or the whole cluster? Two competent traders will box different candles on the same chart, and their results will differ. No published standard settles it. That makes breaker results hard to reproduce, unlike a moving average crossover that anyone can code and test identically.
Then there is plain failure. Price cuts straight through breakers regularly, especially against the higher-timeframe direction or during major news. Treat the zone as one input among several, not as a verdict. The wider framework in our guide to trading smart money concepts puts breakers in context alongside structure and liquidity.
Common breaker block mistakes
Four errors cause most of the damage. Marking the zone before the break-and-close finishes is the first; a wick through the block proves nothing until a candle closes beyond it. Ignoring the sweep is the second, and it downgrades the setup to a mitigation block that deserves smaller size. Trading against the higher timeframe comes third, because a clean H1 breaker means little when the daily chart is driving hard the other way. Finally, cramming the stop inside the zone almost always ends the same way: stopped out, then the move runs without you.
Where to go next
Breakers make more sense once the surrounding concepts click. Read our ICT trading strategy breakdown for the full model, then brush up on how to read candlestick charts so the individual candles inside a block are readable. If you want to plot zones automatically, our walkthrough on how to install MT4 and MT5 indicators gets the tools onto your platform. For background theory, Investopedia explains the underlying the law of supply and demand at Investopedia, and Wikipedia summarises order flow trading on Wikipedia.
FAQ
What is a breaker block in simple terms?
It is an order block that broke. Price pushed back through the zone and closed on the other side, trapping the traders who entered there. The zone then flips roles, so old support acts as resistance and old resistance acts as support.
What is the difference between a breaker block and an order block?
An order block is still working; price has not broken it. A breaker has already failed and flipped. The order block acts in its original direction, while the breaker acts in the opposite one.
Is a breaker block the same as a mitigation block?
No. Both are failed order blocks that flip polarity, but a breaker requires a liquidity sweep of a prior swing before the reversal. A mitigation block reverses from a higher low or lower high with no stops taken, so most traders treat it as weaker.
Which timeframe works best for breaker blocks?
H1 and H4 give the cleanest zones for most traders, with the daily chart setting direction. Lower timeframes print far more breakers, though many are noise. Choose the higher timeframe for bias and drop down only to refine the entry.
Do breaker block indicators repaint?
Manually drawn zones do not, because you draw them after the break has closed. Automated tools vary. Some redraw zones as new swings form, so check the logic before you rely on any auto-marking indicator.
Are breaker blocks guaranteed to work?
No. Breakers fail regularly, and identifying them involves real discretion. Trading involves risk, results are not guaranteed, and past performance is not indicative of future results.

About the author
Written by Dominic Walsh, a Forex trader and MT4/MT5 indicator, Expert Advisor and script developer. Every tool on forexmt4systems.com is tested on live charts before release and ships with ready-to-use compiled MT4 (.ex4) and MT5 (.ex5) files. Learn more about the trader and developer behind this site.
How we build, test and correct every tool: Editorial & Testing Policy. Trading carries risk; see the disclaimer.