
Learning how to use the Fib retracement tool is mostly about the two anchor points. The tool itself does one thing: it divides a move you select into percentage bands. Get the anchors right and the levels line up with places price actually reacts. Get them wrong and you have decorated the chart. This guide covers the drawing sequence, the levels worth keeping, and the errors that make the tool useless.
What the tool does
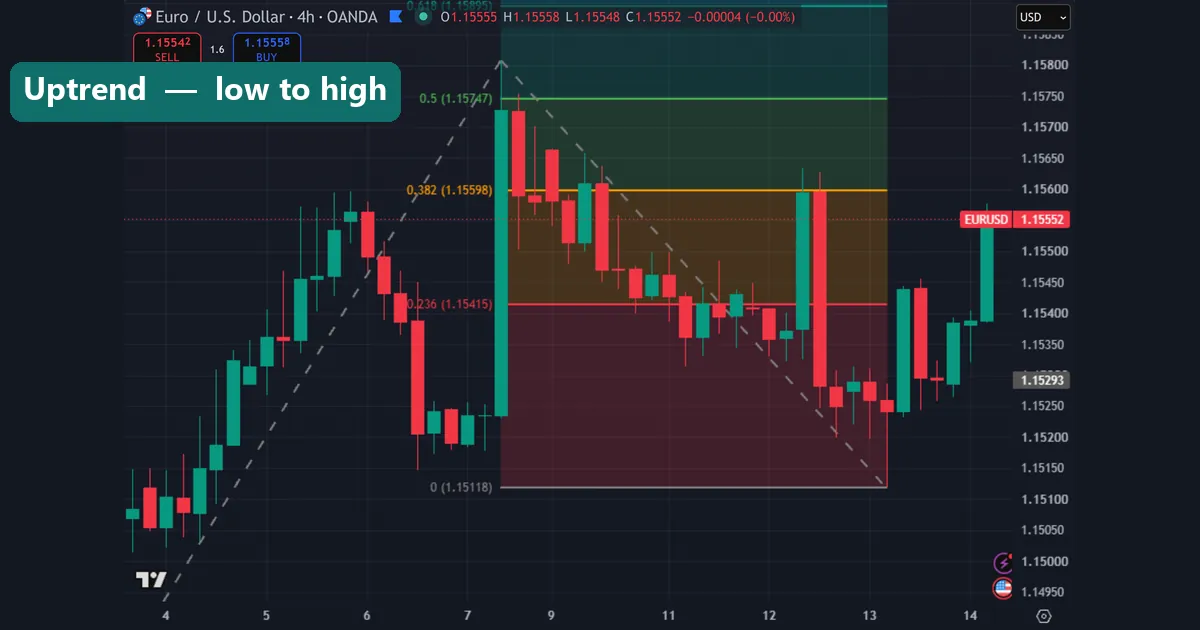
You select an impulse leg — a move from a swing low to a swing high, or the reverse — and the tool marks percentage retracements of that distance.
The standard levels are 23.6%, 38.2%, 50%, 61.8% and 78.6%. Most come from the Fibonacci sequence: divide any number by the one after it and you converge on 0.618. The 50% level is not a Fibonacci ratio at all, and it survives because traders watch the halfway point of any move.
Nothing is predicted. The tool measures a move you chose and divides it. Everything depends on choosing the right move.
How to use the Fib retracement tool step by step
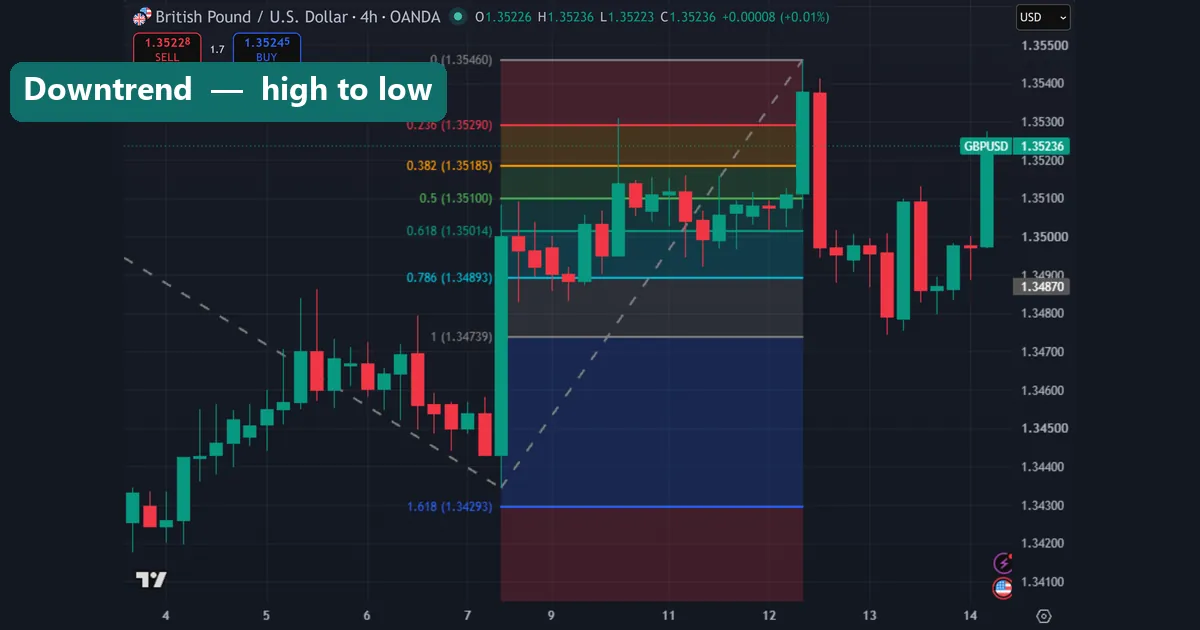
Five steps, in order.
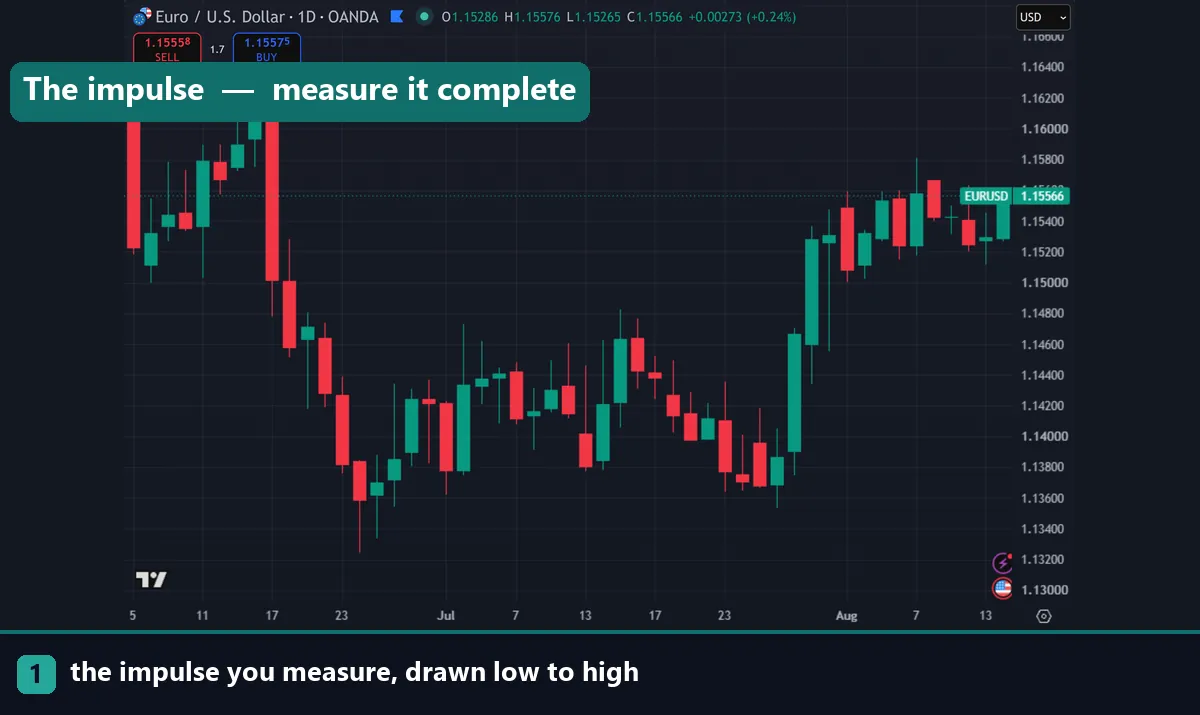
One: identify a completed impulse. You need a clear directional move that has finished and started to pull back. Retracements measured on a move still in progress shift as it extends.
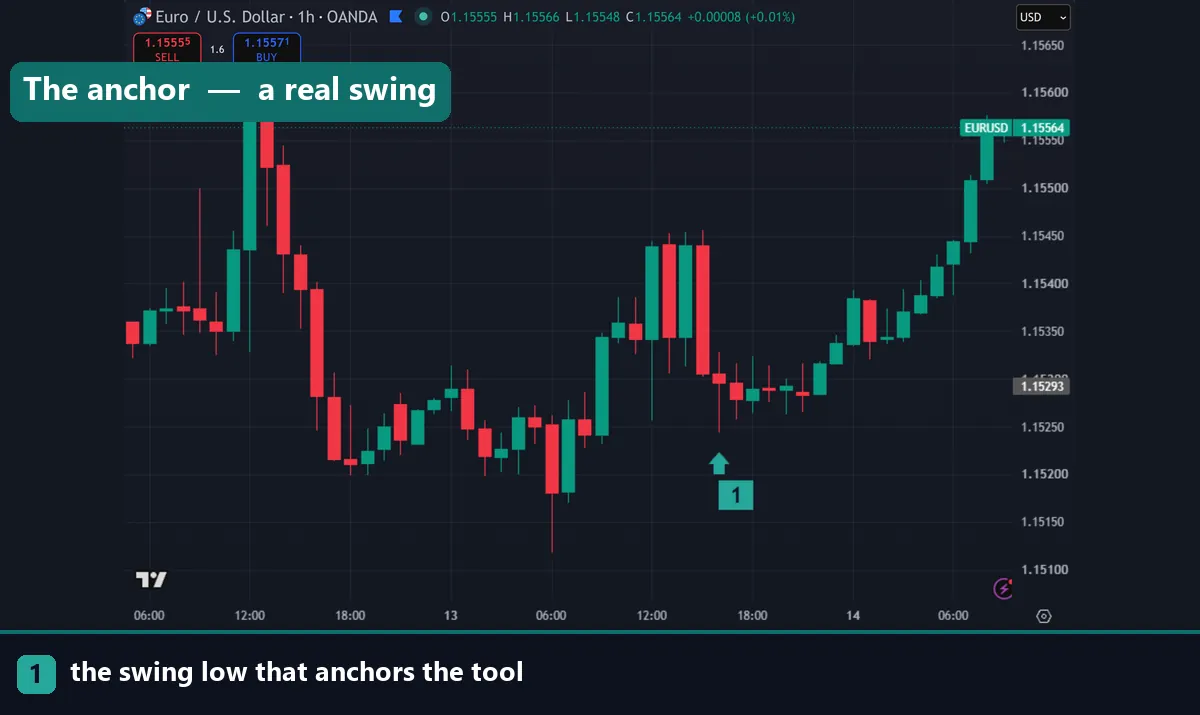
Two: find the two swing points. A swing high needs lower highs either side; a swing low needs higher lows either side. If you cannot see the pivot clearly, you are looking at noise.
Three: drag in the direction of the move. For an uptrend, start at the swing low and drag to the swing high. For a downtrend, start at the high and drag to the low. Direction matters — reversing it inverts every level.
Four: use wicks or bodies consistently. Wicks are the more common choice since they capture the full extreme. Either works; mixing them does not.
Five: leave it alone. Once drawn, do not re-anchor because price ignored a level. That habit makes the tool unfalsifiable.
Which levels matter
| Level | Depth | Typical use |
|---|---|---|
| 23.6% | Very shallow | Strong trends only; poor entry versus stop |
| 38.2% | Shallow | Common in trending markets |
| 50% | Halfway | Widely watched, not a Fibonacci ratio |
| 61.8% | Deep | The main level; start of the golden zone |
| 78.6% | Very deep | Last level before the move is erased |
| 100% | Full retrace | Structure has failed, not paused |
The band between 61.8% and 78.6% gets the most attention, and our fib golden zone guide covers why: the entry sits close to the invalidation point, which improves reward relative to risk.
Many traders remove 23.6% entirely. A level that shallow rarely offers a workable entry, and fewer lines on the chart means clearer decisions.
Why levels react at all
Worth being straight about this. No accepted mechanism explains why a ratio from a number sequence should govern price.
What can be observed is that many traders draw the same tool on the same obvious swings and place orders in the same bands. That makes the levels partly self-fulfilling, and it works best on liquid instruments with clear swings, where the most people are looking at the same thing.
The practical implication is that obvious swings beat clever ones. If you have to hunt for the anchor points, so does everyone else, and the level has no audience.
Confluence is what separates a number from a level. A retracement that overlaps a prior swing high, a pivot level or a moving average matters far more than one sitting alone. Our pivot calculation guide covers one independent source to check against.
Download the complete indicator database
Put these concepts on your charts. One email unlocks the full library of 1,380+ indicators with compiled MT4 and MT5 files, plus my TradingView scripts. No paywall, no spam, unsubscribe any time.
Get free access to my indicator database
One email unlocks 1,380+ free MT4, MT5 and TradingView indicators — the complete library. No single-tool download; you get the whole database.
Turning a level into a trade
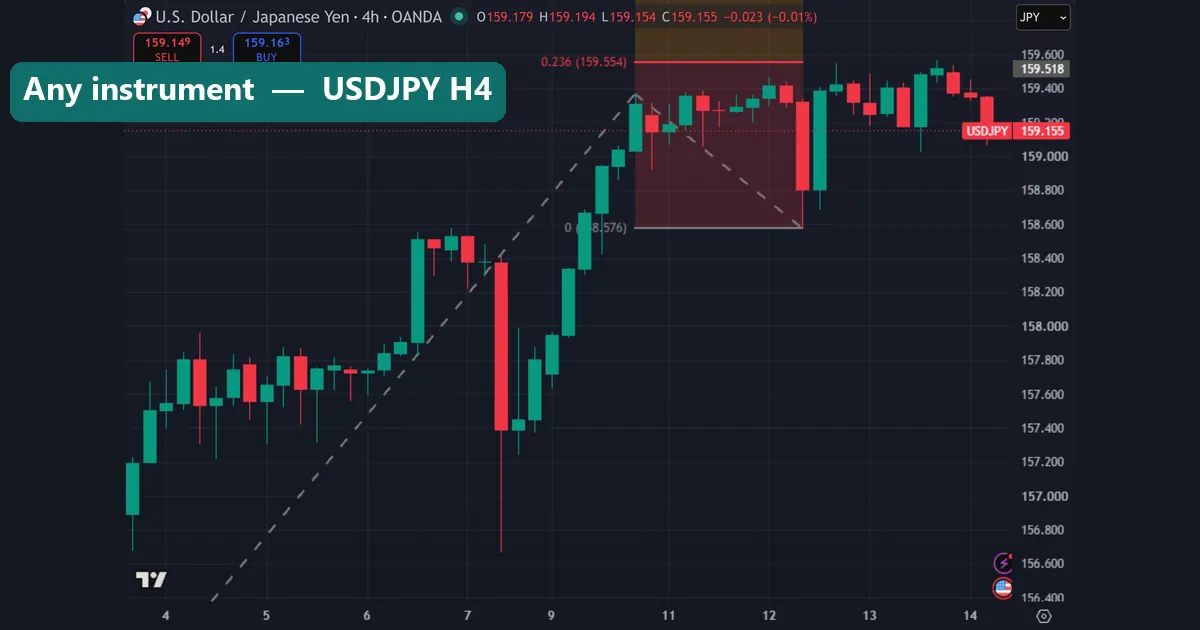
The tool marks where to pay attention. Three decisions follow.
Entry. Either a limit order inside the zone, or a confirmation entry after price reaches it and prints a rejection candle. The second costs a few pips and avoids many failures.
Stop. Beyond the swing that started the move, not just past the level you entered at. If price trades through the impulse origin, the whole retracement reading is void. Our ATR stop loss guide sets the distance from real volatility, and the position sizing calculator converts it to lots.
Target. The prior swing high is the obvious first objective. Beyond it, use extensions — our Fibonacci extension guide covers projecting those.
Timeframe matters throughout. Retracements drawn on H4 and daily swings attract far more attention than anything on M5, where swings shift constantly and the levels with them.
Common mistakes
Four repeat. Re-anchoring until the levels fit where price already turned tops the list, since it proves nothing. Drawing in the wrong direction comes second, which inverts everything. Third, traders measure a move still in progress, so the levels move as it extends. Fourth, they use every level including 23.6%, cluttering the chart until no level means anything.
Where to go next
Fibonacci is one input among several. Read the fib golden zone for the band traders watch most, then how to draw a Fibonacci extension for targets. For a measured method built on the same ratios, see harmonic pattern trading, and pivot calculation for independent levels to check confluence against. For further reading, BabyPips covers Fibonacci studies at BabyPips, and the Fibonacci number article on Wikipedia covers the sequence.
FAQ
How do I use the Fib retracement tool?
Pick a completed impulse leg, then drag from the swing low to the swing high in an uptrend, or high to low in a downtrend. The tool marks percentage retracements of that distance.
Which direction do I drag?
Always in the direction the move travelled. Low to high for an uptrend, high to low for a downtrend. Dragging the wrong way inverts every level on the chart.
Should I use wicks or bodies?
Wicks are the more common choice because they capture the full extreme. Either is defensible, so long as you apply the same rule every time rather than switching.
Which retracement levels matter most?
61.8% and 78.6%, the band known as the golden zone. They put your entry close to the invalidation point, which gives a better reward relative to risk than shallow levels do.
Why did price ignore my level?
Usually because the swing was not obvious enough for other traders to draw the same one, or because the level had no confluence with anything independent. News overrides levels entirely.
Does Fibonacci actually work?
There is no accepted mechanism, and much of the effect comes from many traders drawing the same tool on the same swings. Trading involves risk, results are not guaranteed, and past performance is not indicative of future results.

About the author
Written by Dominic Walsh, a Forex trader and MT4/MT5 indicator, Expert Advisor and script developer. Every tool on forexmt4systems.com is tested on live charts before release and ships with ready-to-use compiled MT4 (.ex4) and MT5 (.ex5) files. Learn more about the trader and developer behind this site.
How we build, test and correct every tool: Editorial & Testing Policy. Trading carries risk; see the disclaimer.