
The fib golden zone is the band between the 61.8% and 78.6% Fibonacci retracement levels. Traders watch it because a pullback that reaches this depth has corrected substantially while leaving the original trend structure intact. This guide covers where the numbers come from, how to draw the zone correctly, why the deeper band gets more attention than the shallow levels, and what it cannot tell you.
Where the fib golden zone numbers come from
The Fibonacci sequence adds each pair of numbers to get the next: 1, 1, 2, 3, 5, 8, 13, 21, 34. Divide any number by the one after it and the answer converges on 0.618. That ratio is where 61.8% comes from.
The 78.6% level is the square root of 0.618. It is not a Fibonacci ratio in the strict sense, which is why some traders use 76.4% instead, derived differently. In practice the two sit close enough that most people treat the area as a band rather than two separate lines.
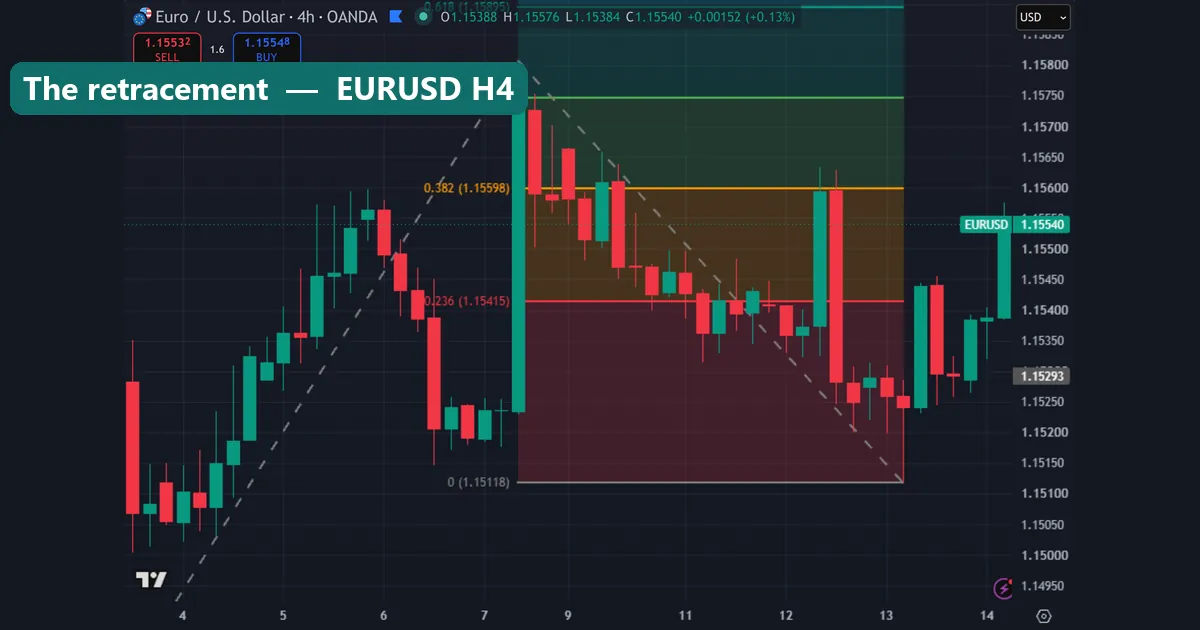
Between them lies what traders call the golden zone or golden pocket. It is a deep retracement: price has given back most of the move without erasing it.
Drawing the zone correctly
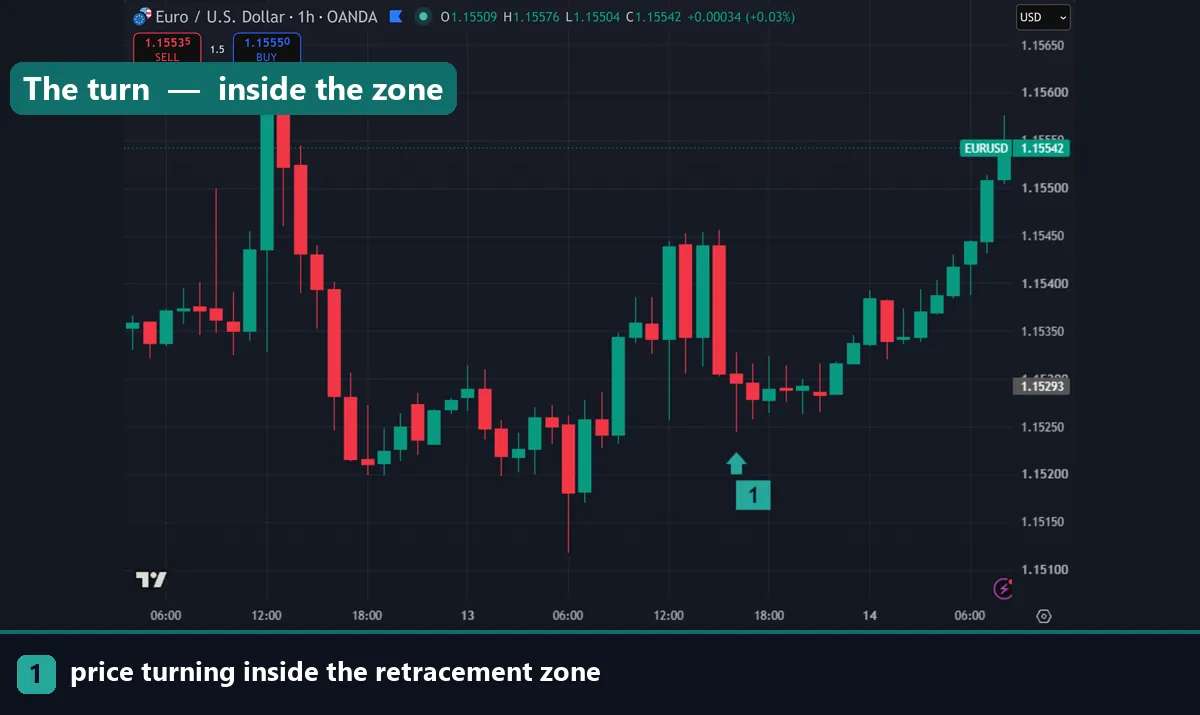
The tool measures one impulse leg, and the two anchors decide everything.
For an uptrend, drag from the swing low to the swing high. The retracement levels then appear below, showing how far a pullback has come back. For a downtrend, drag from the swing high to the swing low.
Both anchors must be genuine swing points. A swing high needs lower highs either side of it; a swing low needs higher lows. If you cannot identify the pivot without squinting, you are measuring noise.
Two errors account for most bad zones. Drawing from the wrong end inverts every level. And re-anchoring after the fact, until the zone lands where price already turned, makes the tool unfalsifiable. Our Fibonacci retracement tool guide covers the mechanics in more detail.
Why the deep band gets the attention
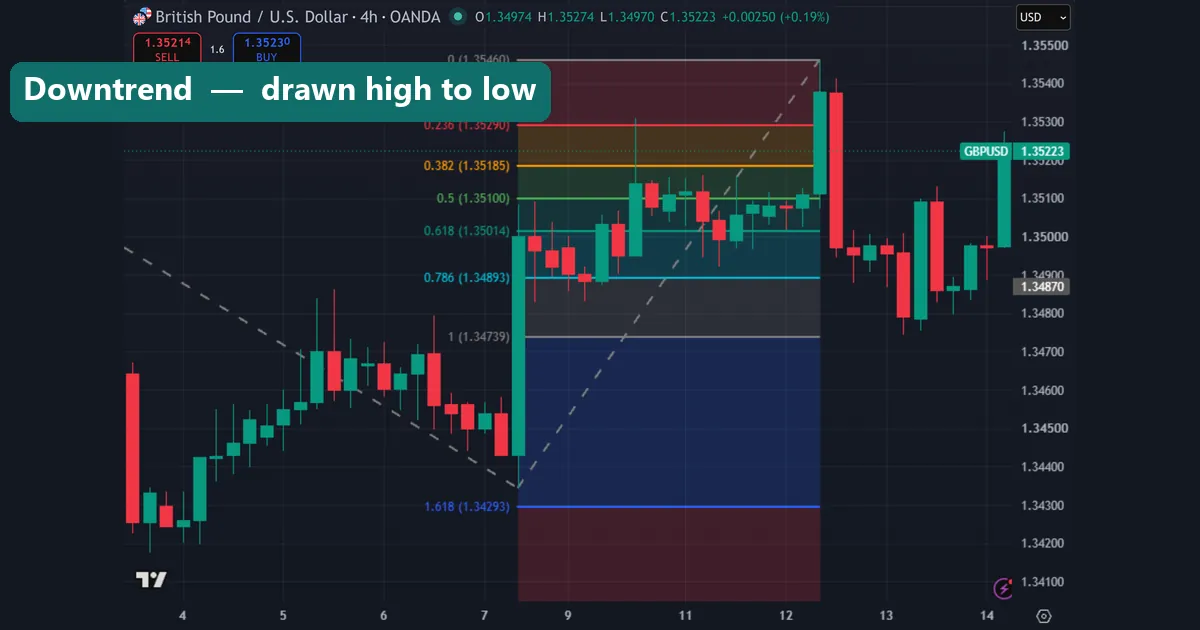
Fibonacci retracement offers 23.6%, 38.2%, 50%, 61.8% and 78.6%. The golden zone sits at the deep end, and there is a practical reason traders favour it.
A shallow pullback to 23.6% gives you a poor entry price relative to your stop, because the stop still belongs below the swing that started the move. The deeper the retracement, the closer your entry sits to that invalidation level, and the better the reward relative to risk.
The trade-off is that deeper retracements are less likely to hold. A move that gives back 78.6% is close to erasing itself, and a break beyond 100% means the structure has failed rather than paused.
So the golden zone is a compromise: deep enough for a good entry, shallow enough that the trend is probably intact. That is the whole argument, and it is a reasonable one that requires no mystical properties of the ratio.
What actually makes a zone work
Here is the part worth being honest about. There is no accepted mechanism by which a ratio derived from a number sequence should govern price.
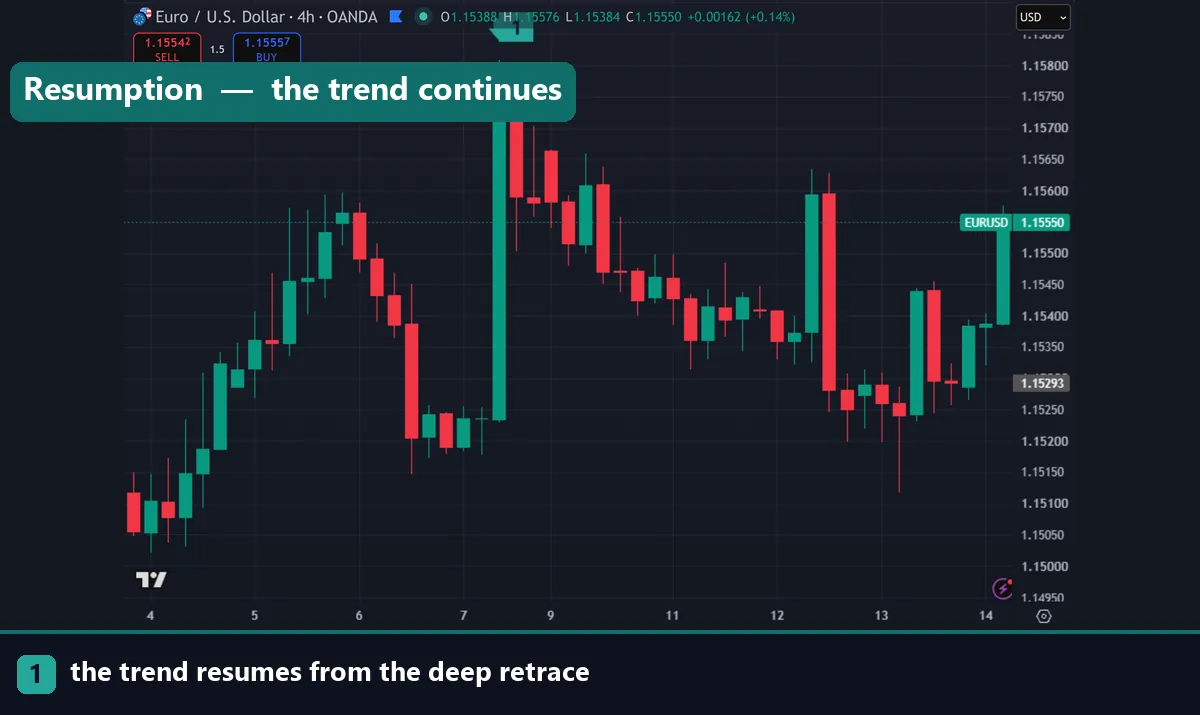
What can be observed is that many traders draw the same tool on the same obvious swings and place orders in the same band, which makes the level partly self-fulfilling. That works best on liquid instruments and clear swings, where the largest number of people are looking at the same thing.
Confluence is what turns a zone from arithmetic into a level worth trading. The golden zone matters most when it overlaps something independent: a prior swing high or low, a pivot level, a moving average, or a fair value gap. Our guides on pivot calculation and bullish FVG cover two of those.
A golden zone sitting alone in empty chart space is a number. A golden zone overlapping a prior swing low that already held twice is a level.
Download the complete indicator database
Put these concepts on your charts. One email unlocks the full library of 1,380+ indicators with compiled MT4 and MT5 files, plus my TradingView scripts. No paywall, no spam, unsubscribe any time.
Get free access to my indicator database
One email unlocks 1,380+ free MT4, MT5 and TradingView indicators — the complete library. No single-tool download; you get the whole database.
Trading the zone
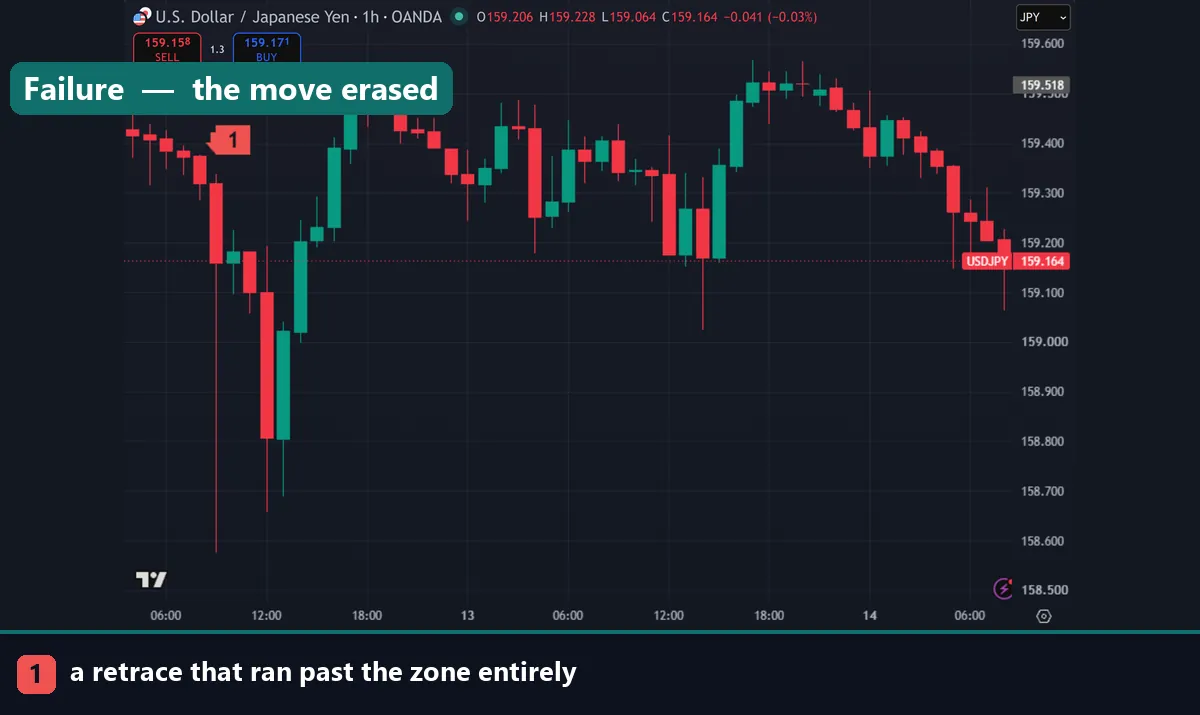
Two entry styles cover most approaches. A limit order inside the band accepts that some retracements run straight through. A confirmation entry waits for price to reach the zone and print a rejection candle, which costs a few pips and avoids many failures.
The stop belongs beyond the swing that started the move, not just below the 78.6% line. If price trades past the origin of the impulse, the structure has broken and the retracement reading is void. Our ATR stop loss guide covers setting that distance from real volatility, and the position sizing calculator converts it into lots.
For targets, the prior swing high is the obvious first objective, with Fibonacci extensions beyond it. Our extension guide covers projecting those.
Timeframe matters. Zones drawn on H4 and daily swings attract far more attention than anything on M5, where the swings are noise and the levels shift constantly.
When it fails
Deep retracements fail more often than shallow ones by definition, and two situations account for most of it.
The first is a trend that was never really a trend. Drawing retracements inside a range produces levels price crosses freely, because there is no directional structure to resume.
The second is news. A scheduled release overrides structural levels entirely, and a golden zone means nothing when a rate decision lands. Check the calendar first, as covered in our forex news factory guide.
Common mistakes
Four repeat. Re-anchoring the tool until the zone fits where price turned tops the list, and it makes the method prove nothing. Drawing from the wrong end comes second, which inverts every level. Third, traders use the zone without confluence, acting on a number alone. Fourth, they place the stop just below 78.6% rather than beyond the swing origin, and get taken out while the idea is still valid.
Where to go next
Fibonacci works best as one input among several. Read how to use the Fib retracement tool for the drawing mechanics, then how to draw a Fibonacci extension for targets. For a measured method built on the same ratios, see harmonic pattern trading, and pivot calculation for independent levels to check confluence against. For further reading, BabyPips defines Fibonacci retracement at BabyPips, and the Fibonacci retracement article on Wikipedia covers the ratios themselves.
FAQ
What is the fib golden zone?
The band between the 61.8% and 78.6% Fibonacci retracement levels. A pullback reaching this depth has corrected substantially while leaving the original trend structure intact.
Why 61.8% and 78.6%?
The 61.8% ratio comes from dividing adjacent Fibonacci numbers. The 78.6% level is the square root of 0.618, which is why some traders use 76.4% instead and treat the area as a band.
How do I draw it?
In an uptrend, drag the tool from the swing low to the swing high so the levels appear below. In a downtrend, drag from the high to the low. Both anchors must be genuine swing points.
Why do traders prefer the deeper levels?
The entry sits closer to the invalidation point, which improves reward relative to risk. Shallow retracements leave a wide gap between entry and stop, since the stop belongs beyond the swing origin.
Does the golden zone actually work?
It has no accepted mechanism, and much of its effect comes from many traders drawing the same tool on the same swings. It works best where it overlaps a level that matters independently.
Where should the stop go?
Beyond the swing that started the move, not just below the 78.6% line. A trade past the impulse origin means the structure failed. Trading involves risk, results are not guaranteed, and past performance is not indicative of future results.

About the author
Written by Dominic Walsh, a Forex trader and MT4/MT5 indicator, Expert Advisor and script developer. Every tool on forexmt4systems.com is tested on live charts before release and ships with ready-to-use compiled MT4 (.ex4) and MT5 (.ex5) files. Learn more about the trader and developer behind this site.
How we build, test and correct every tool: Editorial & Testing Policy. Trading carries risk; see the disclaimer.