
Pivot calculation takes three numbers from yesterday and turns them into seven levels for today. Yesterday’s high, low and close go into one short formula, and the output gives you a central reference plus three supports and three resistances. This guide covers the standard arithmetic, the four common variants and when each suits, plus the reason these levels work at all.
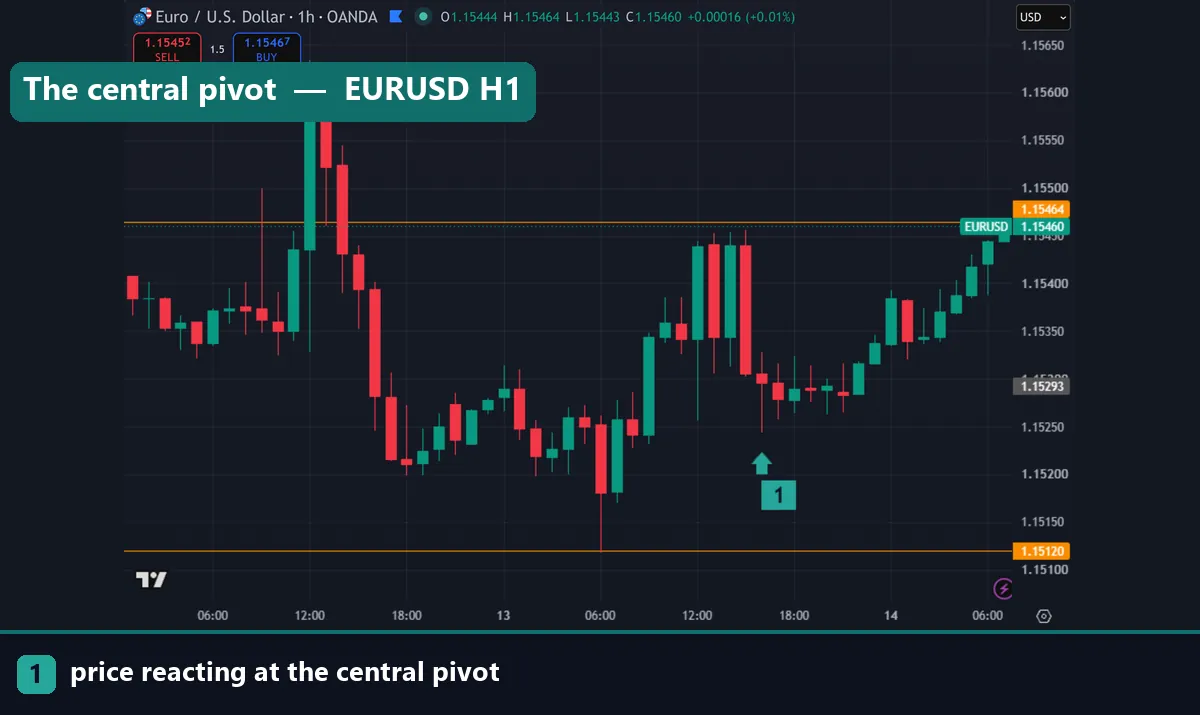
The standard pivot calculation
Everything starts with the central pivot point, which is simply the average of the previous period’s high, low and close.
PP = (High + Low + Close) ÷ 3
From that single figure the rest follow:
R1 = (2 × PP) − Low and S1 = (2 × PP) − High
R2 = PP + (High − Low) and S2 = PP − (High − Low)
R3 = High + 2 × (PP − Low) and S3 = Low − 2 × (High − PP)
Work one through. Say EURUSD printed a high of 1.1580, a low of 1.1500 and closed at 1.1540. The pivot is (1.1580 + 1.1500 + 1.1540) ÷ 3, which is 1.15400. R1 is (2 × 1.1540) − 1.1500 = 1.15800. S1 is (2 × 1.1540) − 1.1580 = 1.15000.
Notice that R1 and S1 landed on yesterday’s high and low. That is not coincidence; when the close sits in the middle of the range, the first levels reproduce the extremes. It also shows why these levels often matter — they encode the previous session’s boundaries.
Which period feeds the calculation
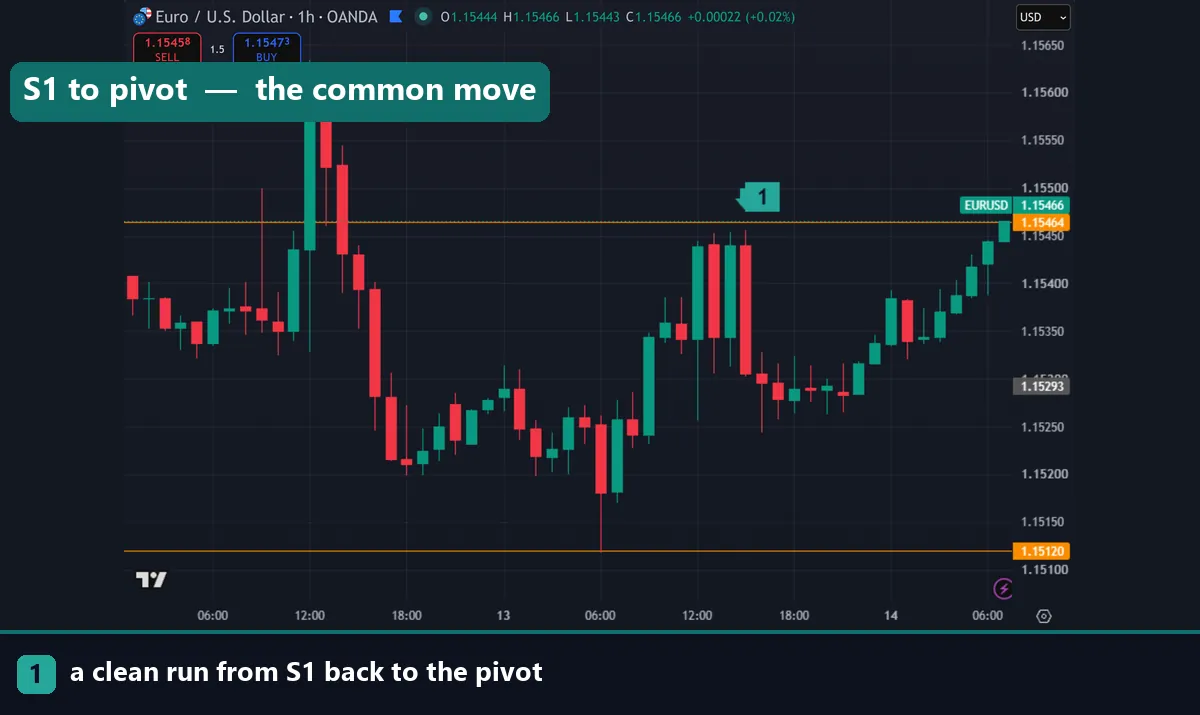
The formula is the same regardless of timeframe; what changes is which period supplies the high, low and close.
Daily pivots use yesterday’s session and are the standard choice for intraday trading. Weekly pivots use last week and suit swing trading. Monthly pivots frame longer positions.
The definition of “yesterday” is where platforms disagree. A daily pivot built on a broker whose server closes at 00:00 GMT+2 will differ from one built on the 17:00 New York close. Two traders can therefore see different pivot levels on the same pair, which is worth knowing before you decide a level failed. Our forex time zone converter guide covers the server-time issue.
The four common variants
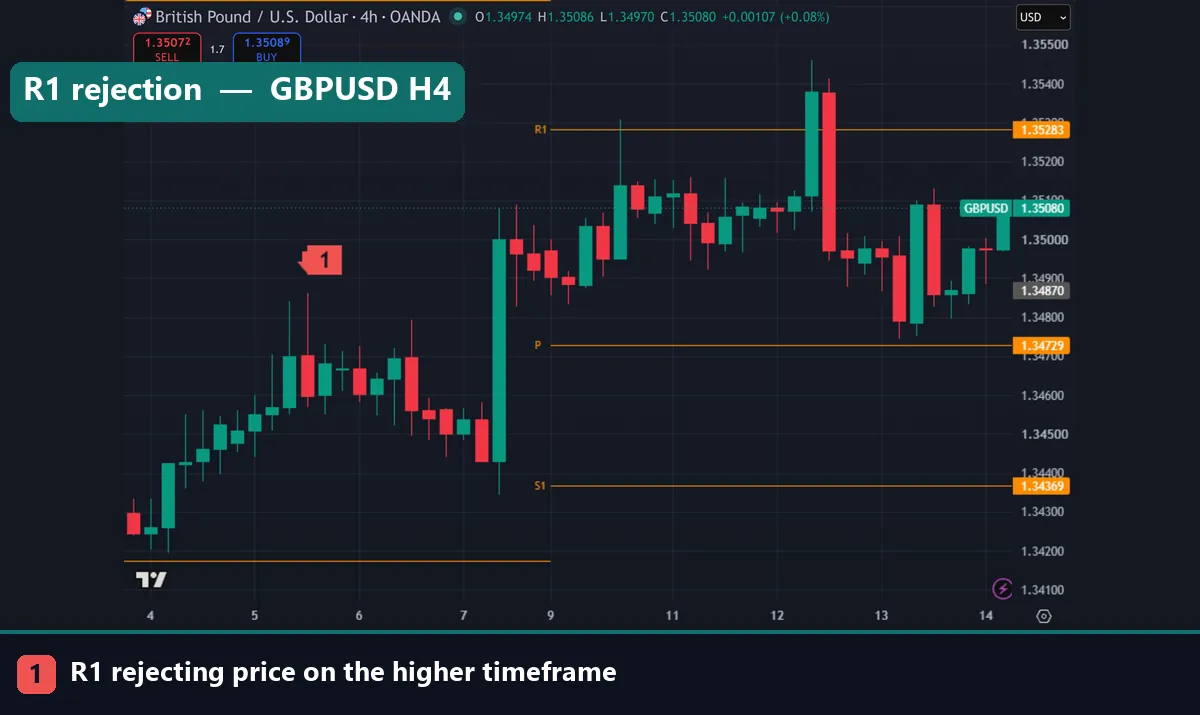
Standard pivots are the default, but three alternatives change the weighting.
| Type | How the pivot is derived | Character | Suits |
|---|---|---|---|
| Standard (Floor) | (H + L + C) ÷ 3 | Balanced, most widely watched | General intraday use |
| Fibonacci | PP as standard; levels at 38.2%, 61.8%, 100% of range | Levels cluster nearer the pivot | Traders already using Fibonacci |
| Woodie | (H + L + 2 × C) ÷ 4 | Weights the close double | Markets that trend into the close |
| Camarilla | Close plus range × a set of constants | Eight tight levels around the close | Mean-reversion inside a range |
| DeMark | Depends on close versus open | Only produces one support and one resistance | Traders wanting fewer, firmer levels |
No variant is more accurate than another; they simply distribute levels differently. Standard is the most watched, which is an argument in itself — more eyes on a level means more orders around it.
Why the levels react at all
There is nothing predictive in the arithmetic. A pivot level works when it works because a large number of participants calculate the same figure from the same public data and place orders around it.
That self-fulfilling quality is the honest explanation, and it has a useful implication: the more standard your settings, the more likely other people share your levels. Using an obscure variant on an obscure timeframe puts you on levels nobody else is watching.
It also explains why pivots work better on liquid instruments during active hours. On EURUSD during the London session the levels have an audience. On an exotic pair at 3am they do not.
Reading the levels in practice
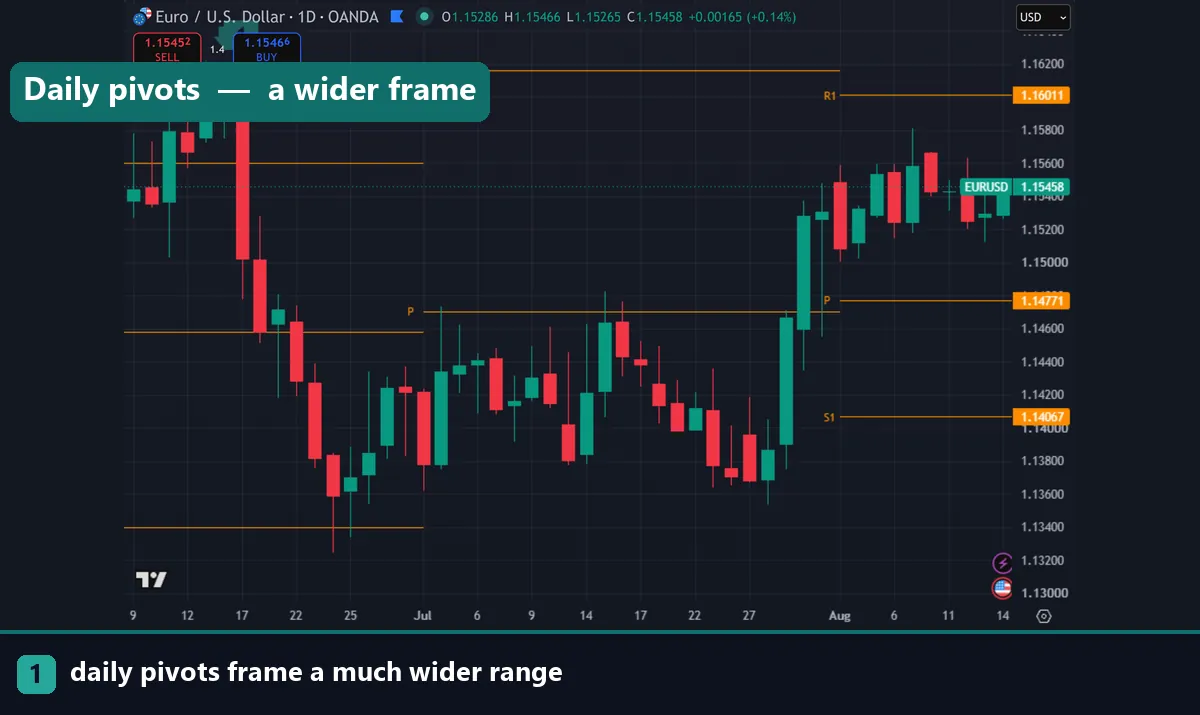
Two behaviours cover most of what traders do with pivots.
The pivot as a bias line. Traders read price above the central pivot as constructive, below it as weak. Many intraday traders take long setups only above PP and short setups only below, which is a filter rather than a signal.
Levels as reaction zones. R1 and S1 are the most frequently touched, since they sit closest. R2 and S2 come into play on trending days. R3 and S3 are rare, and a day that reaches them is unusual by definition.
Treat them as zones, not lines. Price often overshoots a level by a few pips and reverses, which is why ordinary noise clips a stop placed exactly at a pivot. Our ATR stop loss guide gives a volatility-based distance instead, and the pivot level calculator works the levels out for you.
Download the complete indicator database
Put these concepts on your charts. One email unlocks the full library of 1,380+ indicators with compiled MT4 and MT5 files, plus my TradingView scripts. No paywall, no spam, unsubscribe any time.
Get free access to my indicator database
One email unlocks 1,380+ free MT4, MT5 and TradingView indicators — the complete library. No single-tool download; you get the whole database.
What the calculation cannot do
Pivots are backward-looking arithmetic on three numbers. They know nothing about today’s calendar, which is their most important limitation.
A rate decision or payrolls release will drive price straight through levels that would have held on a quiet day. Check the calendar before you plan around pivots, as covered in our forex news factory guide.
They also assume a normal previous session. After a public holiday, a half-day, or a session with a gap, yesterday’s range is not representative and the levels derived from it carry less meaning. The same applies to Monday pivots built on a thin Friday.
Finally, a touch is not a signal. Price reaches R1 on most trending days without reversing. The level tells you where to pay attention; the decision still needs a reaction, structure, or a second piece of evidence.
Common mistakes
Four repeat. Treating a level as a line rather than a zone tops the list, and ordinary noise then clips the stop. Using non-standard variants comes second, which puts you on levels few others watch. Third, traders plan around pivots without checking the calendar. Fourth, they mix pivot sources whose daily close differs, then wonder why the levels do not match anyone else’s chart.
Where to go next
Pivots are one framework among several. Use the pivot level calculator to skip the arithmetic, then read price action trading for reading reactions at those levels. For a different way of deriving levels, see how to draw a Fibonacci extension. To add a pivot indicator to your platform, follow how to install MT4 and MT5 indicators. For further reading, Investopedia explains pivot points at Investopedia, and the pivot point article on Wikipedia lists the variant formulas.
FAQ
How do I calculate pivot points?
Add the previous period’s high, low and close, then divide by three for the central pivot. R1 is twice the pivot minus the low, S1 is twice the pivot minus the high, and R2 and S2 add or subtract the full range.
Which period should the calculation use?
Daily pivots built from yesterday suit intraday trading. Weekly pivots suit swing trading and monthly pivots suit longer positions. The formula never changes, only which period supplies the three inputs.
Why do my pivot levels differ from someone else’s?
Because your platforms close the daily candle at different times. A broker on GMT+2 produces a different “yesterday” than a chart built on the 17:00 New York close, so the three inputs differ.
Which pivot variant is best?
Standard, mainly because it is the most widely watched. The levels work partly because many traders calculate the same numbers, so an unusual variant puts you on levels with a smaller audience.
Do pivot points actually work?
They react often enough to be useful, largely because they are self-fulfilling: public data, one public formula, many traders placing orders in the same places. They carry no predictive power on their own.
Can I trade using pivot levels alone?
They mark where to pay attention rather than when to act, so pair them with a reaction or structure. Trading involves risk, results are not guaranteed, and past performance is not indicative of future results.

About the author
Written by Dominic Walsh, a Forex trader and MT4/MT5 indicator, Expert Advisor and script developer. Every tool on forexmt4systems.com is tested on live charts before release and ships with ready-to-use compiled MT4 (.ex4) and MT5 (.ex5) files. Learn more about the trader and developer behind this site.
How we build, test and correct every tool: Editorial & Testing Policy. Trading carries risk; see the disclaimer.