
Smart-money teaching splits a session into three acts: a quiet build, a fake move that traps breakout traders, and the real drive. Also, AMD Cycle Mapper turns that idea into an accumulation manipulation distribution indicator with measurable rules. It flags compression against a 50-bar ATR average, watches for a wick that pierces the 20-bar range by 0.1 ATR, then waits for a body of 0.6 ATR back through the range.
It is free and open source. Indeed, you can add it to any chart from the AMD Cycle Mapper script page on TradingView, and the full Pine source is published there for you to read.
What AMD Cycle Mapper plots on the price chart
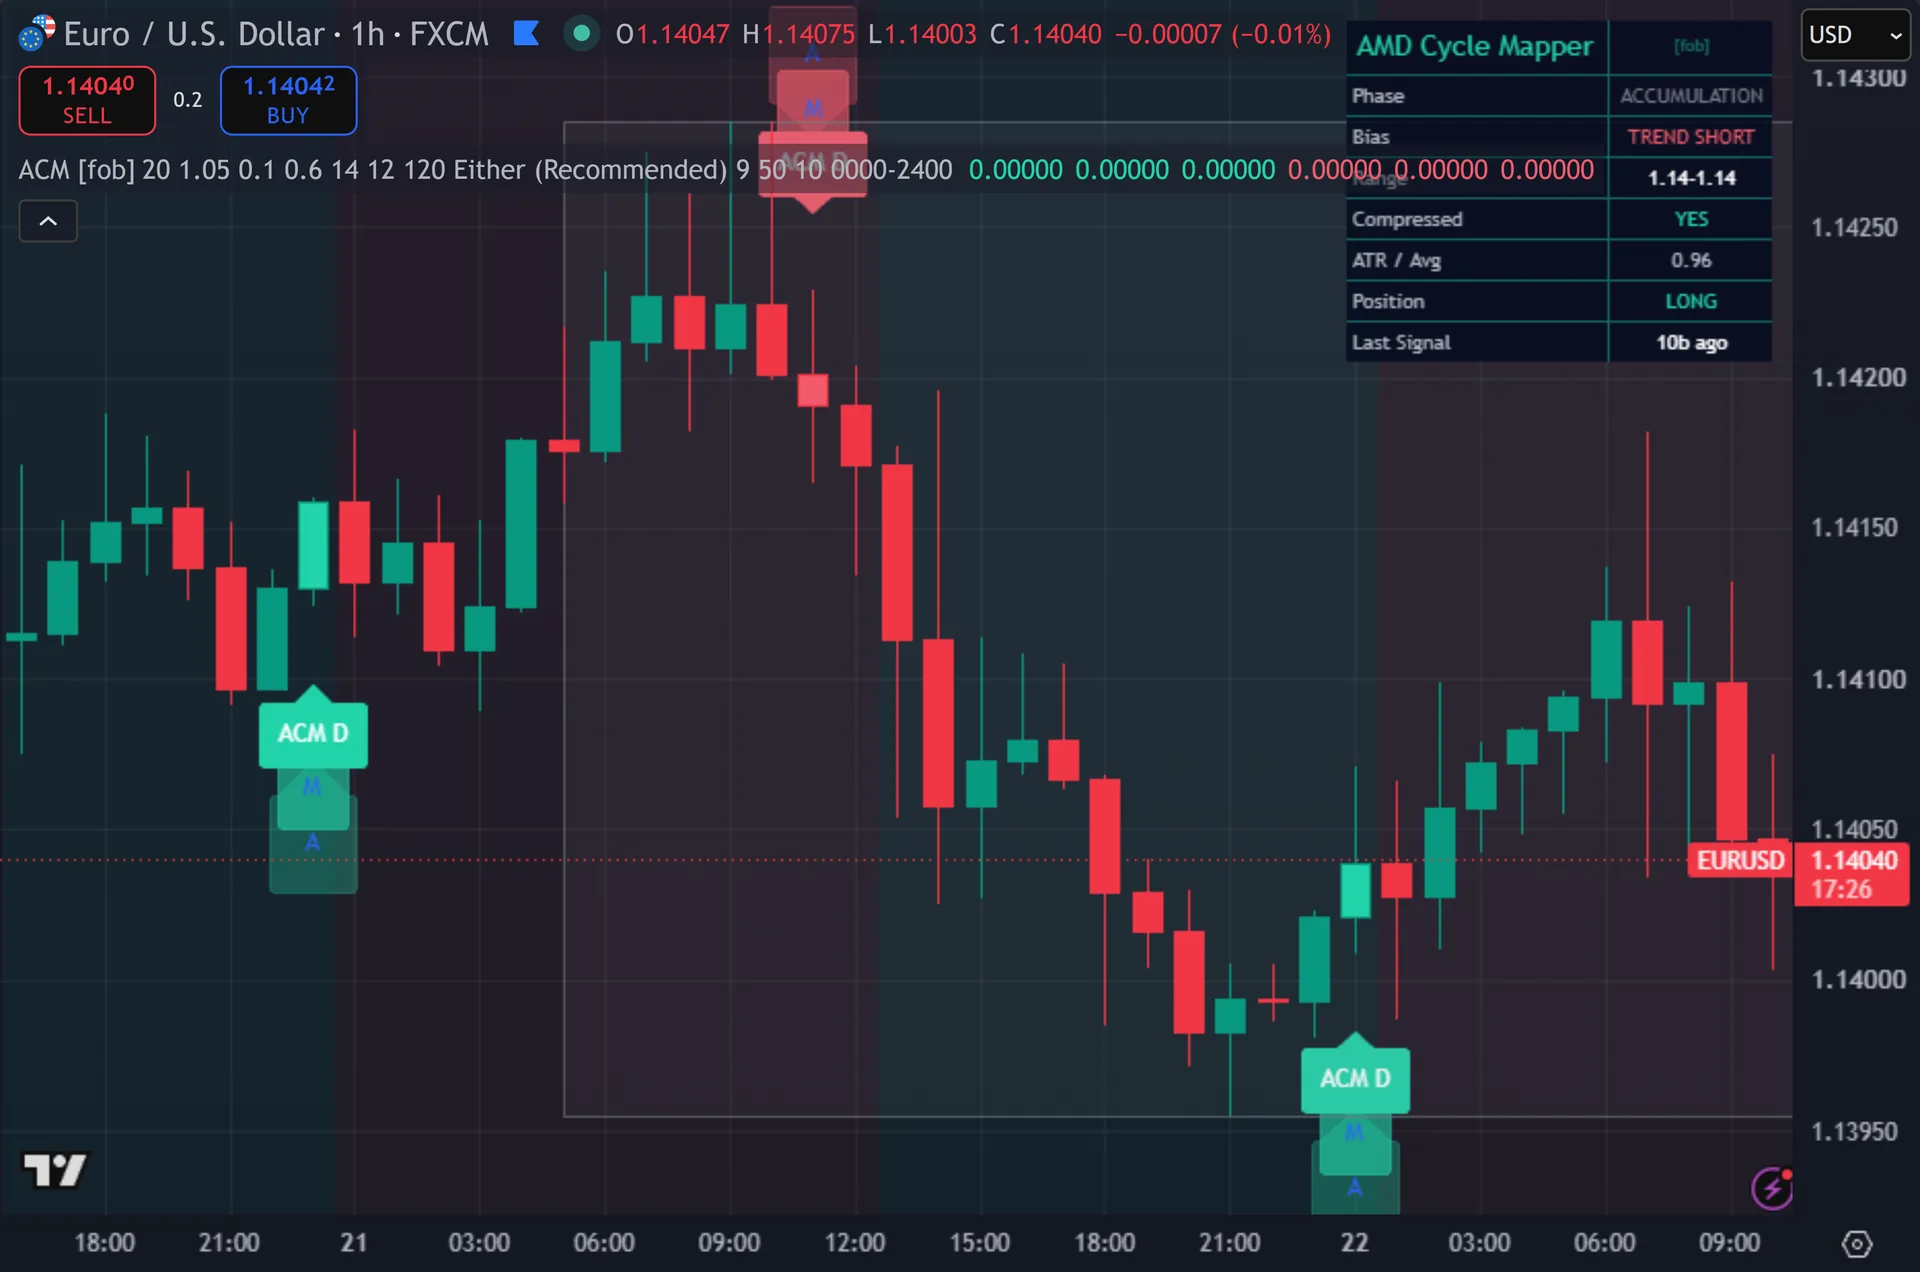
The chart background carries the state. Still, grey shading marks accumulation, orange marks a manipulation sweep, and a faint buy or sell tint marks an active bias. A grey box outlines the 20-bar accumulation range when that phase opens. Thus, signals print as stacked labels below or above the bar, tagged A, M and ACM D, and the script colours the signal bar itself. A top-right dashboard reports the live phase, whether the bias came from AMD or the trend EMA, the latched range, compression status, the ATR-to-average ratio, the last position side and the bar count since the last signal.
How AMD Cycle Mapper is built
Mapping the three phases
A phase variable drives everything. It starts idle. The script computes ATR over 14 bars and compares it to its own 50-bar average. Hence, when ATR sits below 1.05 times that average, the phase moves to accumulation and the script latches the current 20-bar high and low as the range.
Manipulation comes next. Next, a bar that trades above the latched high by more than 0.1 ATR moves the phase to swept-high. A bar that trades below the latched low by the same margin moves it to swept-low. Then, the script stamps the bar index at that moment.
Distribution has to answer within 12 bars. Yet, after a swept high, the script wants a down bar whose body measures at least 0.6 ATR and whose close lands back below the range high. After a swept low it wants the mirror image. Truly, if nothing qualifies inside that 12-bar window, the phase resets to idle and the search starts over.
From phase to signal
Phases set a bias, not an entry. Plainly, a displacement bar arms the bias in its own direction. With Arm Bias on Manip Sweep on by default, a sweep alone also arms it – a swept low arms long, a swept high arms short. Also, the bias then expires after 120 bars without a signal.
When no AMD event holds the bias, a 50-period EMA supplies a fallback direction. Indeed, close above means long, close below means short. The dashboard labels this honestly, showing TREND LONG rather than AMD LONG, so you can see which engine produced the current bias.
Entry fires on whichever comes first, the displacement bar or a close crossing the 9-period EMA in the bias direction. Still, three gates apply: the optional session window, a 10-bar cooldown, and barstate.isconfirmed. Each signal then clears the bias and resets the phase to idle, so the engine re-arms for fresh structure instead of holding one regime.
How to read the signals
Start with the Bias row. Thus, AMD LONG or AMD SHORT means a real cycle event armed the direction. TREND LONG or TREND SHORT means the AMD machine sat idle and the 50-EMA filled the gap. Hence, those two are not the same setup, and the dashboard is the only place that difference shows.
The background tint gives you the same reading at a glance. Next, grey means the script found compression and latched a range. Orange means a sweep has happened and the 12-bar clock is running. Then, a coloured tint means a bias is live.
Switch Signal Trigger to Displacement Only if you want the strict version. Yet, that drops the EMA reclaim entries and leaves just the displacement bars, which cuts the signal count sharply. Turning off Use Trend Fallback narrows it further, to AMD events alone.

Every AMD Cycle Mapper setting explained
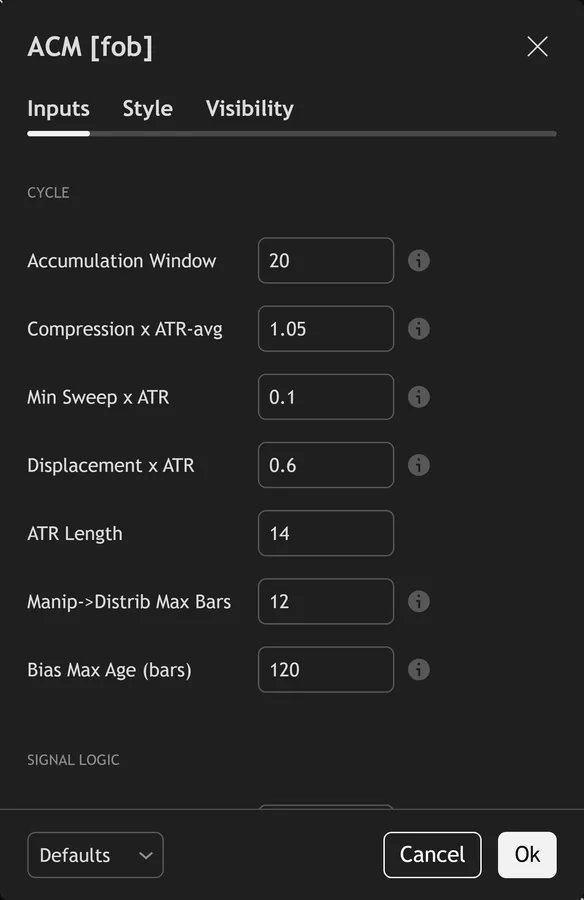
The script exposes 21 inputs, grouped in the settings panel exactly as shown below. Defaults are the published values.
Cycle
| Setting | What it does | Default | Range |
|---|---|---|---|
| Accumulation Window | Bars used to measure the consolidation range. | 20 | 5 to 100 |
| Compression x ATR-avg | Range ATR must be below k x its 50-bar average to qualify as accumulation. Higher = looser. | 1.05 | 0.3 to 1.5 |
| Min Sweep x ATR | Manipulation wick must pierce the range by k x ATR. | 0.10 | 0.0 to 2.0 |
| Displacement x ATR | Distribution body must be >= k x ATR. | 0.6 | 0.2 to 5.0 |
| ATR Length | Sets the atr length used in the calculation. | 14 | 5 to 50 |
| Manip->Distrib Max Bars | Distribution must confirm within this many bars of manipulation. | 12 | 1 to 30 |
| Bias Max Age (bars) | Stale AMD bias is cleared after this many bars without a signal, so the engine can re-arm on fresh structure. | 120 | 10 to 500 |
Signal Logic
| Setting | What it does | Default | Range |
|---|---|---|---|
| Signal Trigger | Either = fires on whichever happens first – displacement bar OR EMA reclaim while bias is active. | Either (Recommended) | Either (Recommended), Displacement Only, EMA Reclaim Only |
| Entry Reclaim EMA | Close-cross of this EMA in the bias direction times the entry. | 9 | 2 to 50 |
| Arm Bias on Manip Sweep | On = a manipulation sweep alone arms the reversal bias (more signals). Off = require full distribution. | on | on / off |
| Trend Fallback EMA | When no AMD event has armed a bias, price vs this EMA provides a fallback direction. | 50 | 10 to 300 |
| Use Trend Fallback | On = trade the trend-EMA bias when AMD bias is neutral; Off = AMD events only. | on | on / off |
| Cooldown Bars | Sets the cooldown bars used in the calculation. | 10 | 1 to 200 |
Filters
| Setting | What it does | Default | Range |
|---|---|---|---|
| Restrict to Session | Toggles restrict to session on the chart. | off | on / off |
| Session Window | Controls session window. | 0000-2400 |
Visual
| Setting | What it does | Default | Range |
|---|---|---|---|
| Show Accumulation Box | Toggles show accumulation box on the chart. | on | on / off |
| Show Dashboard | Toggles show dashboard on the chart. | on | on / off |
| Show 3-Layer Glow | Toggles show 3-layer glow on the chart. | on | on / off |
| Buy Color | Colour used for buy color. | #22d3aa | |
| Sell Color | Colour used for sell color. | #f15b6c | |
| Dashboard BG | Colour used for dashboard bg. | color.new(#040b1f, 15) |
Alerts built into AMD Cycle Mapper
The script ships 15 alert conditions. Truly, open the alert dialog on the chart, pick the indicator as the condition source, then choose the event you want. Alerts fire on the close of the bar, so they follow the same confirmed-bar rule the on-chart signals use.
- ACM Buy
- ACM Sell
- ACM Any Signal
- ACM Accumulation
- ACM Manip High
- ACM Manip Low
- ACM Distrib Up
- ACM Distrib Down
- ACM Compression
- ACM Cycle Reset
- ACM Any Manip
- ACM Any Distrib
Other markets and timeframes
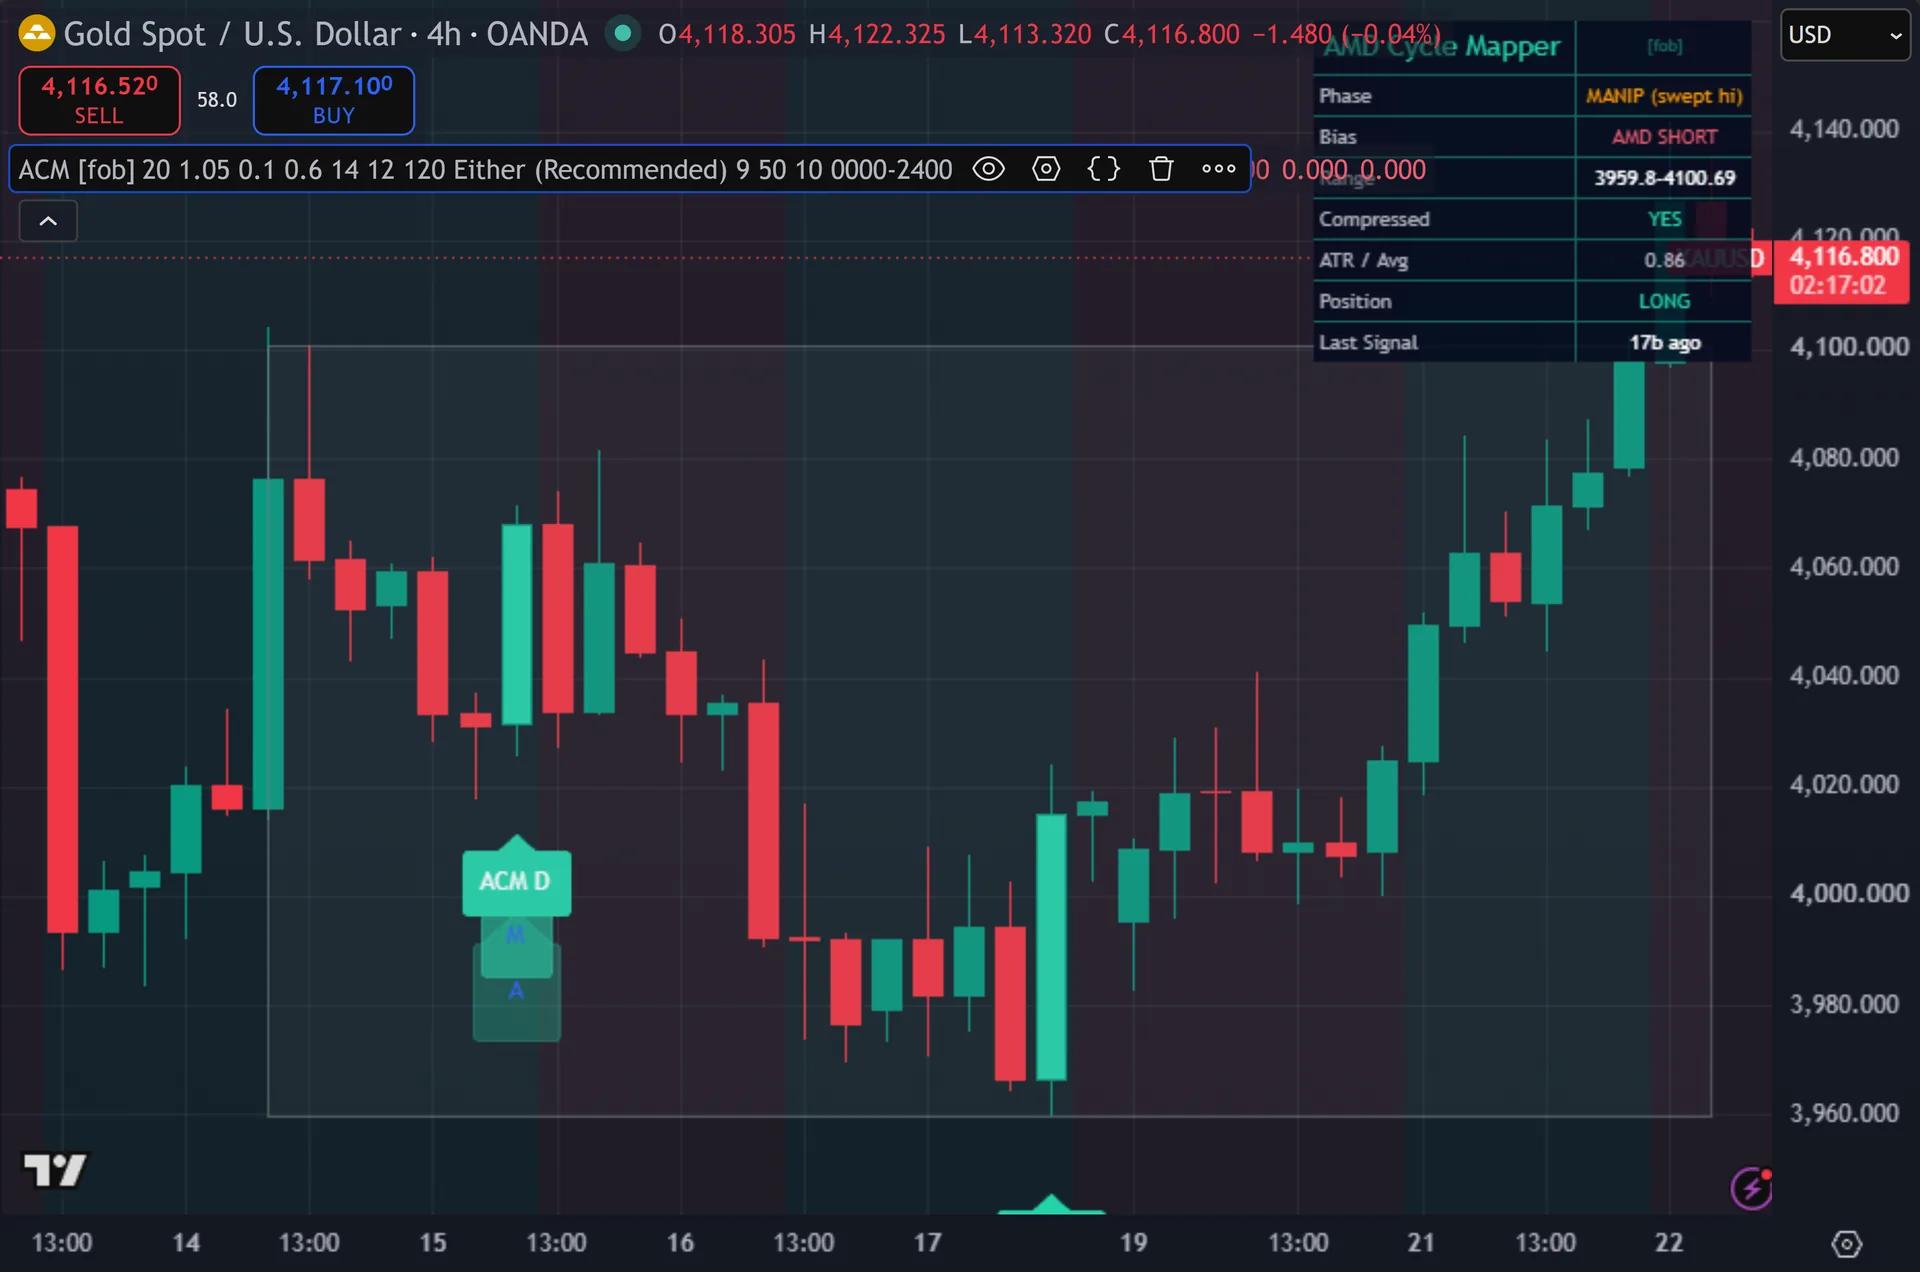
The cycle logic uses no fixed prices. Plainly, compression compares ATR to its own average, the sweep needs 0.1 ATR and the displacement body needs 0.6 ATR, so a currency pair, gold, an index and a crypto chart all read on the same scale. One input does depend on the venue: the session window uses clock times in the chart’s exchange timezone. It stays off by default. Turn it on only when you know the trading hours for that symbol.
Limitations worth knowing
The default settings run permissive. Also, with trend fallback on and the bias arming on a sweep, plenty of signals amount to a 9-EMA cross in the direction of the 50-EMA. They are not full accumulation-manipulation-distribution cycles. Indeed, read the dashboard before treating any mark as an ICT-style setup.
Phase tracking is single-threaded. Still, the script holds one range and one phase at a time, so it cannot follow a daily accumulation and an intraday one at once. It also pulls no higher-timeframe data. Thus, what you see comes from the chart timeframe only.
There is no exit logic here. Hence, the Position row simply remembers the last signal side until the next one arrives. It marks no trade, carries no stop or target, and the script never checks whether a move followed.
Get AMD Cycle Mapper on TradingView
Open AMD Cycle Mapper on TradingView
If you also trade MetaTrader, the MT4 and MT5 indicator library is available below.
Get the complete indicator library
One email unlocks the full MT4 and MT5 indicator library. Next, this TradingView script stays free on TradingView – the button above adds it to your chart.
Using it alongside MetaTrader
Adding a script on TradingView takes one click, so there is no install step here. Then, if you want the same idea on MetaTrader, the MT4 and MT5 indicator installation guide walks through copying files into the data folder and attaching them to a chart. You can also browse the full MetaTrader indicator library, the MT4 indicators section, or the other free TradingView scripts published on this profile. For related chart tools see the MT5 indicators section and the forex trading strategies guides.
External references
- Accumulation/distribution index on Wikipedia
- Accumulation/Distribution at Investopedia
- The Wyckoff Method A Tutorial at StockCharts ChartSchool
Frequently asked questions
What do accumulation, manipulation and distribution mean in this script?
Each phase has a coded definition. Yet, accumulation means ATR below 1.05 times its 50-bar average, with the 20-bar high and low latched as the range. Manipulation means a bar piercing that range by more than 0.1 ATR. Truly, distribution means a body of at least 0.6 ATR closing back through the range within 12 bars.
Does the AMD Cycle Mapper repaint?
Signals do not. Plainly, both the buy and sell conditions require barstate.isconfirmed, so a label appears only after the bar closes. The background tint and the phase row do update intrabar, since they describe the state as it forms.
Can I use it without the trend fallback?
Yes. Also, turn off Use Trend Fallback and the bias comes from AMD events alone. Set Signal Trigger to Displacement Only as well and the script fires strictly on displacement bars. Expect far fewer marks.
Which timeframe suits the AMD idea best?
Intraday charts fit the session-cycle concept most naturally, and M15 to H1 gives a range enough bars to compress. Indeed, the maths runs on any timeframe though. On very fast charts, raise the cooldown above 10 bars to space signals out.
How much should I rely on this indicator?
Treat it as one input, not a decision. Still, it is a chart analysis tool, not trading advice. Test it on your own markets and timeframes before relying on it. Results are not guaranteed; past performance is not indicative of future results.

About the author
Written by Dominic Walsh, a Forex trader and MT4/MT5 indicator, Expert Advisor and script developer. Every tool on forexmt4systems.com is tested on live charts before release and ships with ready-to-use compiled MT4 (.ex4) and MT5 (.ex5) files. Learn more about the trader and developer behind this site.
How we build, test and correct every tool: Editorial & Testing Policy. Trading carries risk; see the disclaimer.