
Three anchors, one score. Also, anchor Storm Detector works as an anchored VWAP indicator TradingView traders can use to time volatility expansion. It resets a daily, a weekly and a monthly VWAP at each new period. Then it watches for the close breaking two or more of them on the same bar while ATR expands against its own baseline. A 0 to 100 storm score grades the result.
It is free and open source. Indeed, you can add it to any chart from the Anchor Storm Detector script page on TradingView, and the full Pine source is published there for you to read.
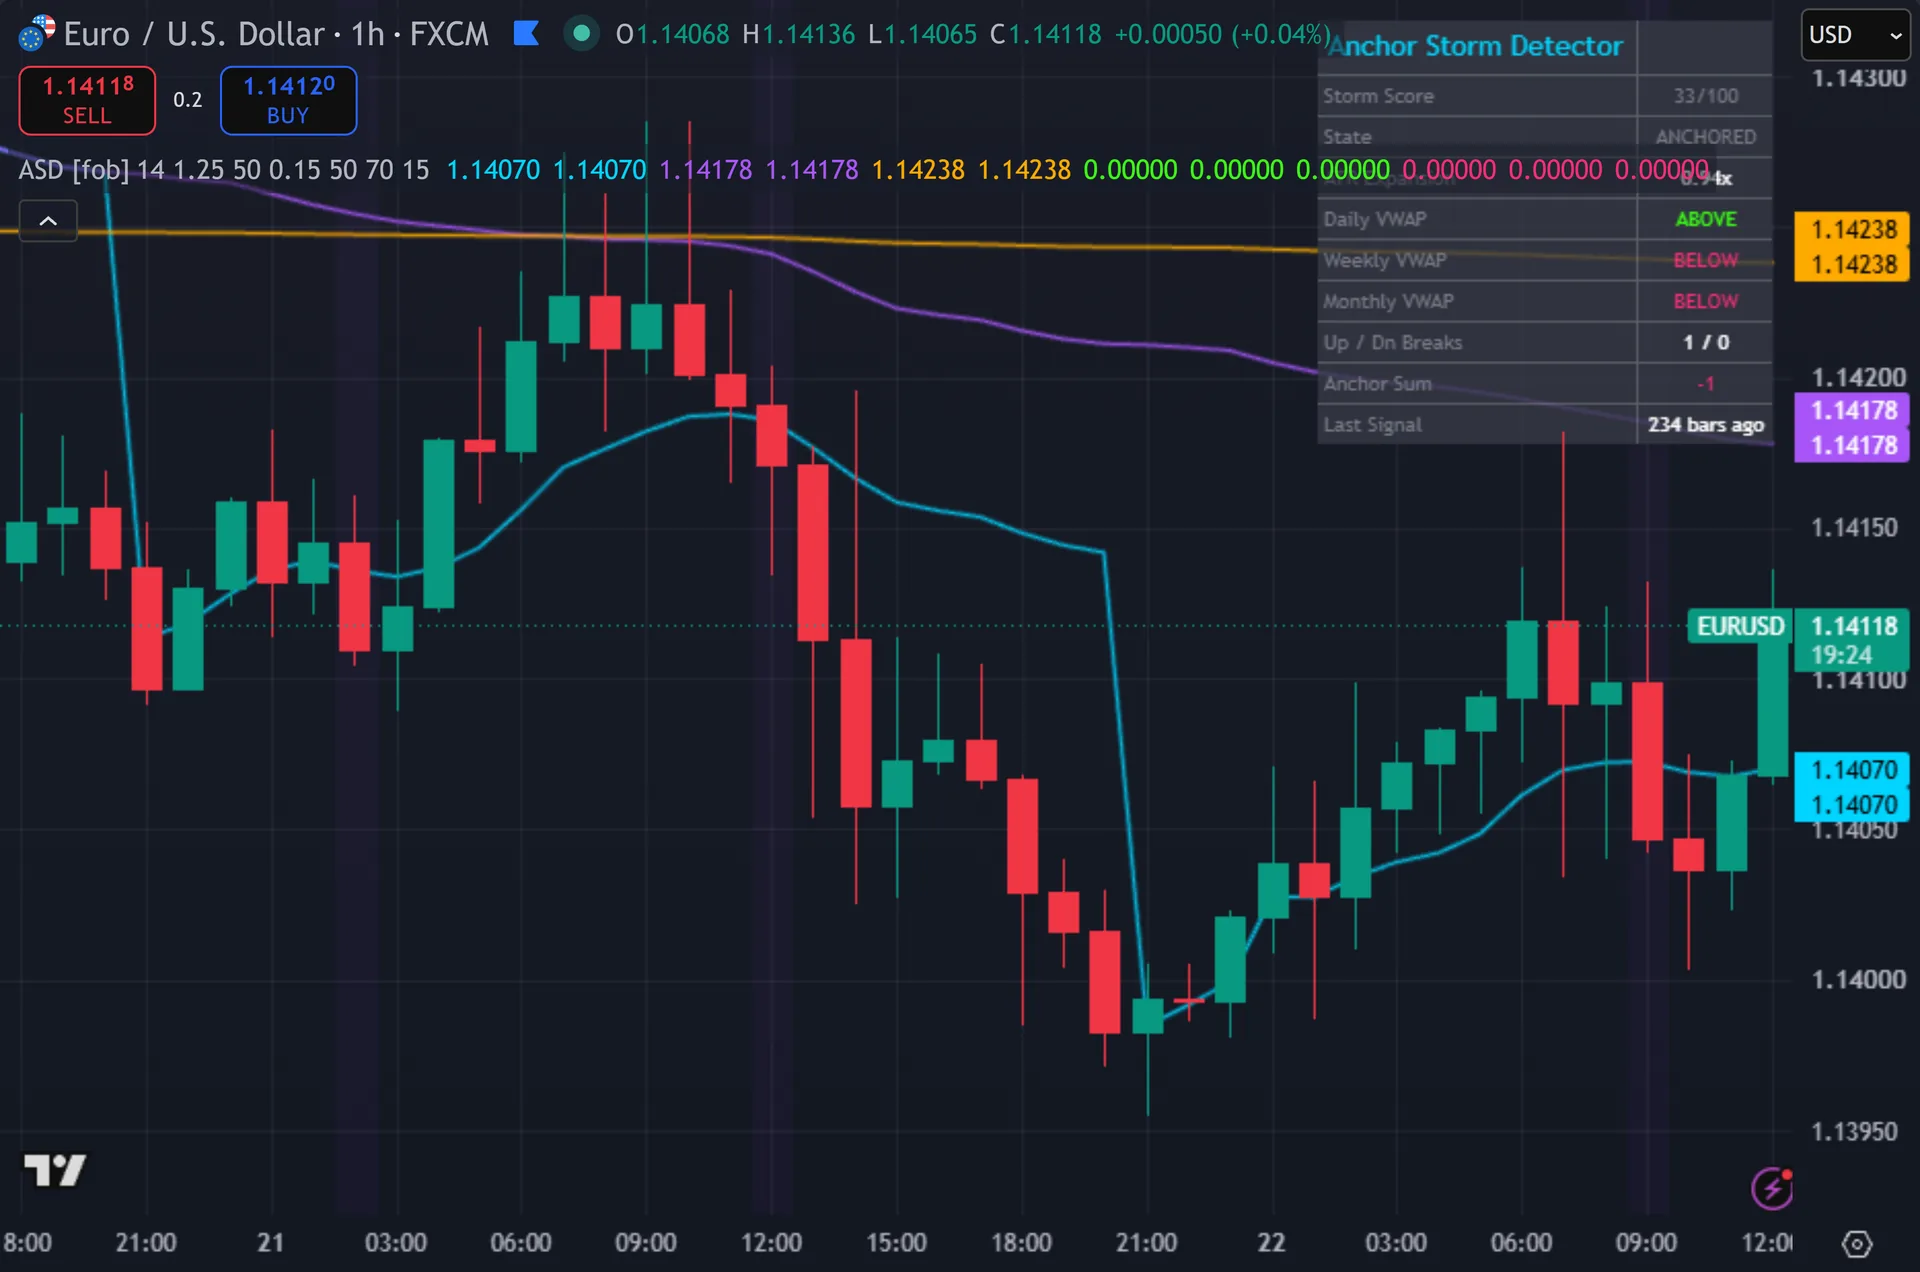
What Anchor Storm Detector plots on the price chart
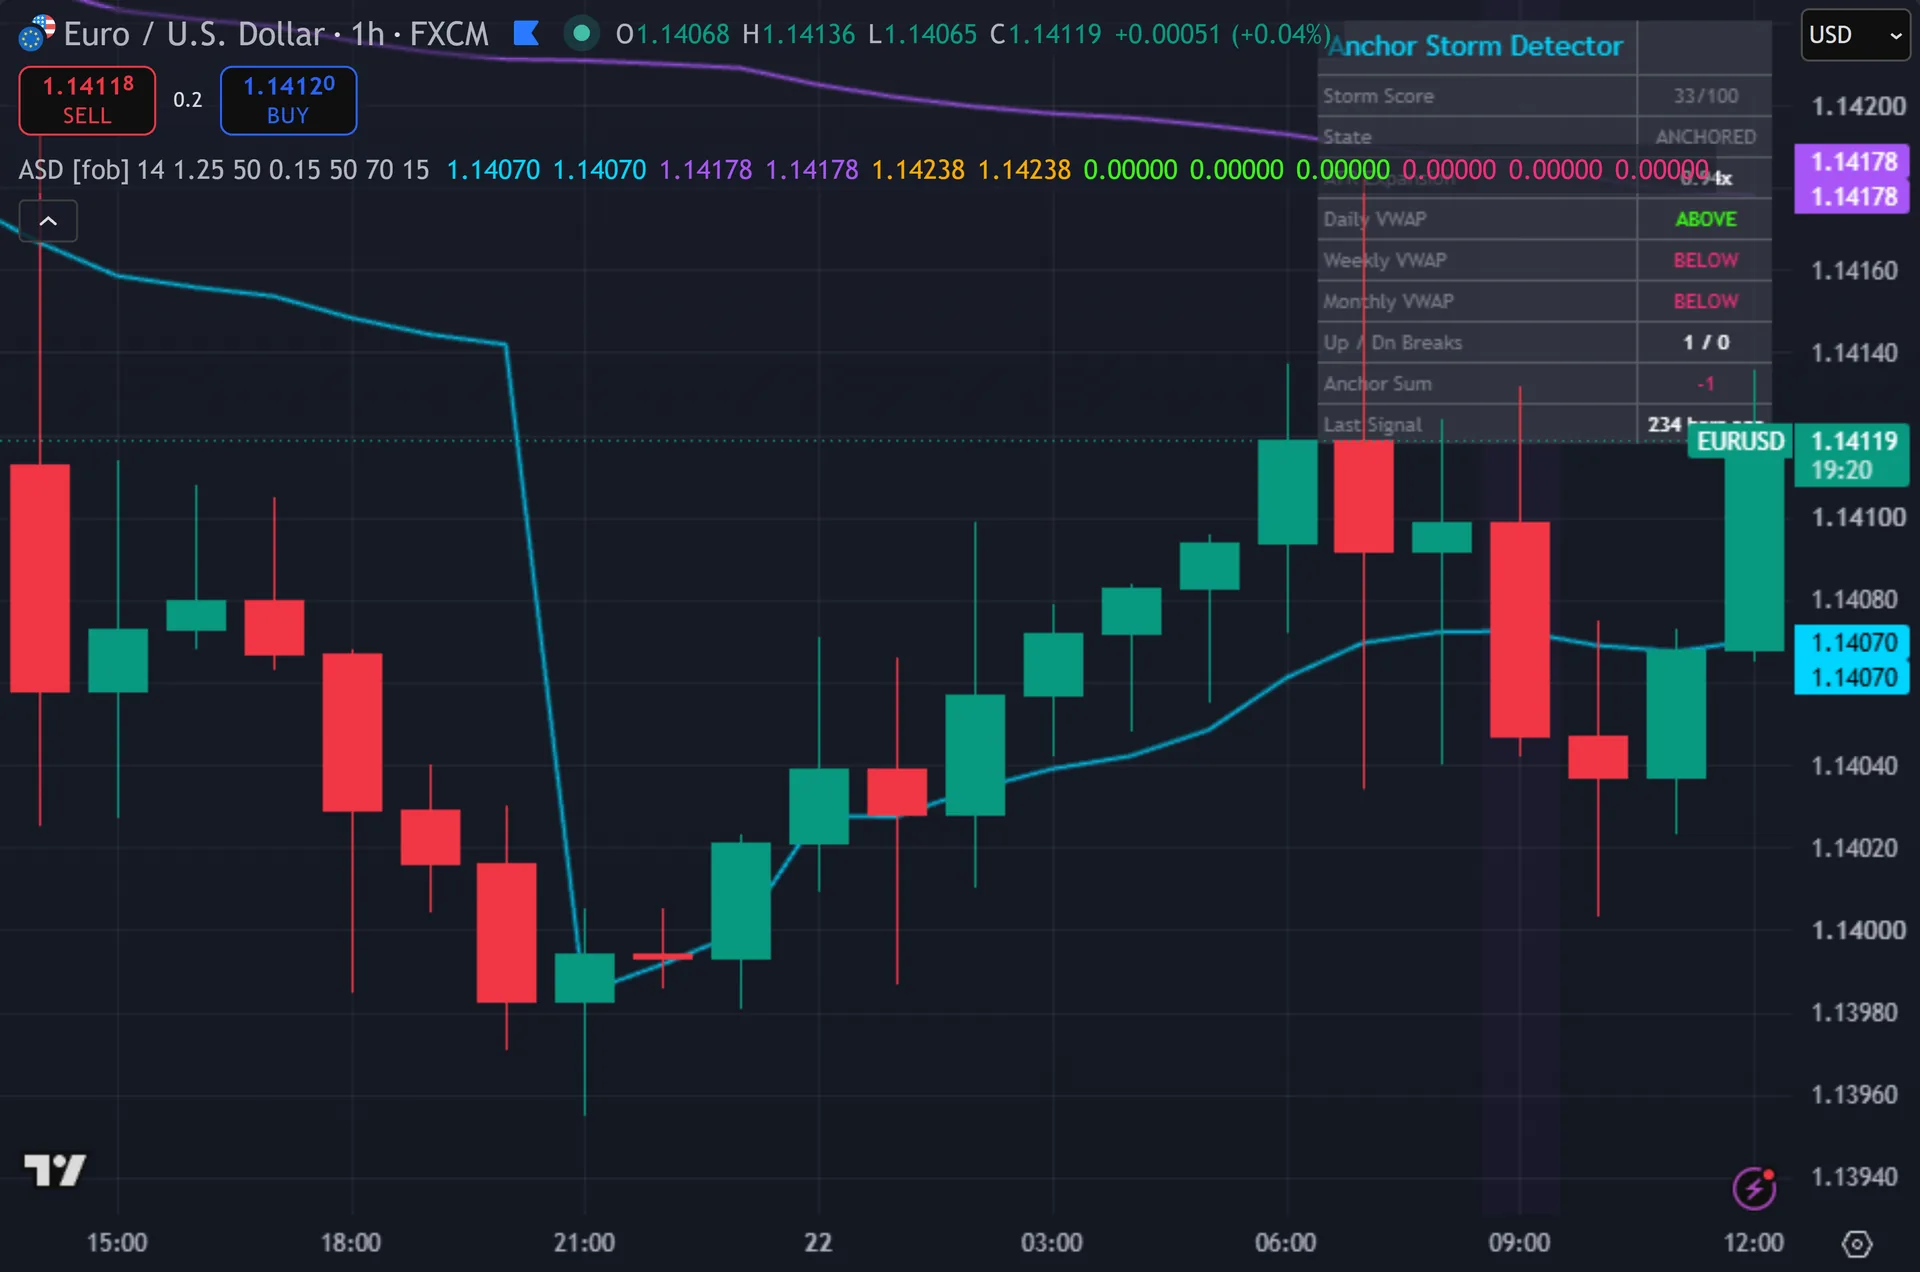
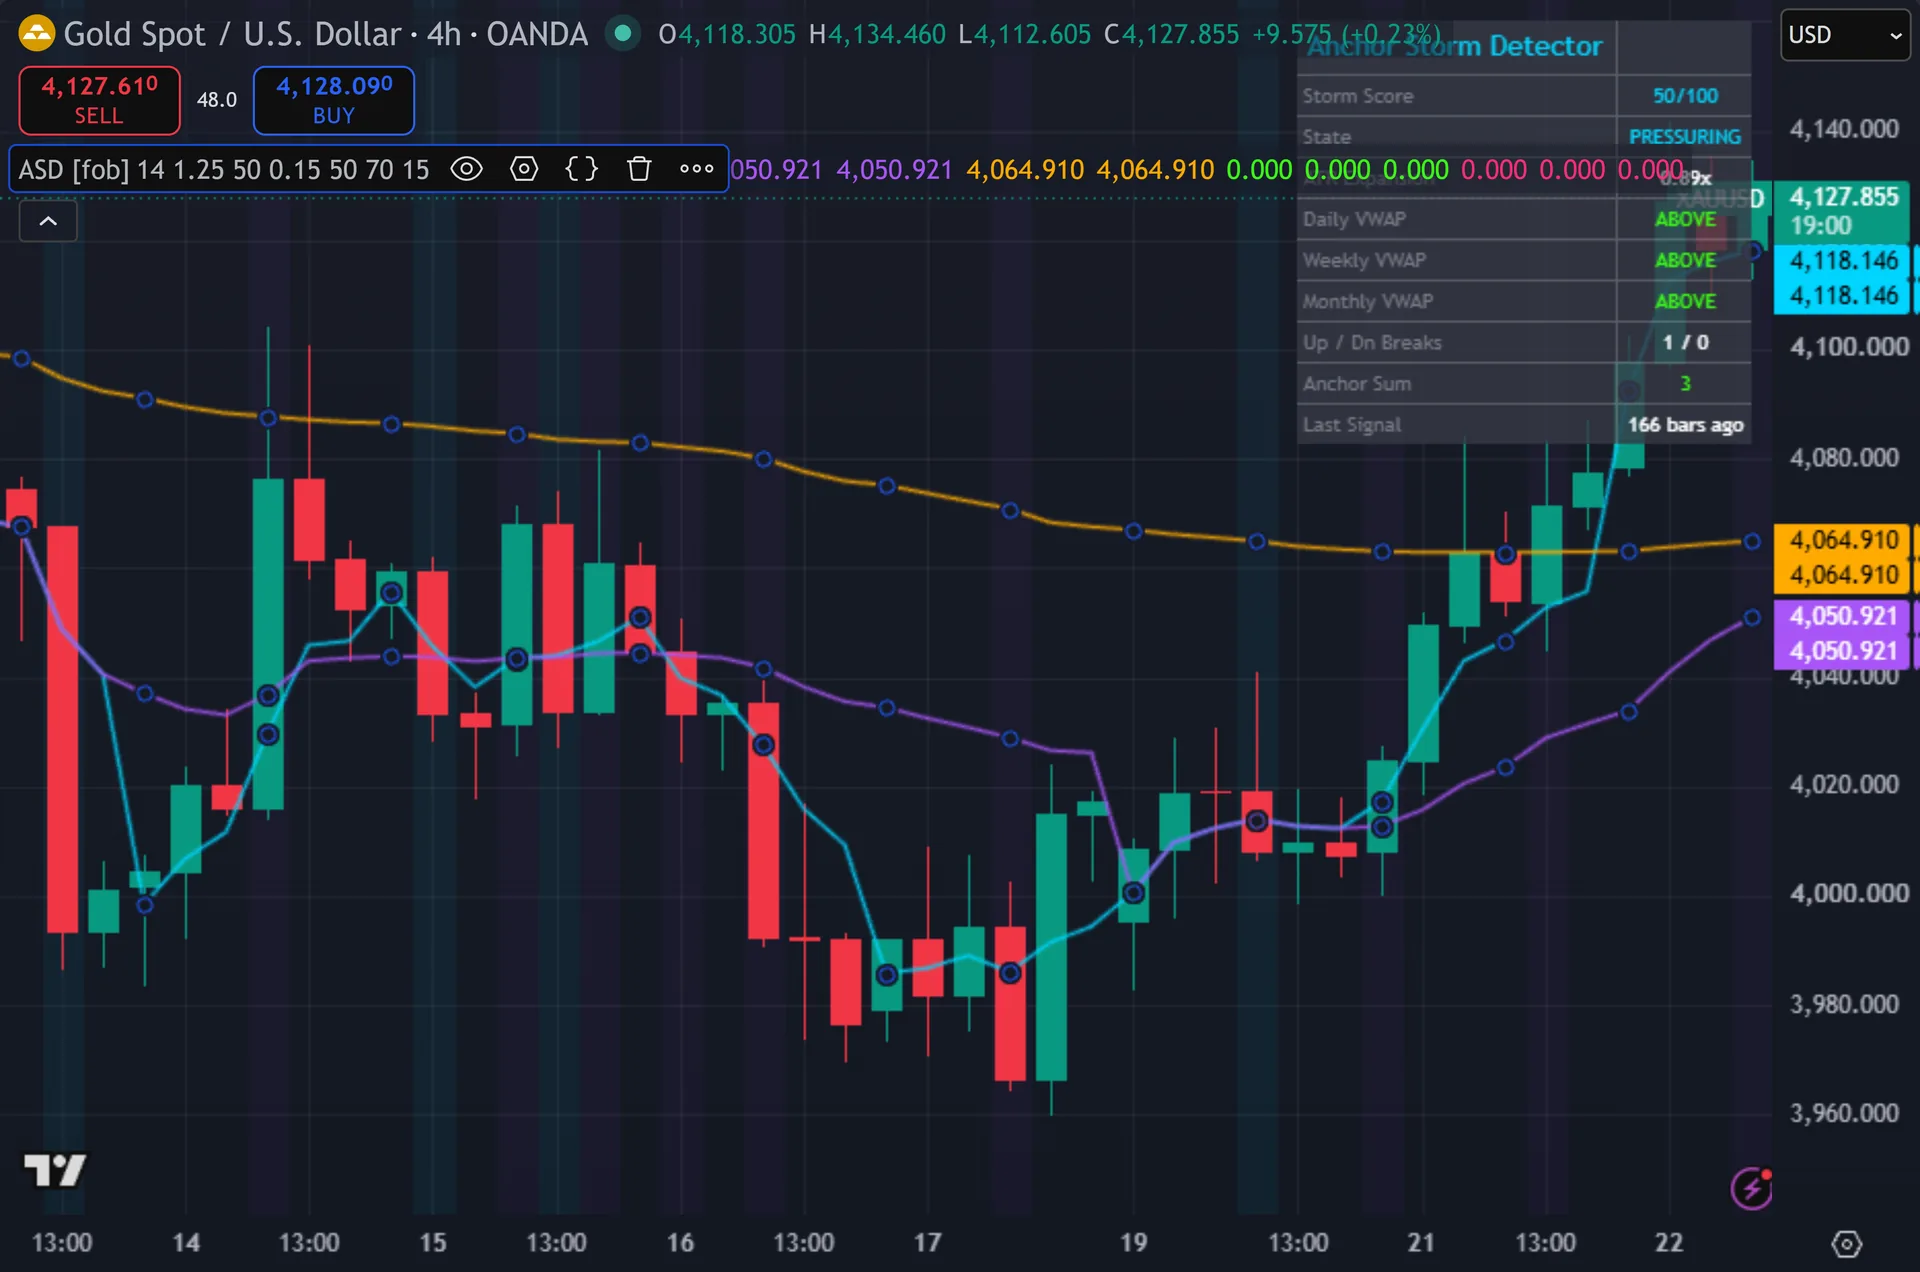
Six lines cross the chart. Still, a cyan pair marks the daily anchor, purple the weekly and gold the monthly. Each anchor gets a thick faded line behind a thin bright one, which reads as a glow. Thus, the background tints in three tiers as the storm score passes 50, 70 and 85. Signals print stacked triangles plus a label carrying the direction, the score out of 100 and the number of anchors broken. Hence, a ten-row dashboard lists the score, state word, ATR expansion, each anchor’s above or below status, break counts and the anchor sum.
How Anchor Storm Detector is built
Three anchors and a break test
The script builds each VWAP the same way. Next, it accumulates hlc3 multiplied by volume, accumulates volume alongside it, then divides one by the other. A new day, week or month zeroes both running totals, so each line restarts at its anchor. Then, you can switch any of the three off in the inputs.
Position scoring follows. Yet, each enabled anchor contributes plus one when the close sits above it and minus one when the close sits below. The sum runs from minus three to plus three and shows in the dashboard as Anchor Sum. Truly, that number describes structure rather than events.
Break events are stricter. Plainly, a break up needs the close above the anchor plus 0.15 ATR, with the previous close at or below that same offset line. The margin stops price hovering on a VWAP from registering dozens of breaks. Also, the script counts up-breaks and down-breaks separately on every bar.
Scoring the storm and firing
Three components build the score. Indeed, break count contributes 25 points each, so two simultaneous breaks give 50. ATR expansion contributes up to 30 points. Still, the script divides ATR(14) by its own 50-bar average, subtracts one, multiplies by 60 and caps the result at 30. Anchor alignment contributes up to 25, scaled by how many enabled anchors agree. The total caps at 100.
State words follow the score. Thus, from 85 up it reads STORM. From 70 it reads RIPPING. From 50 it reads PRESSURING. Below that it reads ANCHORED. Hence, the background tint uses the same tiers, so you can watch the build without the dashboard.
A signal needs far more than a high score. Next, two or more anchors must break the same way on the same bar. ATR must run above 1.25 times its 50-bar average. Then, the close must sit on the right side of the 50 EMA, and that EMA must slope the right way over three bars. The score must clear 70, fifteen bars must have passed since the last mark, and the bar must close. Yet, those conditions rarely coincide, so signals stay rare.
How to read the signals
Use the lines as context and the score as timing. Truly, price above all three anchors with a rising monthly line describes a market where buyers have paid up since the last reset. The Anchor Sum row condenses that picture into one number.
Watch the state word climb. Plainly, PRESSURING at 50 usually means ATR has expanded or the anchors agree, yet nothing has broken. RIPPING at 70 means breaks have landed. Also, reaching STORM at 85 needs breaks, expansion and alignment together, which is why that word appears so seldom.
Signals arrive after the bar closes, so a triangle and its label land at the open of the next candle. Indeed, the fifteen-bar cooldown then blocks new marks, which suits an expansion tool but hides quick second entries. The Last Signal row tells you how much of that cooldown remains.
Every Anchor Storm Detector setting explained
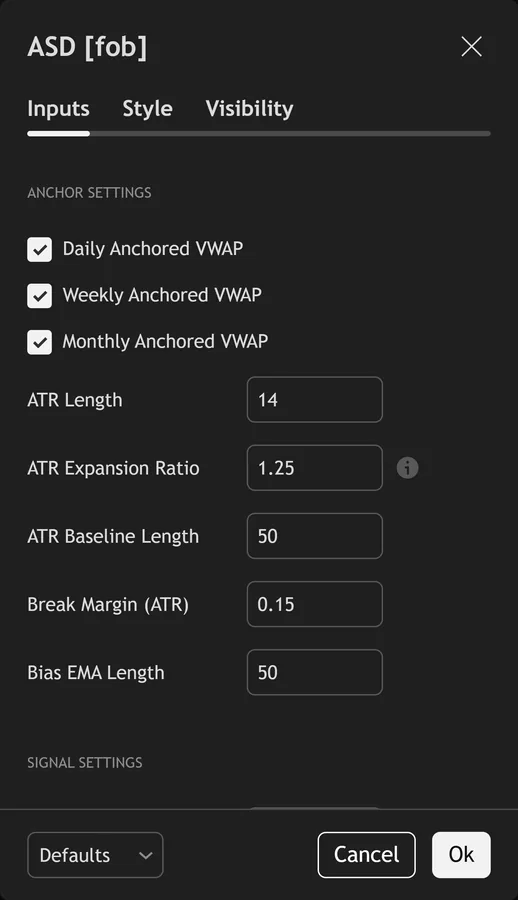
The script exposes 16 inputs, grouped in the settings panel exactly as shown below. Defaults are the published values.
Anchor Settings
| Setting | What it does | Default | Range |
|---|---|---|---|
| Daily Anchored VWAP | Toggles daily anchored vwap on the chart. | on | on / off |
| Weekly Anchored VWAP | Toggles weekly anchored vwap on the chart. | on | on / off |
| Monthly Anchored VWAP | Toggles monthly anchored vwap on the chart. | on | on / off |
| ATR Length | Sets the atr length used in the calculation. | 14 | 5 to 50 |
| ATR Expansion Ratio | Current ATR / baseline ATR required during storm | 1.25 | 1.0 to 3.0 |
| ATR Baseline Length | Sets the atr baseline length used in the calculation. | 50 | 20 to 300 |
| Break Margin (ATR) | Sets the break margin (atr) used in the calculation. | 0.15 | 0.05 to 1.0 |
| Bias EMA Length | Sets the bias ema length used in the calculation. | 50 | 10 to 200 |
Signal Settings
| Setting | What it does | Default | Range |
|---|---|---|---|
| Storm Score Threshold | Sets the storm score threshold used in the calculation. | 70 | 40 to 95 |
| Signal Cooldown Bars | Sets the signal cooldown bars used in the calculation. | 15 | 3 to 50 |
Visual Settings
| Setting | What it does | Default | Range |
|---|---|---|---|
| Show Anchor Dashboard | Toggles show anchor dashboard on the chart. | on | on / off |
| Show Storm Background | Toggles show storm background on the chart. | on | on / off |
| Show 3-Layer Signal Glow | Toggles show 3-layer signal glow on the chart. | on | on / off |
| Show Anchored VWAPs | Toggles show anchored vwaps on the chart. | on | on / off |
| Buy Color | Colour used for buy color. | #39ff14 | |
| Sell Color | Colour used for sell color. | #ff2d78 |
Alerts built into Anchor Storm Detector
The script ships 11 alert conditions. Still, open the alert dialog on the chart, pick the indicator as the condition source, then choose the event you want. Alerts fire on the close of the bar, so they follow the same confirmed-bar rule the on-chart signals use.
- ASD Buy Storm
- ASD Sell Storm
- ASD Any Signal
- ASD Storm Peak
- ASD Multi Up Break
- ASD Multi Down Break
- ASD ATR Expansion
- ASD Full Bull Stack
- ASD Webhook JSON
Other markets and timeframes
Nothing here is tuned to a currency pair. Thus, the break margin is 0.15 ATR, the expansion test is a ratio against ATR’s own average, and alignment is just a count. All of it scales with the instrument. Hence, the anchors, though, depend on volume, and volume changes character by market. Futures and crypto report exchange volume. Next, spot forex reports broker tick volume, so the VWAP reflects tick activity rather than traded size. Read forex anchors as close approximations.
Limitations worth knowing
Signals need two anchors to break on the same bar, plus ATR expansion, plus EMA agreement. Then, long quiet stretches produce nothing at all. That is the intent, yet it also means the tool ignores ordinary trend days entirely.
The anchors start where your loaded history starts. Yet, if the chart has not loaded a full month, the monthly line accumulates from a partial period and sits too close to the recent range. Scroll back to load more bars before trusting the monthly anchor on a low timeframe.
The script offers no stop, no target and no exit rule. Truly, it keeps no record of whether the last storm followed through. Volume feeds also differ between brokers on spot forex, so two platforms can draw slightly different anchors on the same pair.
Get Anchor Storm Detector on TradingView
Open Anchor Storm Detector on TradingView
If you also trade MetaTrader, the MT4 and MT5 indicator library is available below.
Get the complete indicator library
One email unlocks the full MT4 and MT5 indicator library. Plainly, this TradingView script stays free on TradingView – the button above adds it to your chart.
Using it alongside MetaTrader
Adding a script on TradingView takes one click, so there is no install step here. Also, if you want the same idea on MetaTrader, the MT4 and MT5 indicator installation guide walks through copying files into the data folder and attaching them to a chart. You can also browse the full MetaTrader indicator library, the MT4 indicators section, or the other free TradingView scripts published on this profile. For related chart tools see the MT5 indicators section and the forex trading strategies guides.
External references
- Money flow index on Wikipedia
- On-Balance Volume at Investopedia
- CandleVolume at StockCharts ChartSchool
Frequently asked questions
Does Anchor Storm Detector repaint?
No. Indeed, both signals require barstate.isconfirmed, and the triangles and labels use those gated variables. The VWAP lines themselves move while the current bar is open, as every VWAP does, but they never revise once the bar has closed.
How does the storm score reach 100?
It adds three parts. Still, each simultaneous anchor break adds 25, so three breaks add 75. ATR expansion adds up to 30 and anchor alignment adds up to 25. Thus, the sum caps at 100, so a top reading needs breaks, a sharp volatility expansion and full agreement between the anchors.
Is this a multi-timeframe indicator?
Not in the request.security sense. Hence, the script never pulls data from another chart resolution. It only reads daily, weekly and monthly timestamps to know when to reset each anchored VWAP, and every calculation runs on your chart’s own bars.
Why does the daily VWAP sit so close to price?
Because it resets every day. Next, early in a session it has few bars behind it, so it hugs the opening range. The weekly and monthly anchors carry far more accumulation, which is why they sit further away and act as the slower reference.
How much should I rely on this indicator?
Treat it as one input, not a decision. Then, it is a chart analysis tool, not trading advice. Test it on your own markets and timeframes before relying on it. Results are not guaranteed; past performance is not indicative of future results.

About the author
Written by Dominic Walsh, a Forex trader and MT4/MT5 indicator, Expert Advisor and script developer. Every tool on forexmt4systems.com is tested on live charts before release and ships with ready-to-use compiled MT4 (.ex4) and MT5 (.ex5) files. Learn more about the trader and developer behind this site.
How we build, test and correct every tool: Editorial & Testing Policy. Trading carries risk; see the disclaimer.