
Price pushes to a new high. Also, the volume behind it does not agree. Cumulative Delta Divergence turns that disagreement into one number. Indeed, this free volume divergence indicator TradingView traders can drop on any chart signs each bar’s volume by its close direction. It sums the last 40 bars, then measures that total against price on the same scale. Still, a gap of 0.30 flags the bar. An EMA cross then times the entry.
It is free and open source. Thus, you can add it to any chart from the Cumulative Delta Divergence script page on TradingView, and the full Pine source is published there for you to read.
What Cumulative Delta Divergence plots on the price chart
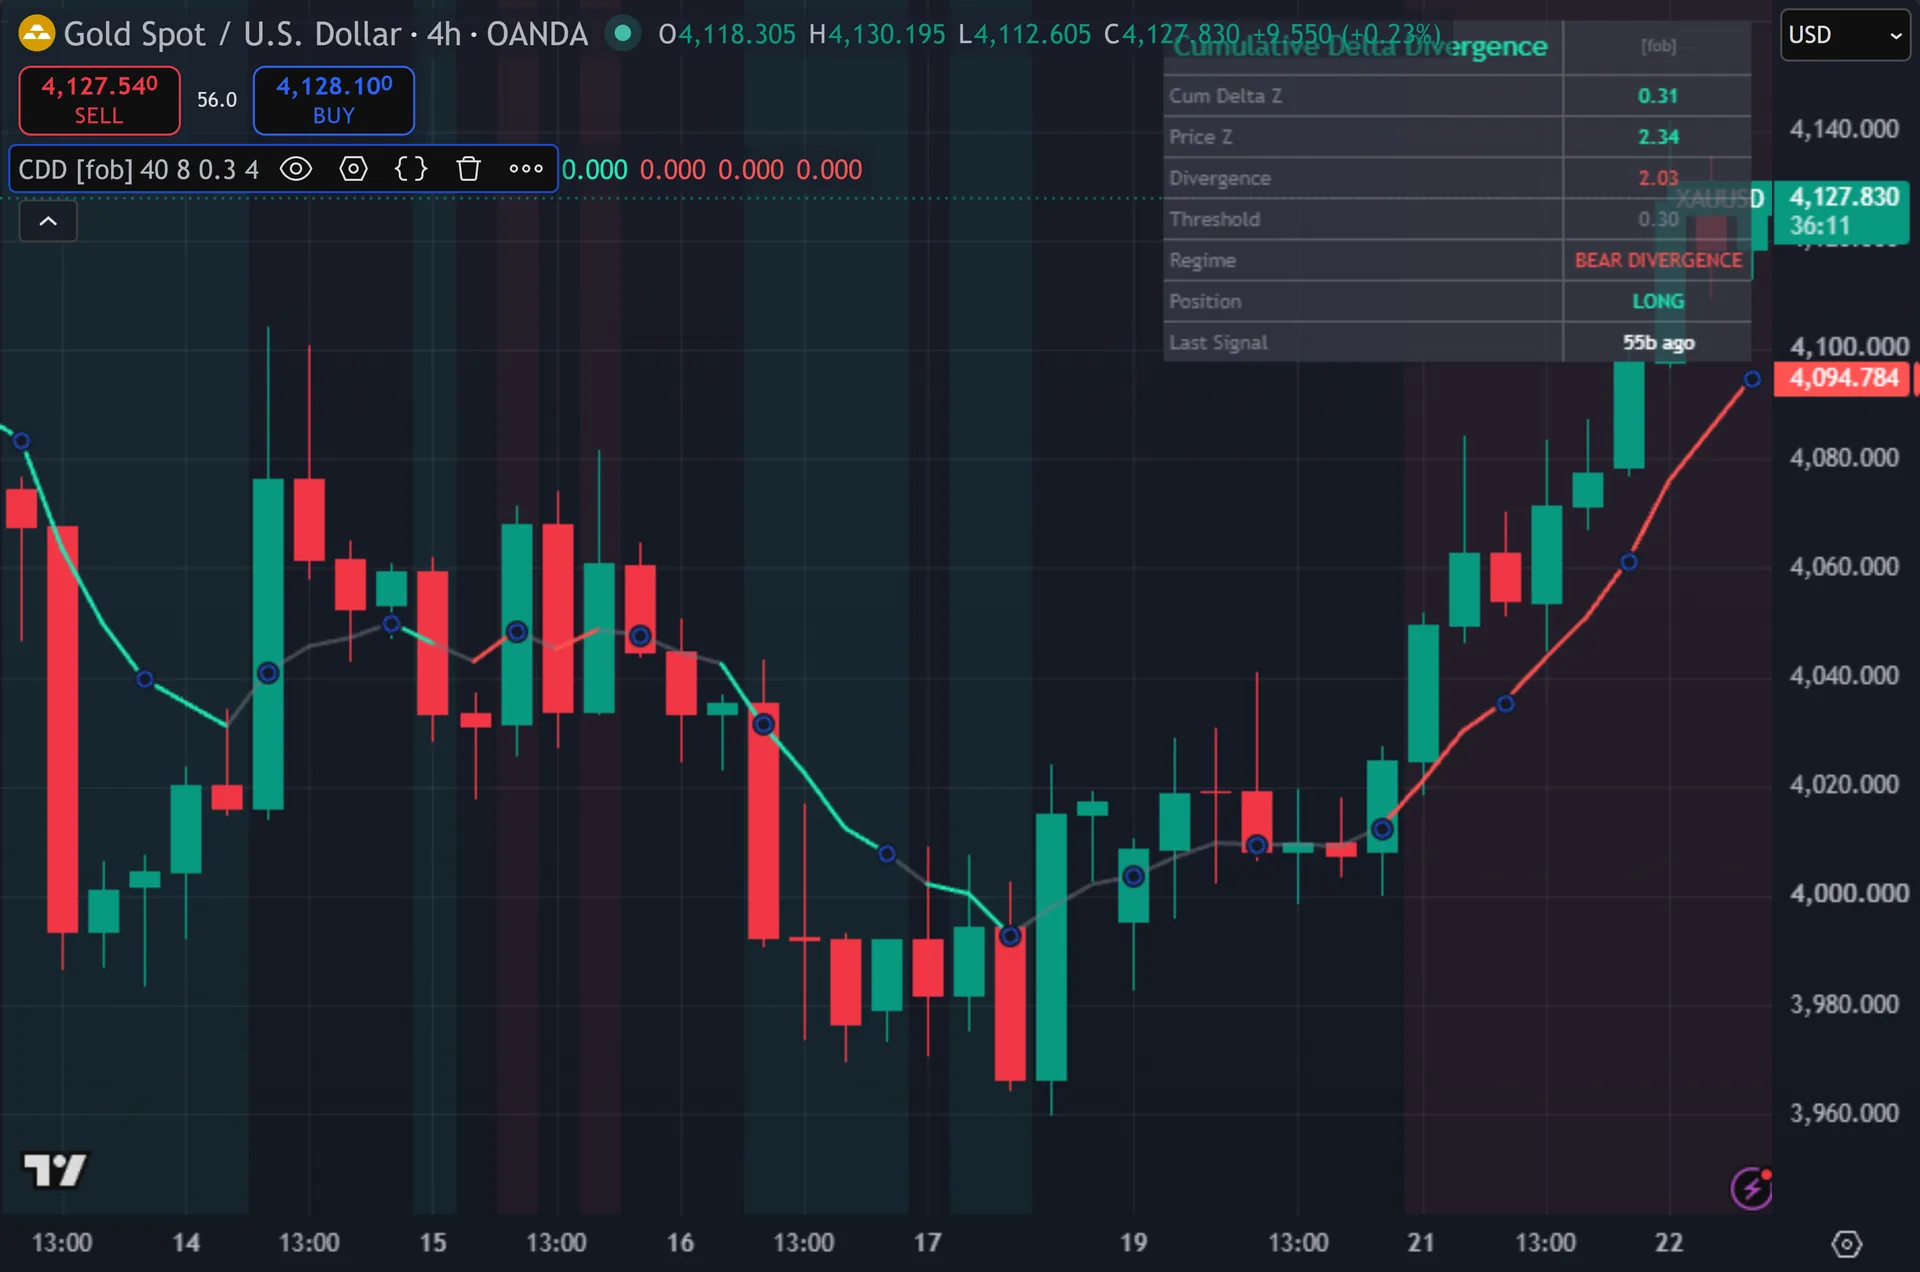
The script plots one line: an 8-period EMA. Hence, it turns teal during bull divergence, red during bear divergence, and grey when price and delta agree. Signals print as diamonds, below the bar for buys and above for sells, each labelled CDD up or CDD dn. Next, two translucent copies sit behind every marker as a glow. The signal bar recolours. Then, a faint background tint marks each bar in divergence. A top-right dashboard reads out cumulative delta z, price z, the divergence value, your threshold, the regime, the position state and bars since the last signal.
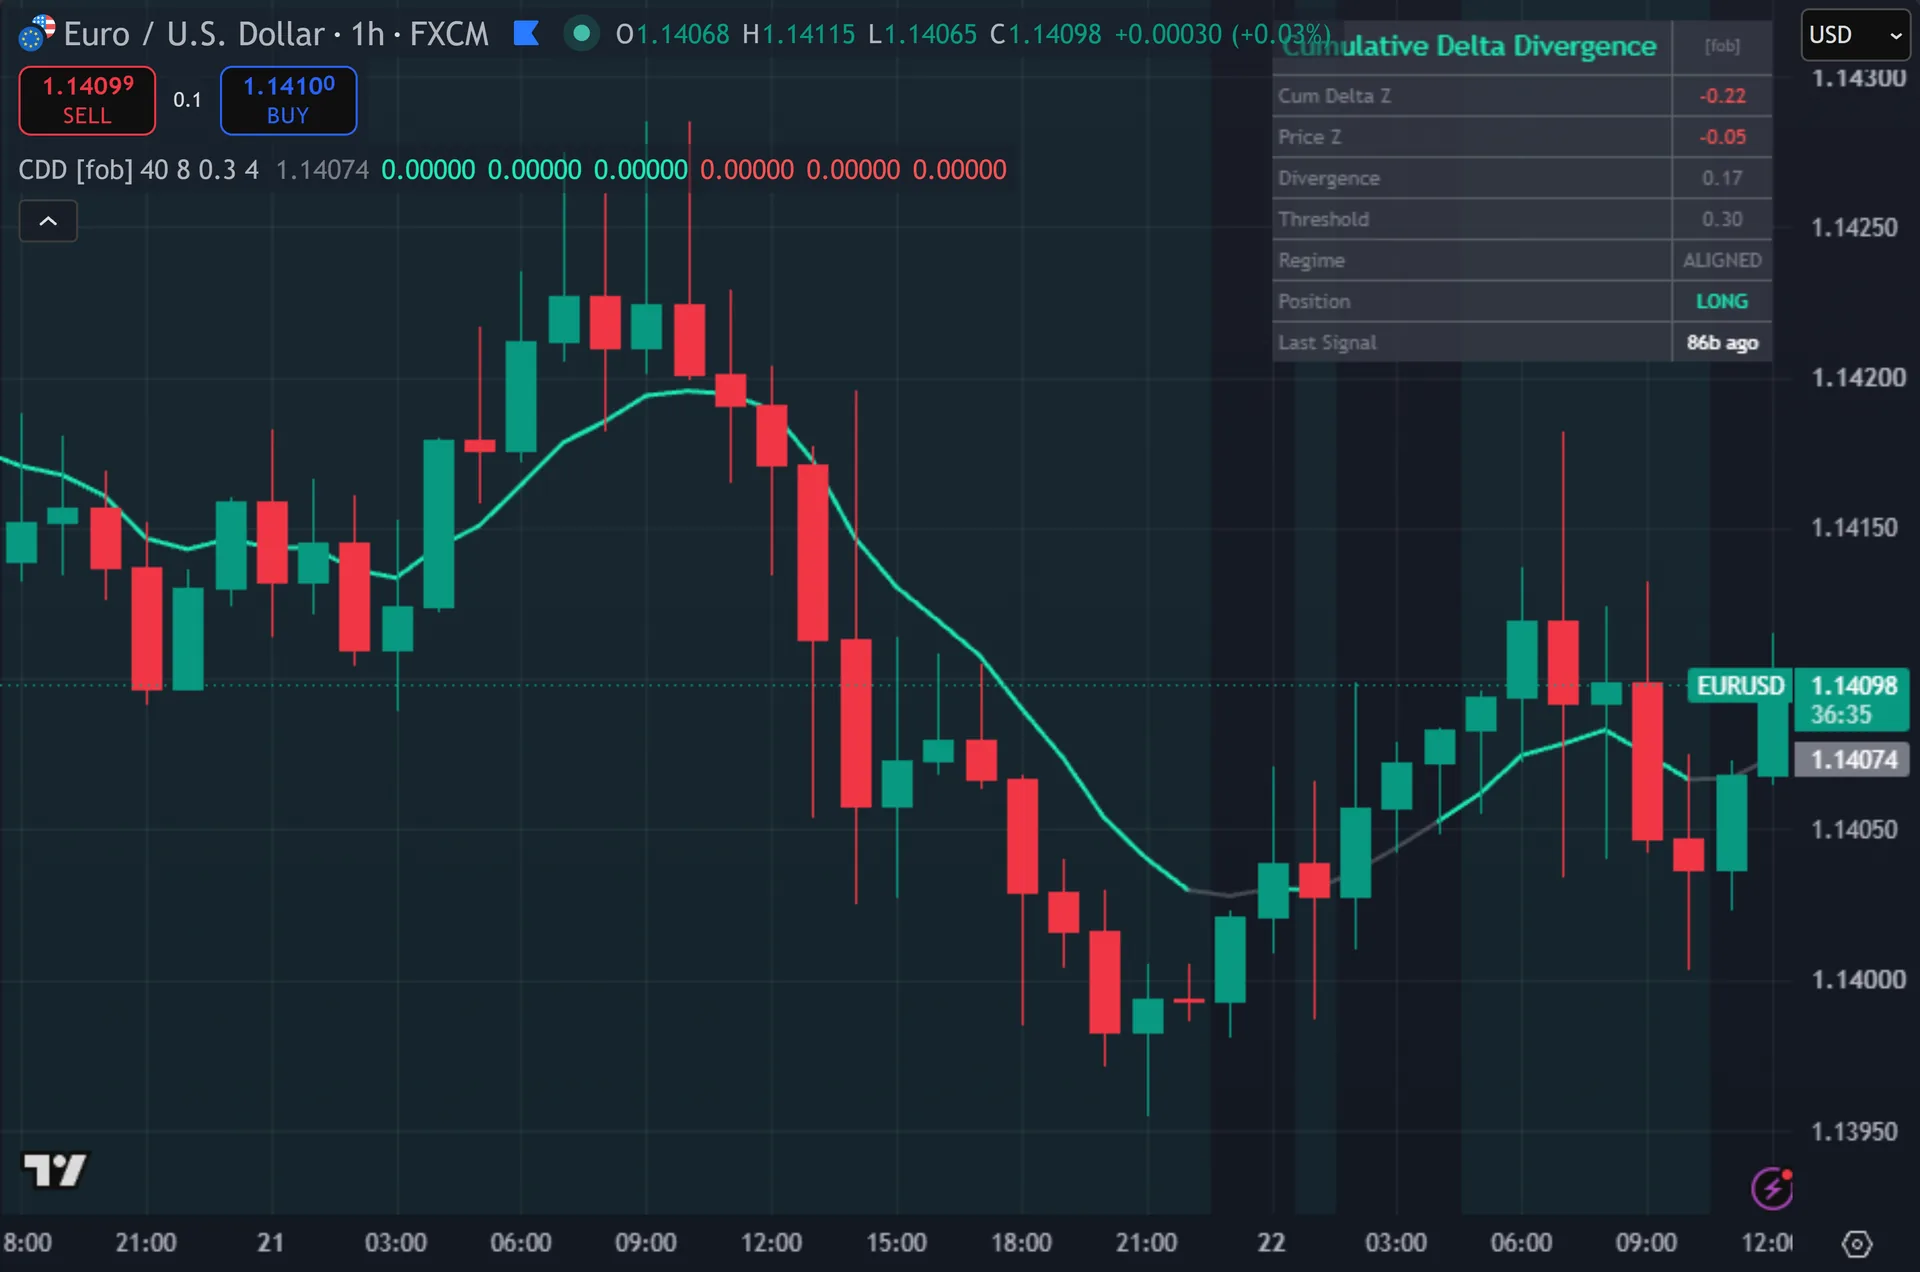
How Cumulative Delta Divergence is built
Step one: sign the volume, then scale it
The script starts with the tick rule. Yet, it multiplies each bar’s volume by plus one when the close finishes above the prior close, and by minus one when it finishes below. Flat bars contribute zero. That gives signed volume. Cumulative delta is the running sum of signed volume over the Cumulative Window, which starts at 40 bars. Truly, read that wording carefully: this is a rolling 40-bar sum, not a session-anchored total that resets each day.
Raw sums mean nothing across symbols, so the script normalises. Plainly, it takes the standard deviation of single-bar signed volume over the same 40 bars and multiplies it by the square root of 40. That is the spread you would expect from 40 independent random steps. Also, dividing the sum by it gives the delta z-score in the dashboard. A reading of 1.00 means the window’s net flow ran one expected deviation above zero. Indeed, the square-root scaling assumes bars behave independently, which real flow does not, so treat the figure as a scale rather than a strict probability.
Step two: measure the gap, then wait for the cross
Price gets the same treatment. Still, the script subtracts the 40-bar simple moving average from the close, then divides by the 40-bar standard deviation. Subtracting delta z from price z gives the divergence figure. Thus, positive means price runs ahead of the flow behind it, which the script calls bear divergence. Negative means flow runs ahead of price, which it calls bull divergence. Hence, the Min Divergence Z input sets that gate at 0.30 by default.
Be clear about what this compares. Next, it reads both z-scores on the current bar. It does not hunt swing highs, match them to delta peaks, or draw lines between pivots. Then, so it flags a state, not a classic two-pivot divergence pattern.
Entries need a trigger. Yet, a buy needs bull divergence plus a close crossing above the 8-period EMA. A sell needs bear divergence plus a close crossing below it. Three more gates apply. The side must alternate, so two buys never stack. Truly, four bars must pass since the last signal. And the bar must close. Plainly, eleven alert conditions ship with the script, including a JSON payload for webhooks.
How to read the signals
Read the dashboard before the diamonds. Also, cum Delta Z and Price Z tell you which side leads. A price z of 1.40 against a delta z of 0.20 is a wide gap, and the divergence row shows it as 1.20. Indeed, that runs four times the default 0.30 gate, so the disagreement is real rather than marginal.
The tint tells you the script is watching. Still, it does not tell you to trade. Divergence can persist for many bars while price grinds on. Thus, the diamond only prints once the close crosses the 8-period EMA against that stretched state. That is the script asking for a first sign that the stretch is unwinding.
Signals need a closed bar, so the diamond lands as the next candle opens. Hence, you act one bar after the cross, so size and stops should allow for that bar’s range. The background tint and the EMA colour do update inside the live bar, so they can change before the candle finishes. Next, only the diamonds and the position state lock on the close.
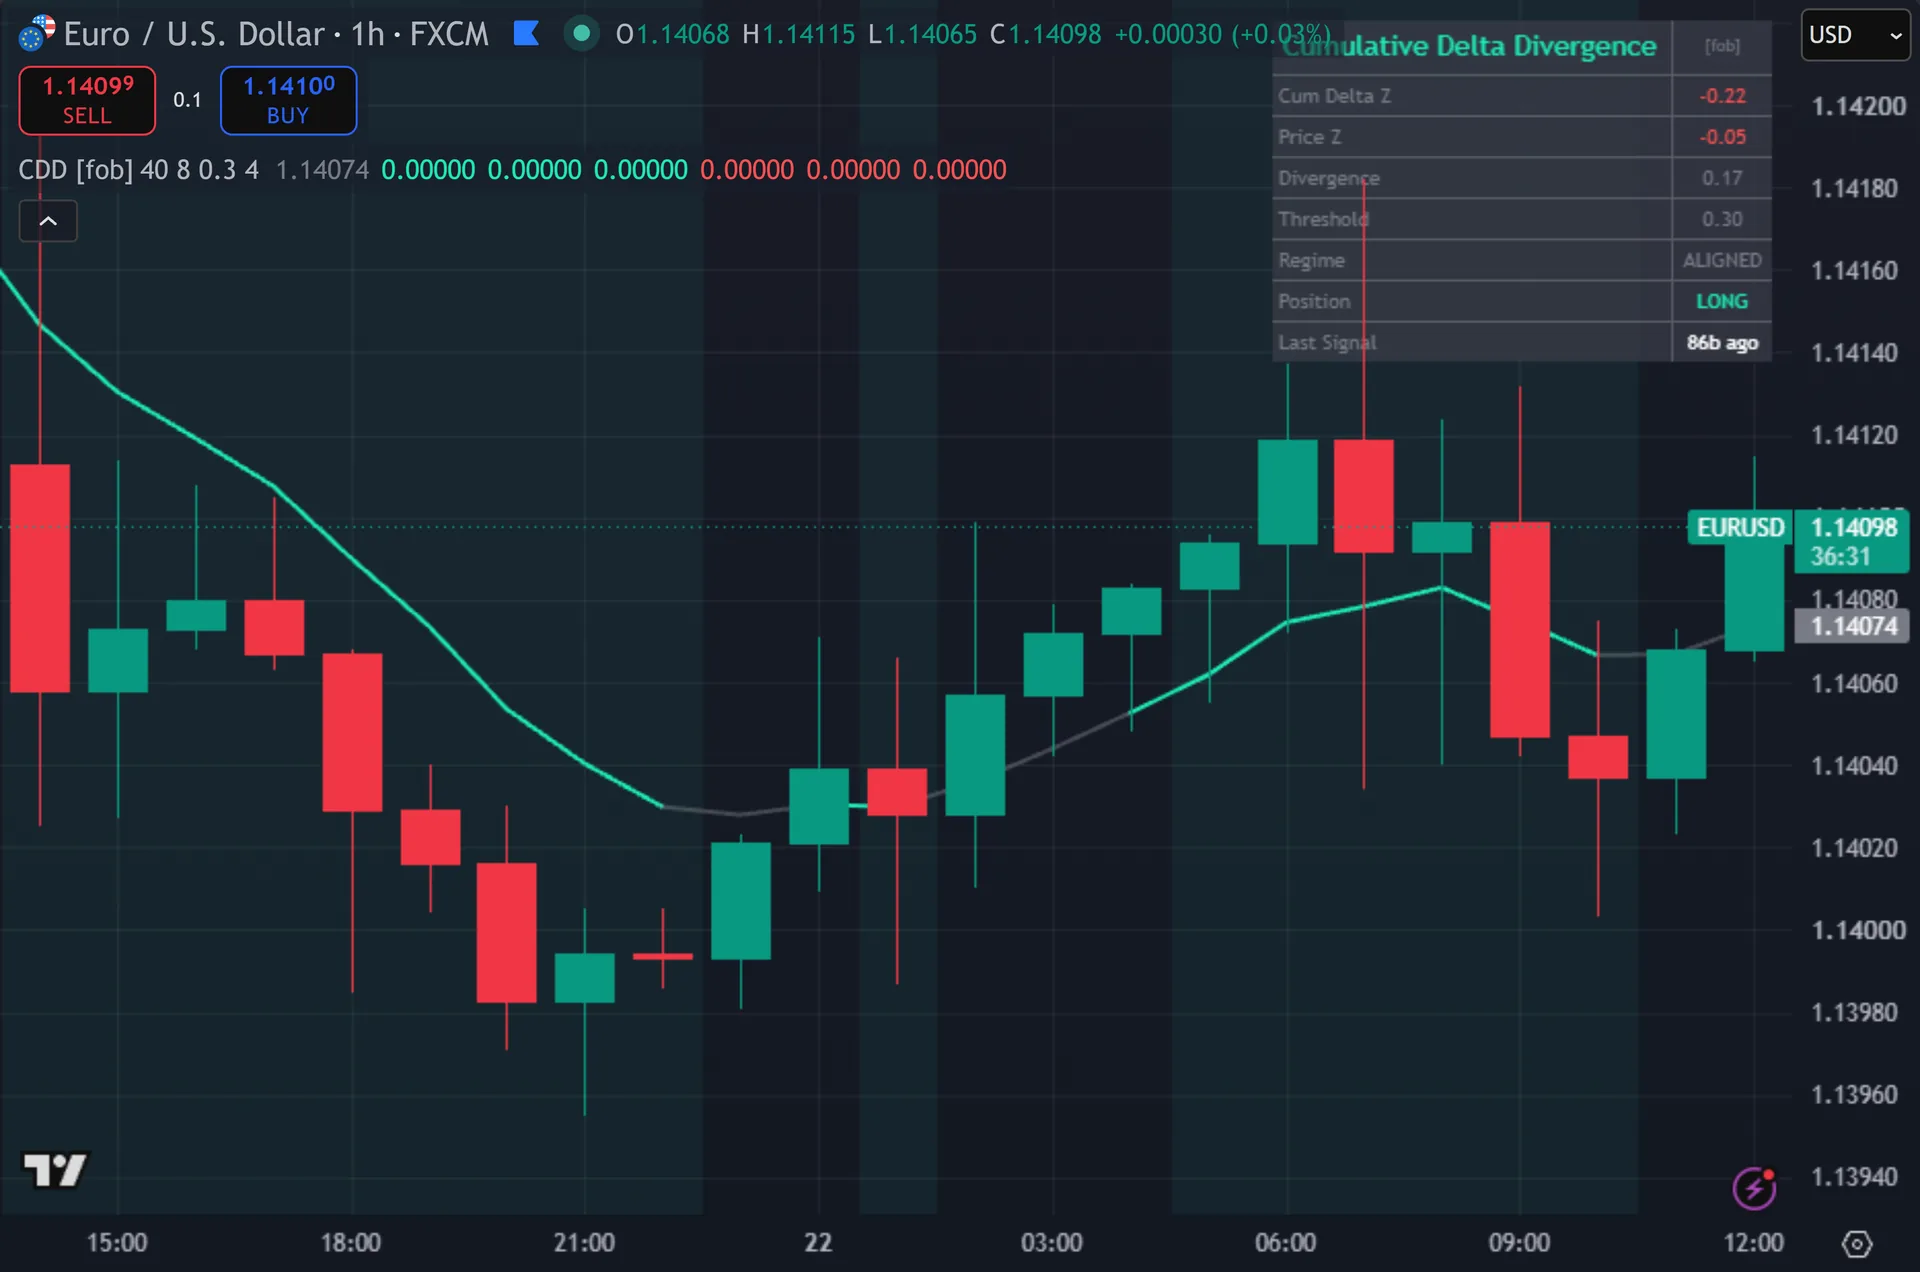
Every Cumulative Delta Divergence setting explained
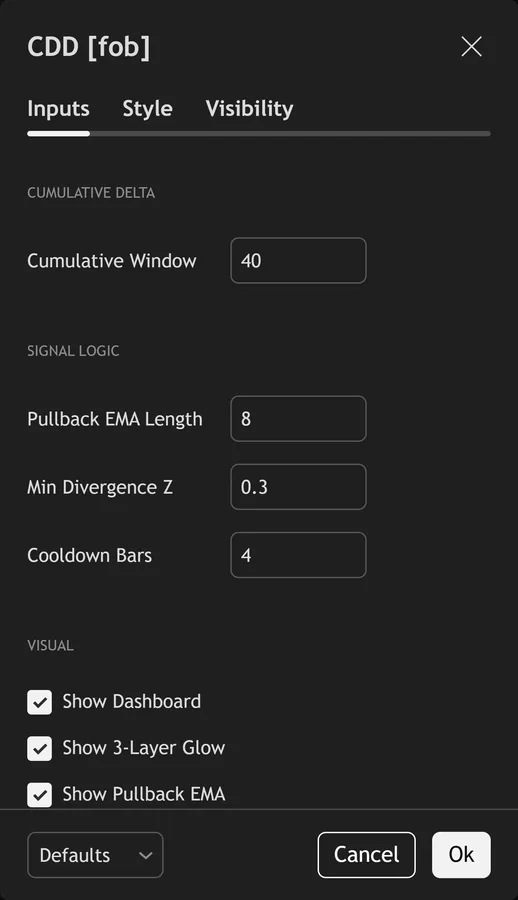
The script exposes 9 inputs, grouped in the settings panel exactly as shown below. Defaults are the published values.
Cumulative Delta
| Setting | What it does | Default | Range |
|---|---|---|---|
| Cumulative Window | Sets the cumulative window used in the calculation. | 40 | 10 to 200 |
Signal Logic
| Setting | What it does | Default | Range |
|---|---|---|---|
| Pullback EMA Length | Sets the pullback ema length used in the calculation. | 8 | 3 to 50 |
| Min Divergence Z | Sets the min divergence z used in the calculation. | 0.30 | 0.1 to 3.0 |
| Cooldown Bars | Sets the cooldown bars used in the calculation. | 4 | 1 to 20 |
Visual
| Setting | What it does | Default | Range |
|---|---|---|---|
| Show Dashboard | Toggles show dashboard on the chart. | on | on / off |
| Show 3-Layer Glow | Toggles show 3-layer glow on the chart. | on | on / off |
| Show Pullback EMA | Toggles show pullback ema on the chart. | on | on / off |
| Buy Color | Colour used for buy color. | #1de9b6 | |
| Sell Color | Colour used for sell color. | #ff5252 |
Alerts built into Cumulative Delta Divergence
The script ships 11 alert conditions. Then, open the alert dialog on the chart, pick the indicator as the condition source, then choose the event you want. Alerts fire on the close of the bar, so they follow the same confirmed-bar rule the on-chart signals use.
- CDD Buy
- CDD Sell
- CDD Any Signal
- CDD Bull Div On
- CDD Bear Div On
- CDD Strong Bear
- CDD Strong Bull
- CDD EMA Up
- CDD Webhook JSON
Other markets and timeframes
Every threshold sits in z units, so nothing ties this to a currency pair. Yet, the 0.30 gate means the same thing on gold, indices and crypto as it does on EURUSD. Volume is the catch. Truly, spot forex volume comes from your broker’s tick count, not an exchange, so two feeds can produce different delta readings on the same pair. On symbols with no volume at all the delta z stays at zero and the tool quietly reduces to a price-versus-mean reading.
Limitations worth knowing
This measures disagreement between price and signed flow. Plainly, it is not a trading system. It carries no trend filter, no stop logic, no target and no sizing. Also, a wide divergence tells you the last 40 bars moved on thin agreement. It says nothing about how far any unwind runs.
It is not classic pivot divergence. Indeed, there is no swing detection, no line drawn from one high to the next, and no comparison of matched peaks. The script differences two current-bar z-scores. Still, the square-root-of-40 scaling also assumes independent bars, so the z figure reads optimistic when flow trends.
The tool leans on the volume feed. Thus, change broker and the numbers shift. On a symbol with no volume the delta side collapses to zero, and every signal becomes a pure price stretch call – worth knowing before you read the tint as order flow. Hence, the four-bar cooldown also blocks a second genuine setup that arrives too soon.
Get Cumulative Delta Divergence on TradingView
Open Cumulative Delta Divergence on TradingView
If you also trade MetaTrader, the MT4 and MT5 indicator library is available below.
Get the complete indicator library
One email unlocks the full MT4 and MT5 indicator library. Next, this TradingView script stays free on TradingView – the button above adds it to your chart.
Using it alongside MetaTrader
Adding a script on TradingView takes one click, so there is no install step here. Then, if you want the same idea on MetaTrader, the MT4 and MT5 indicator installation guide walks through copying files into the data folder and attaching them to a chart. You can also browse the full MetaTrader indicator library, the MT4 indicators section, or the other free TradingView scripts published on this profile. For related chart tools see the MT5 indicators section and the forex trading strategies guides.
External references
- Money flow index on Wikipedia
- On-Balance Volume at Investopedia
- CandleVolume at StockCharts ChartSchool
Frequently asked questions
Does Cumulative Delta Divergence repaint?
Signals do not. Yet, both the buy and the sell require barstate.isconfirmed, and the diamonds plot from those same variables, so a marker only appears after the bar closes. Two visuals are live rather than confirmed: the background divergence tint and the EMA colour. Truly, those can change while the candle still forms.
Is this the same as cumulative volume delta?
No. Plainly, standard CVD splits each bar’s volume between buyers and sellers, then accumulates from a session anchor. This script signs the whole bar with the tick rule, sums a rolling 40-bar window, and compares that sum to price on a shared z-score scale. Also, the output is a gap figure, not a running delta line.
Why did an obvious divergence print no diamond?
Four gates can block it. Indeed, the divergence value sat under 0.30. The close had not yet crossed the 8-period EMA in the right direction. Still, the last signal came fewer than four bars ago. Or the position state already sat on that side. Thus, the dashboard shows the current value and the bars since the last signal, so you can see which gate applied.
Does it work on stocks and crypto?
Yes, and the volume side means more there, since those feeds carry real exchange volume. Hence, the thresholds are unitless z-scores, so the defaults transfer without retuning. On any symbol that reports no volume the delta side reads zero and the signals reduce to a price stretch plus an EMA cross.
How much should I rely on this indicator?
Treat it as one input, not a decision. Next, it is a chart analysis tool, not trading advice. Test it on your own markets and timeframes before relying on it. Results are not guaranteed; past performance is not indicative of future results.

About the author
Written by Dominic Walsh, a Forex trader and MT4/MT5 indicator, Expert Advisor and script developer. Every tool on forexmt4systems.com is tested on live charts before release and ships with ready-to-use compiled MT4 (.ex4) and MT5 (.ex5) files. Learn more about the trader and developer behind this site.
How we build, test and correct every tool: Editorial & Testing Policy. Trading carries risk; see the disclaimer.