
The name says oscillator, but this script draws on the candles rather than in a sub-pane. Also, ember Glow Oscillator works as a volume breakout indicator TradingView traders can use to time the moment quiet accumulation turns into a move. It counts signed volume across small bars over a 30-bar window. Then it waits for one wide-range candle to ignite in the same direction.
It is free and open source. Indeed, you can add it to any chart from the Ember Glow Oscillator script page on TradingView, and the full Pine source is published there for you to read.
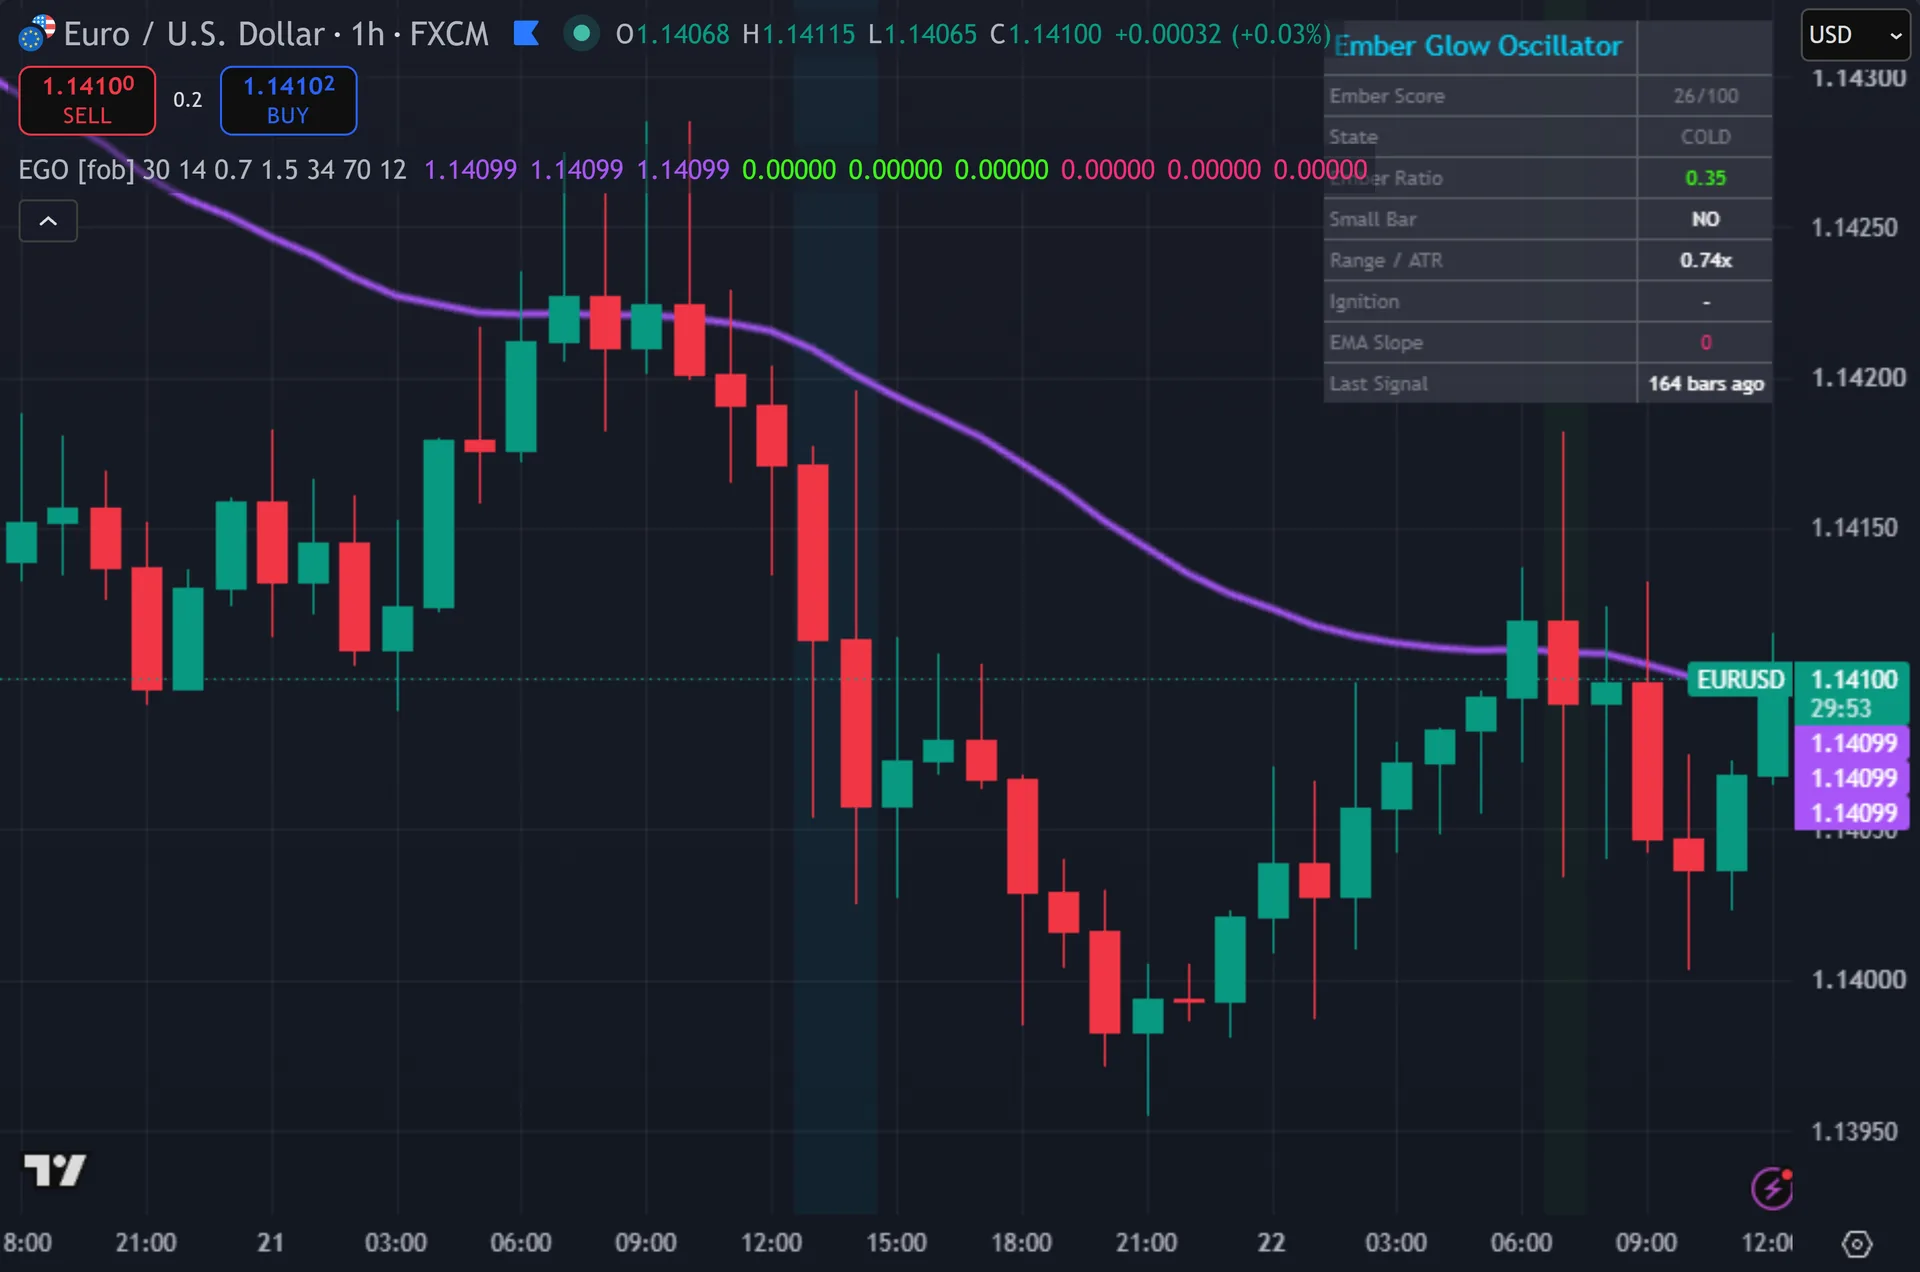
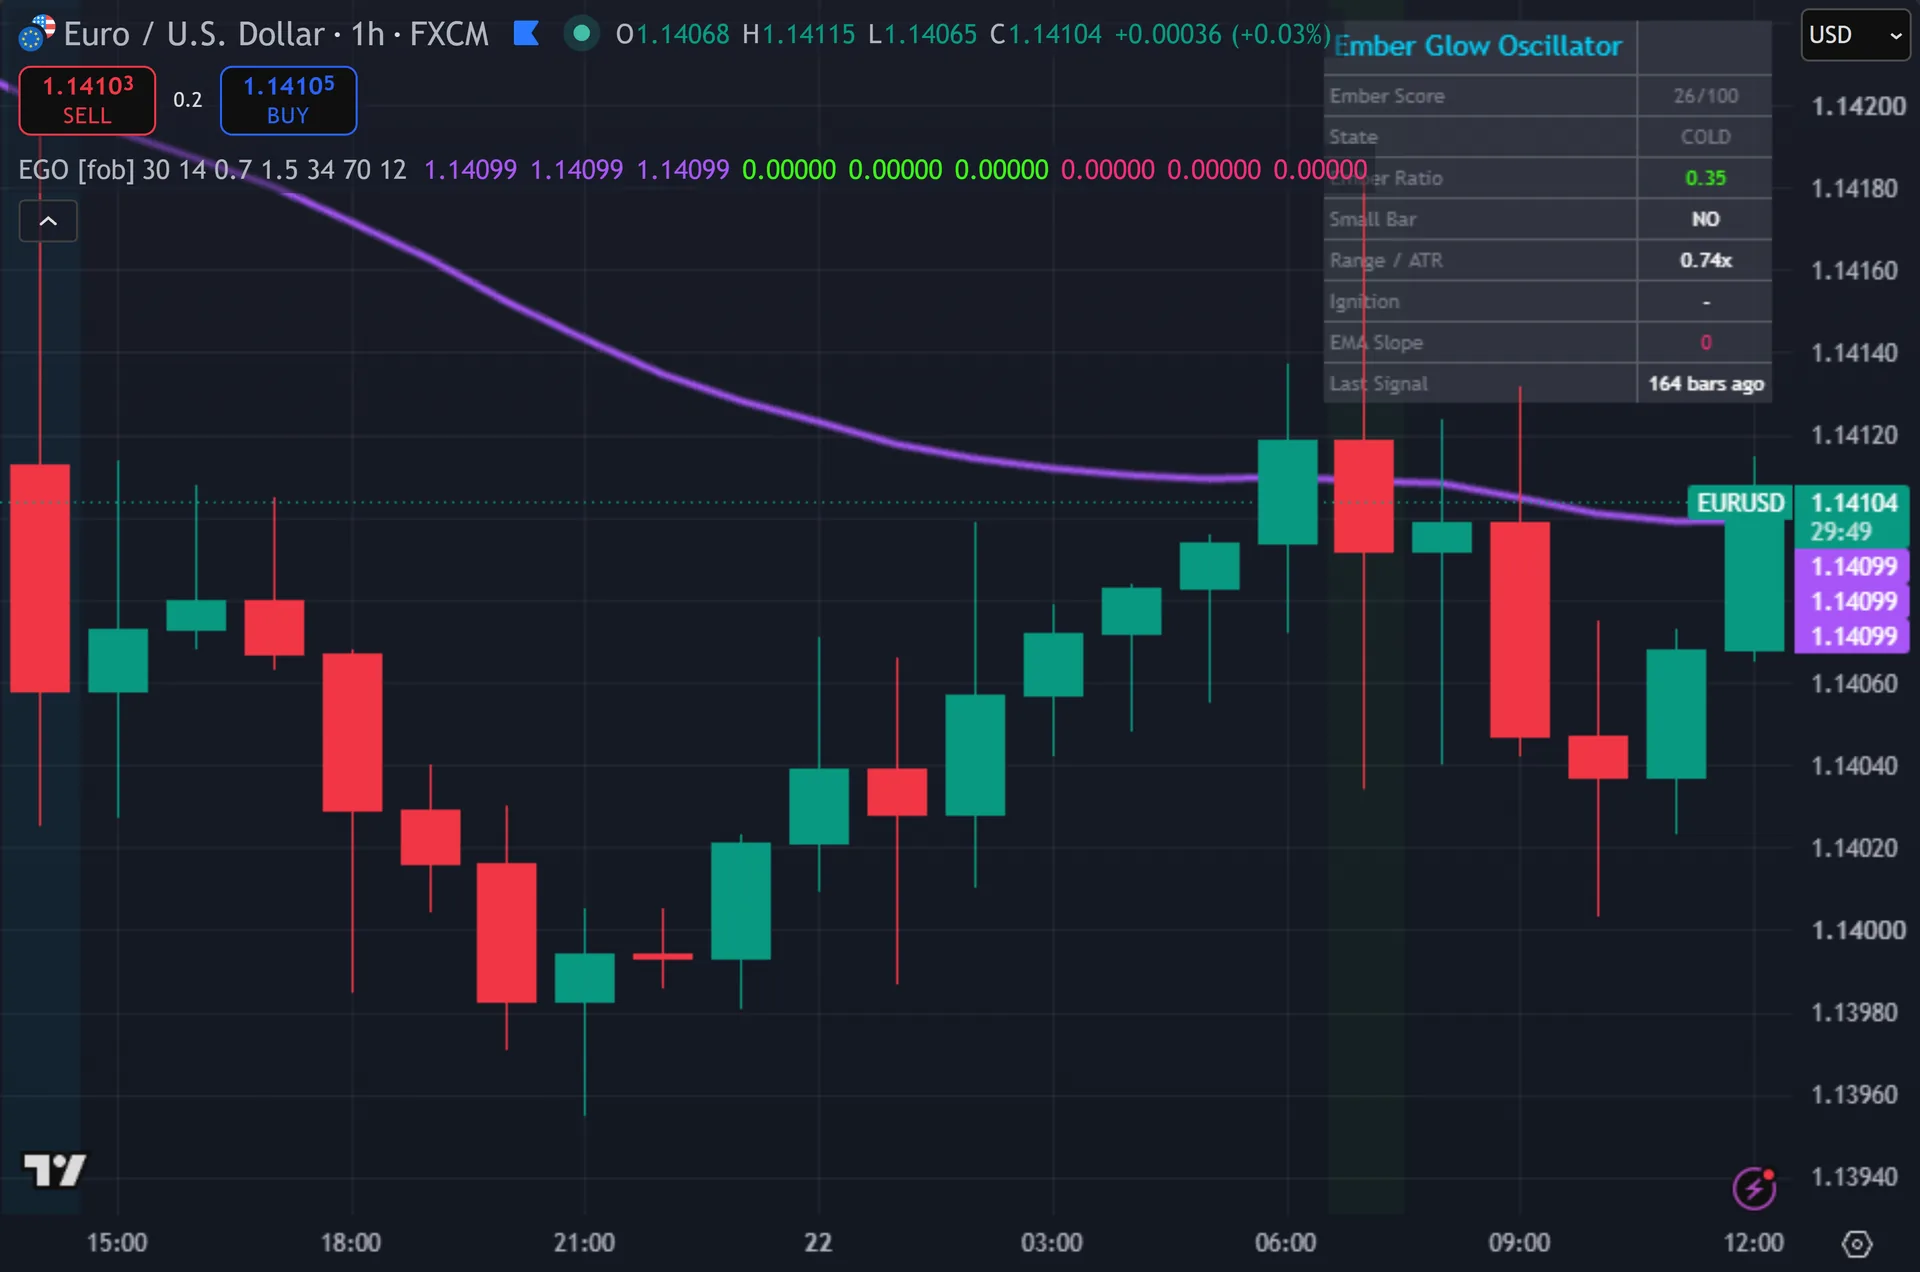
What Ember Glow Oscillator plots on the price chart
Everything renders on the price chart. Still, a purple 34-period bias EMA runs through the candles in three stacked layers, thick to thin, which gives it a glow. Triangles print below and above bars on signals, each carrying EMBER text, and a label follows with the ember score out of 100 and the ember ratio. The signal candle changes colour. The background tints by score band: gold at 85, green at 70, faint at 50. Thus, a nine-row dashboard reports score, state, ratio, small-bar flag, range over ATR, ignition and EMA slope.
How Ember Glow Oscillator is built
The ember: signed volume on small bars
The script calls a bar small when its high-to-low range sits at or under 0.7 x ATR(14). Hence, only those bars feed the ember. A small bar that closes up adds its volume. Next, a small bar that closes down subtracts it. Everything else contributes zero, including every wide candle.
Two running sums cover the last 30 bars: the signed total and the absolute small-bar total. Then, dividing one by the other gives the ember ratio, a number between -1 and +1. Plus 0.6 means quiet bars leaned hard to the buy side. Yet, near zero means they cancelled out.
That normalisation is what makes the reading portable. Truly, a raw volume sum means nothing across instruments or sessions. A ratio of directional quiet volume to total quiet volume compares directly, chart to chart.
Ignition and the 0 to 100 score
An ignition bar is any candle whose range reaches 1.5 x ATR. Plainly, it counts bullish when it closes above its open and above the previous close. Bearish mirrors that. Also, this is the spark – one wide bar breaking out of the quiet stretch the ember just measured.
The score adds three parts. Indeed, the ratio contributes its absolute value times 70, capped at 40. An ignition bar contributes a flat 35. Still, the bias part takes the 3-bar change in the 34-period EMA, divides it by ATR, multiplies by 25 and caps at 25. The total caps at 100 and rounds. Thus, bands then label it: 50 is SMOLDERING, 70 is IGNITED, 85 is BLAZING.
A buy needs the whole stack. Hence, it wants a positive ember ratio, a bullish ignition bar and a close above the 34-EMA. The EMA slope must rise. Next, the score must reach 70 on a closed bar, with 12 cooldown bars since the last signal. Since ignition alone contributes 35 of that 70, the ratio and slope terms must supply the other 35 between them.
How to read the signals
Read the ratio first, then wait for the spark. Then, a ratio parked at plus 0.5 while price coils tells you quiet bars have leaned one way for a while. That is the setup. Yet, the ignition candle is only the trigger that ends it.
The score bands give you a sense of quality, not a verdict. Truly, IGNITED at 71 clears the default gate by a single point. BLAZING at 90 means the ratio ran strong, an ignition fired and the EMA was already sloping hard. Plainly, both print the same triangle, so check the label number.
The EMA slope term rewards signals that go with an already-moving trend. Also, so the tool naturally prefers continuation over reversal. If you want it to catch turns, it will not. Indeed, a bullish ignition under a falling 34-EMA gets blocked outright.
Every Ember Glow Oscillator setting explained
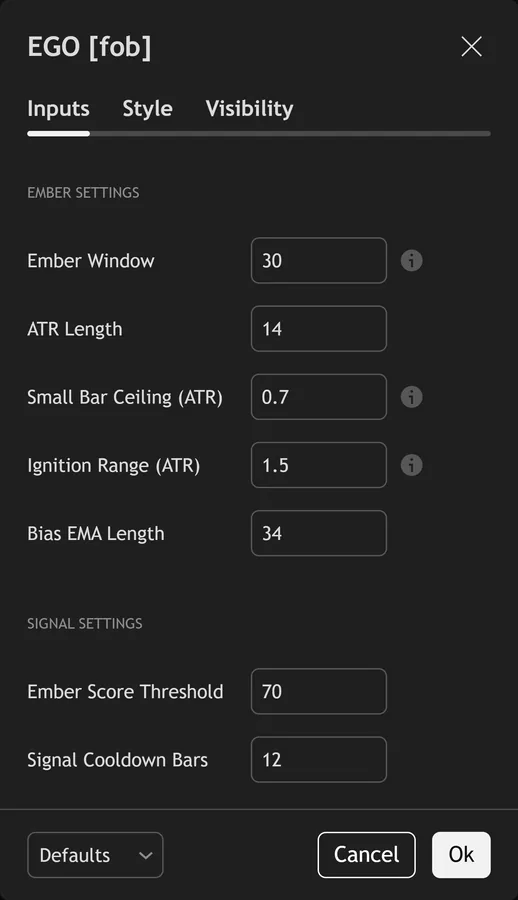
The script exposes 13 inputs, grouped in the settings panel exactly as shown below. Defaults are the published values.
Ember Settings
| Setting | What it does | Default | Range |
|---|---|---|---|
| Ember Window | Bars accumulated for the slow-burn ember | 30 | 10 to 200 |
| ATR Length | Sets the atr length used in the calculation. | 14 | 5 to 50 |
| Small Bar Ceiling (ATR) | A bar counts as small if range <= this ATR multiple | 0.7 | 0.2 to 2.0 |
| Ignition Range (ATR) | Current bar range must exceed this ATR multiple to ignite | 1.5 | 1.0 to 4.0 |
| Bias EMA Length | Sets the bias ema length used in the calculation. | 34 | 10 to 200 |
Signal Settings
| Setting | What it does | Default | Range |
|---|---|---|---|
| Ember Score Threshold | Sets the ember score threshold used in the calculation. | 70 | 40 to 95 |
| Signal Cooldown Bars | Sets the signal cooldown bars used in the calculation. | 12 | 3 to 50 |
Visual Settings
| Setting | What it does | Default | Range |
|---|---|---|---|
| Show Ember Dashboard | Toggles show ember dashboard on the chart. | on | on / off |
| Show Ember Background | Toggles show ember background on the chart. | on | on / off |
| Show 3-Layer Signal Glow | Toggles show 3-layer signal glow on the chart. | on | on / off |
| Show Bias EMA Glow | Toggles show bias ema glow on the chart. | on | on / off |
| Buy Color | Colour used for buy color. | #39ff14 | |
| Sell Color | Colour used for sell color. | #ff2d78 |
Alerts built into Ember Glow Oscillator
The script ships 11 alert conditions. Still, open the alert dialog on the chart, pick the indicator as the condition source, then choose the event you want. Alerts fire on the close of the bar, so they follow the same confirmed-bar rule the on-chart signals use.
- EGO Buy Ember
- EGO Sell Ember
- EGO Any Signal
- EGO Blazing
- EGO Positive Ember
- EGO Negative Ember
- EGO Bull Ignite
- EGO Bear Ignite
- EGO Webhook JSON
Other markets and timeframes
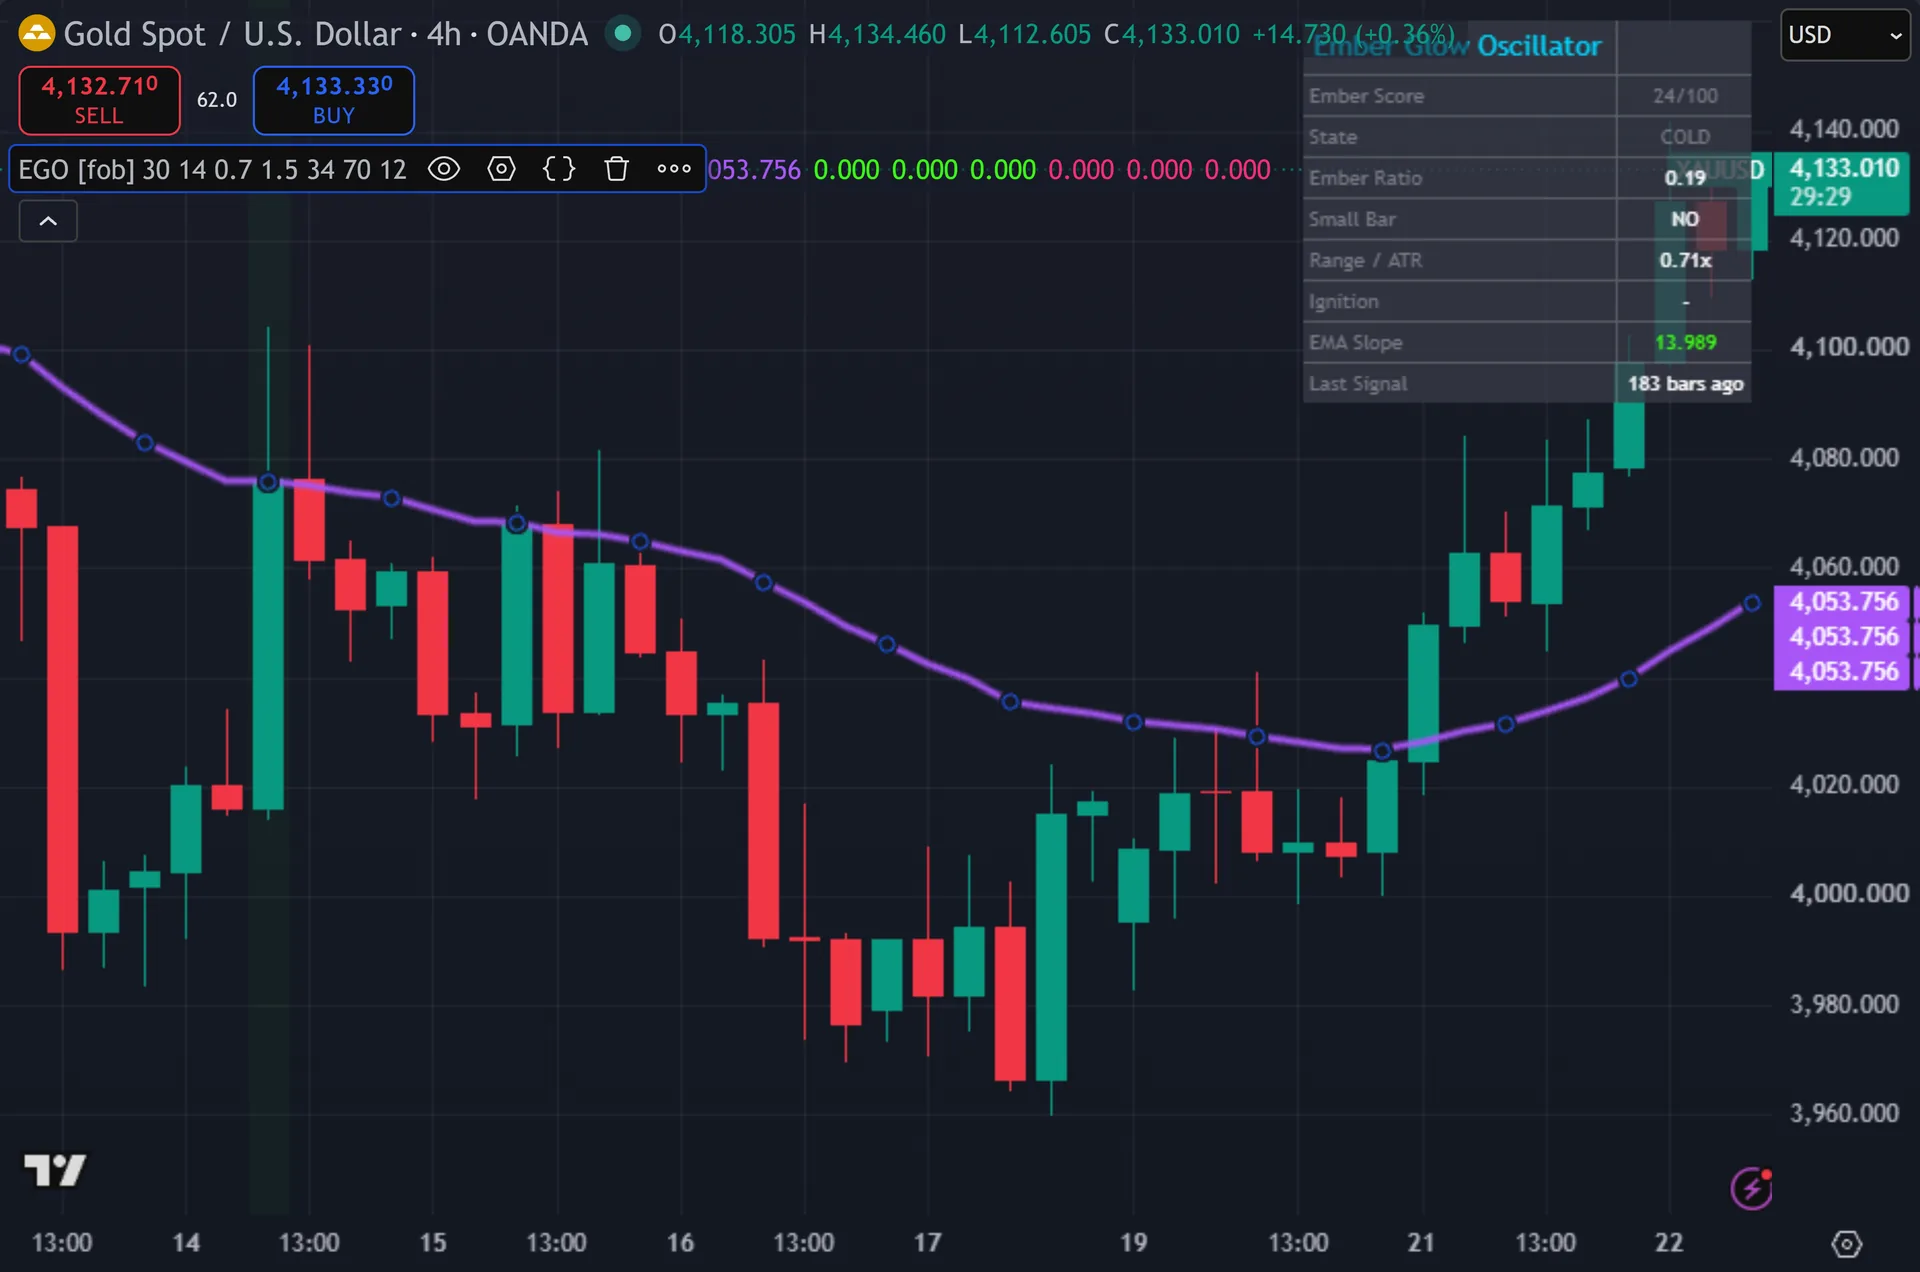
Most of the maths stays relative. Thus, ranges read in ATR multiples, slope divides by ATR, and volume appears only as a ratio. So the defaults travel across markets without retuning. Volume itself is the exception. Spot forex has no central exchange, so what your broker reports is tick volume, a count of price updates rather than traded size. Hence, the ember ratio still works there as a proxy, but treat it as one. On instruments with no volume feed the ratio collapses and signals stop.
Limitations worth knowing
It is not an oscillator in the usual sense. Next, it plots no curve in a sub-pane and has no overbought or oversold zone. The only continuous readings are the ember ratio and the 0 to 100 score, and both live in the dashboard rather than on a line.
The tool needs volume, and it needs quiet bars. Then, tick volume on spot forex is only a proxy for size. In a stretch where every candle runs above 0.7 x ATR, no bar qualifies as small, the ember sum stays at zero and no signal can fire at all.
It flags one moment and stops there. Yet, there is no stop, no target, no sizing and no exit logic. The 12-bar cooldown also blocks a second ignition that follows quickly, which during a fast expansion is often the better entry of the two.
Get Ember Glow Oscillator on TradingView
Open Ember Glow Oscillator on TradingView
If you also trade MetaTrader, the MT4 and MT5 indicator library is available below.
Get the complete indicator library
One email unlocks the full MT4 and MT5 indicator library. Truly, this TradingView script stays free on TradingView – the button above adds it to your chart.
Using it alongside MetaTrader
Adding a script on TradingView takes one click, so there is no install step here. Plainly, if you want the same idea on MetaTrader, the MT4 and MT5 indicator installation guide walks through copying files into the data folder and attaching them to a chart. You can also browse the full MetaTrader indicator library, the MT4 indicators section, or the other free TradingView scripts published on this profile. For related chart tools see the MT5 indicators section and the forex trading strategies guides.
External references
- Breakout (technical analysis) on Wikipedia
- On-Balance Volume at Investopedia
- CandleVolume at StockCharts ChartSchool
Frequently asked questions
Does the Ember Glow Oscillator repaint?
No. Also, both entry flags include barstate.isconfirmed, and the triangles, the labels and the bar colouring all read those flags. So a printed signal is final. Indeed, the background tint and the dashboard do update inside the forming bar, because they read the live score.
Why is it called an oscillator when it draws on price?
The script declares overlay=true, so it sits on the candles. Still, the oscillating quantity is the ember ratio, which runs from -1 to +1, and it appears as a dashboard number instead of a plotted line. Expect an overlay tool with a numeric readout, not a sub-pane curve.
What counts as a small bar?
A bar whose high-to-low range sits at or under 0.7 x ATR(14). Thus, the ceiling is adjustable from 0.2 to 2.0. Raise it and more bars feed the ember, which smooths the ratio but makes it less selective about which bars count as quiet.
Why did a big breakout candle print no triangle?
A signal needs every gate at once. Hence, the ratio sign must match, and close must sit on the correct side of the 34-EMA. The EMA slope sign must match too. Then the score needs 70 or more, on a closed bar, with the cooldown elapsed. A wide candle that runs against the EMA fails two of those gates on its own.
How much should I rely on this indicator?
Treat it as one input, not a decision. Next, it is a chart analysis tool, not trading advice. Test it on your own markets and timeframes before relying on it. Results are not guaranteed; past performance is not indicative of future results.

About the author
Written by Dominic Walsh, a Forex trader and MT4/MT5 indicator, Expert Advisor and script developer. Every tool on forexmt4systems.com is tested on live charts before release and ships with ready-to-use compiled MT4 (.ex4) and MT5 (.ex5) files. Learn more about the trader and developer behind this site.