
Not every level deserves the same weight. Also, fractal Breakout Scanner, a free fractal breakout indicator TradingView traders can add in seconds, builds its levels from confirmed 3-bar fractals, then counts how often price returns to each one. Levels price revisits draw thicker and brighter. Indeed, when price finally closes through one on above-average volume, the script marks the break and names the level it broke.
It is free and open source. Still, you can add it to any chart from the Fractal Breakout Scanner script page on TradingView, and the full Pine source is published there for you to read.
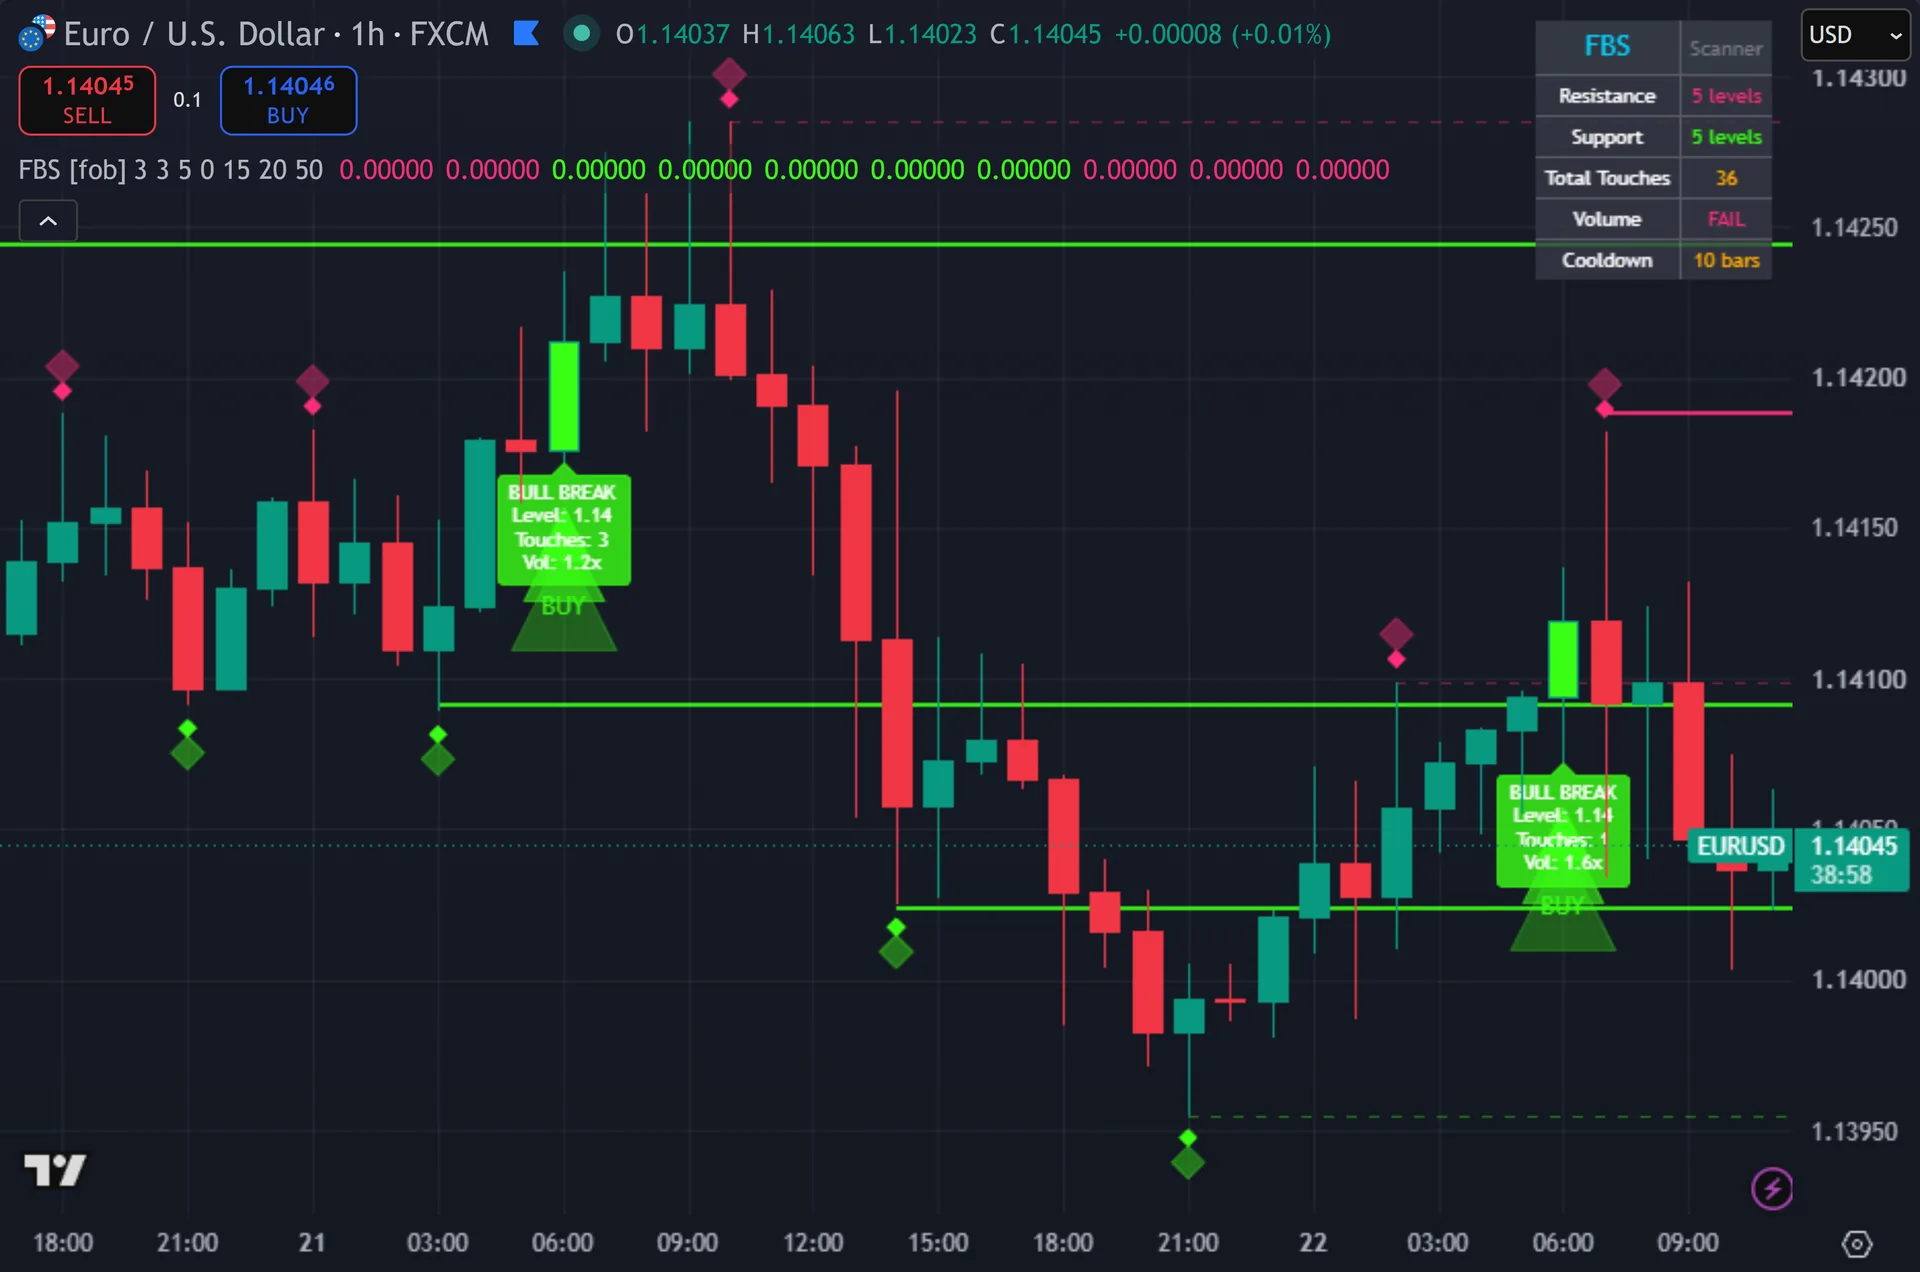
What Fractal Breakout Scanner plots on the price chart
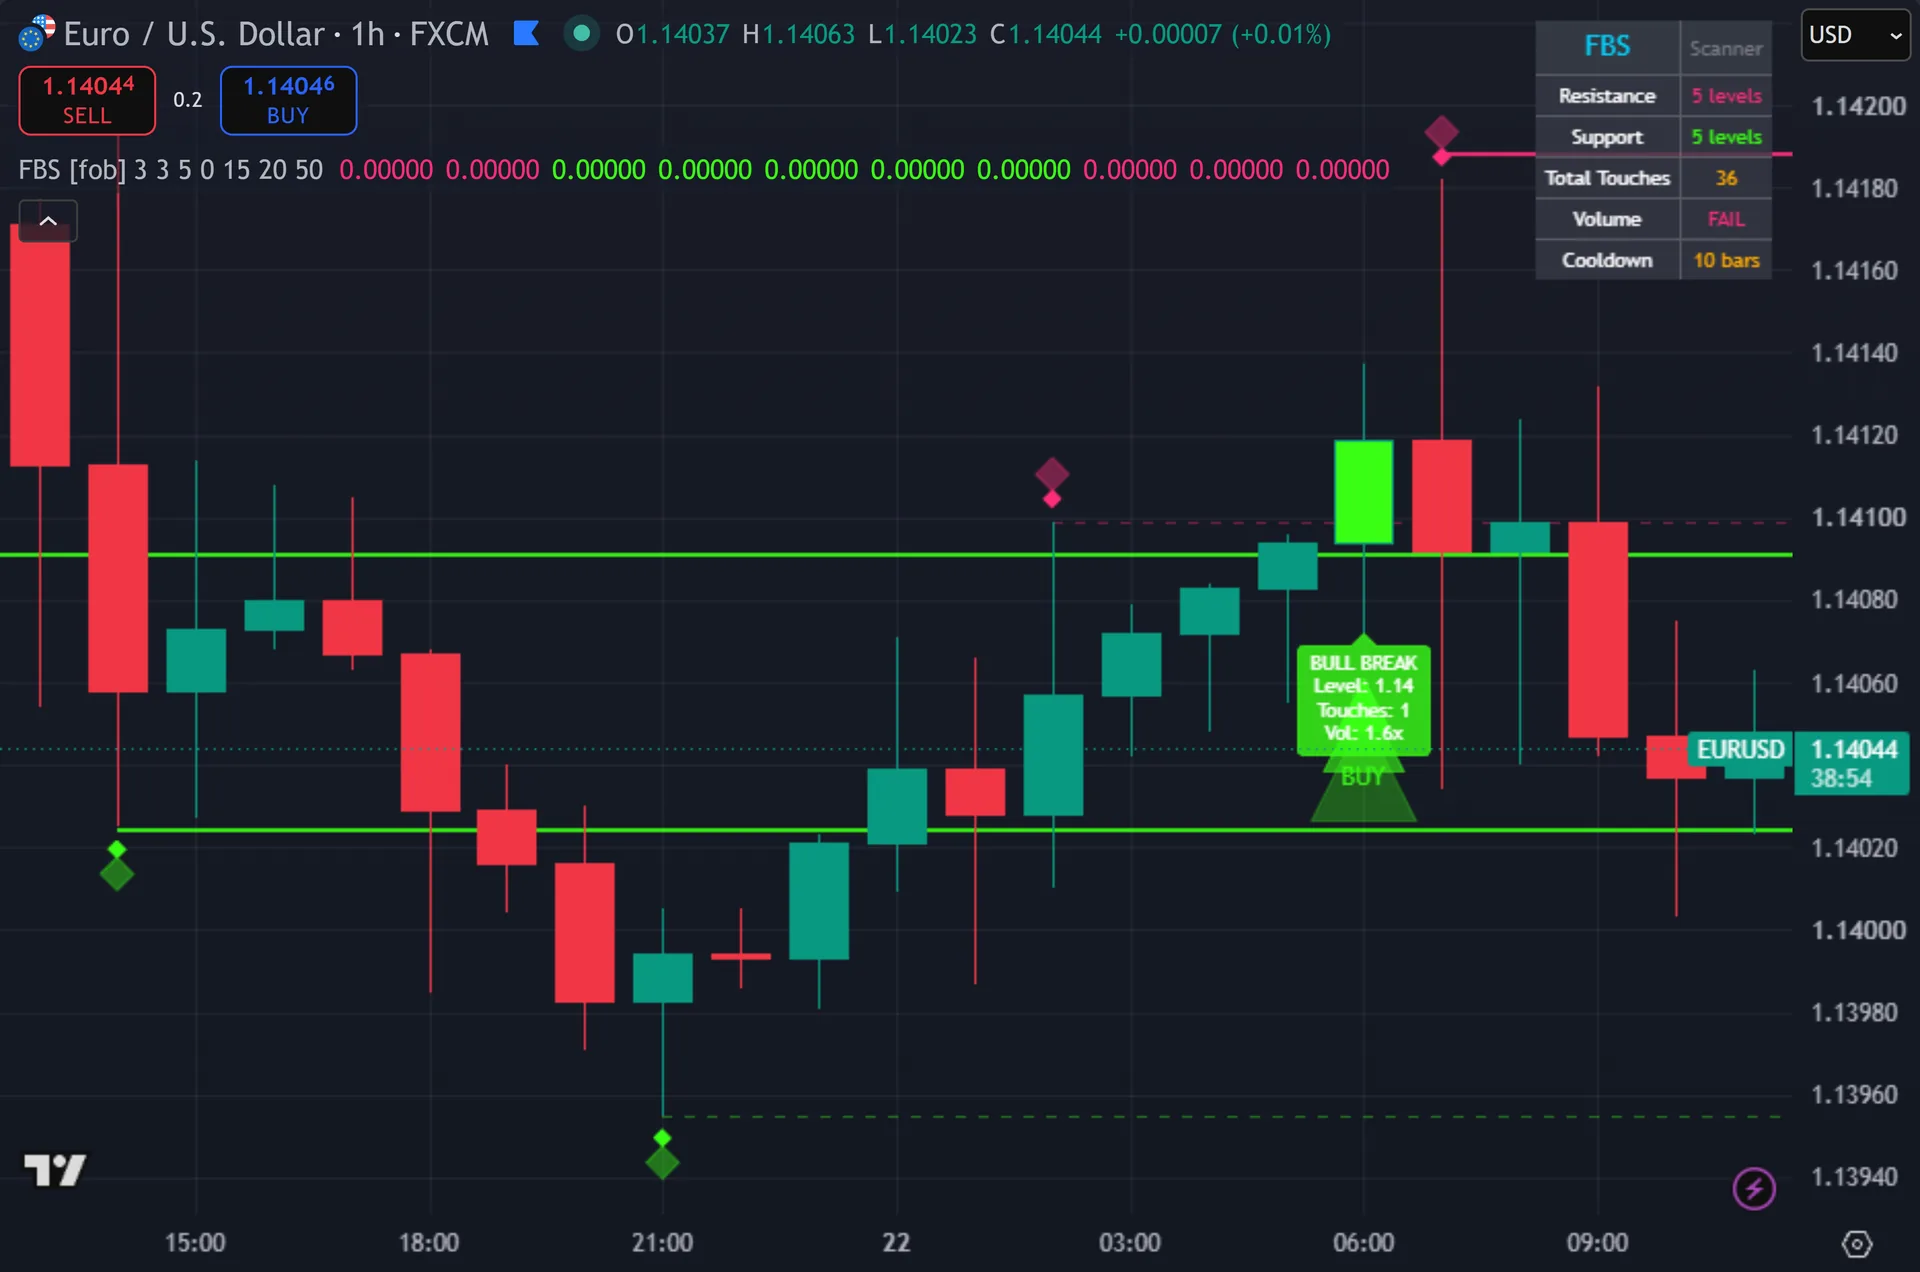
Small diamond dots mark each confirmed fractal, pink above highs and green below lows, offset back onto the pivot bar itself. Thus, horizontal lines extend 50 bars to the right from every tracked level. Line color brightens and width doubles as touch counts rise, and lines turn solid at three touches. Hence, breakouts print a triangle with two glow layers plus a label carrying the broken level, its touch count and the volume ratio. A six-row table reports support and resistance counts, total touches, the volume check and cooldown state.
How Fractal Breakout Scanner is built
Building levels that remember
The script uses ta.pivothigh and ta.pivotlow with three bars on each side. Next, a fractal high needs the highest high of a seven-bar window sitting in the middle. Confirmation therefore arrives three bars after the pivot forms. Then, the dots use an offset of minus three so they sit on the correct candle, but the level itself exists only from the confirmation bar onward.
New fractals do not always create new levels. Yet, the script first checks every stored level of the same type. If the new fractal sits within 0.3 ATR of an existing one, it merges. Truly, the old level keeps its price and gains a touch. That merge rule stops a wall of near-identical lines forming around one zone.
Levels live in a typed array holding price, touch count, birth bar and side. Plainly, the array caps at twice your Max S/R Levels input, so ten by default. When it fills, the oldest entry drops and the script deletes its line. Also, touches also accrue without a new fractal. Each closed bar that comes within 0.3 ATR of a level, after sitting outside that distance on the previous bar, adds one.
Confirming the break
A breakout needs four things at once. Indeed, the bar must be closed, which the script enforces with barstate.isconfirmed. Volume must exceed its own 20-bar simple moving average. Still, the 15-bar cooldown must have elapsed. And the close must cross a stored level while the previous close sat on the other side.
The Breakout Buffer input adds distance past the level, measured in ticks and converted through syminfo.mintick. Thus, it defaults to zero, so a plain close beyond the level qualifies. Raise it and price must clear the line by a set margin before the script accepts the break.
The scan stops at the first level that qualifies, so one bar yields one signal. Hence, the label then reports what broke: the level price, the touches it had accumulated and current volume as a multiple of its average. A four-touch level breaking on 2.1 times volume reads very differently from a single-touch level breaking on 1.0.
How to read the signals
Read the line before the arrow. Next, touch count is the whole point of the tool. A solid, thick line has held three or more tests. Then, a thin dashed line has one touch behind it. The break of the first carries more structural meaning than the break of the second.
The label hands you both numbers at the moment of the break. Use them together. High touches with a strong volume multiple describes the classic level break. Yet, low touches on barely-passing volume describes a bar that happened to close through an old fractal.
Mind the confirmation lag on levels. Truly, a fractal confirms three bars after it prints, so a very fast break of a fresh pivot can happen before the level exists. Breakout signals themselves need a closed bar, so they never appear and then vanish.
Every Fractal Breakout Scanner setting explained
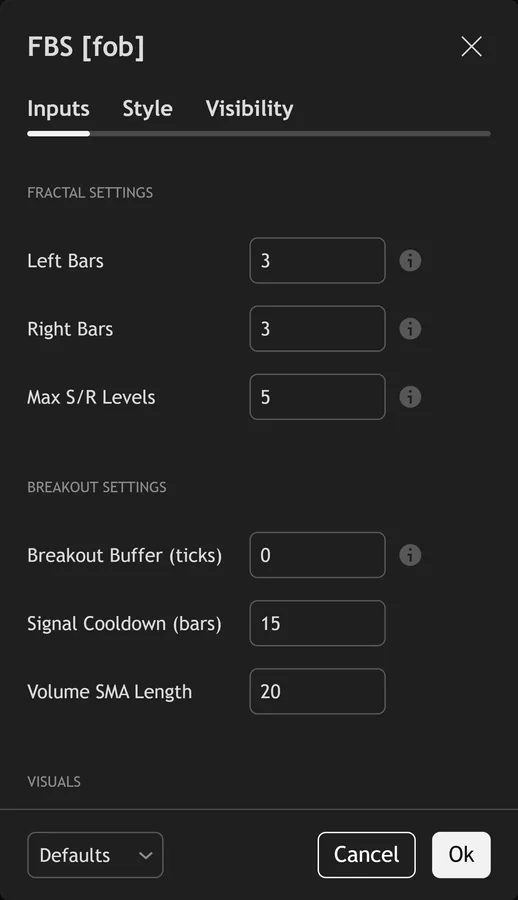
The script exposes 10 inputs, grouped in the settings panel exactly as shown below. Defaults are the published values.
Fractal Settings
| Setting | What it does | Default | Range |
|---|---|---|---|
| Left Bars | Bars to the left of the pivot | 3 | |
| Right Bars | Bars to the right confirming the pivot | 3 | |
| Max S/R Levels | Maximum fractal levels to track | 5 | 1 to 10 |
Breakout Settings
| Setting | What it does | Default | Range |
|---|---|---|---|
| Breakout Buffer (ticks) | Extra distance past level to confirm breakout | 0.0 | |
| Signal Cooldown (bars) | Sets the signal cooldown (bars) used in the calculation. | 15 | |
| Volume SMA Length | Sets the volume sma length used in the calculation. | 20 |
Visuals
| Setting | What it does | Default | Range |
|---|---|---|---|
| Show Fractal Dots | Toggles show fractal dots on the chart. | on | on / off |
| Show S/R Lines | Toggles show s/r lines on the chart. | on | on / off |
| Line Extension (bars) | Sets the line extension (bars) used in the calculation. | 50 | |
| Show Info Table | Toggles show info table on the chart. | on | on / off |
Alerts built into Fractal Breakout Scanner
The script ships 13 alert conditions. Plainly, open the alert dialog on the chart, pick the indicator as the condition source, then choose the event you want. Alerts fire on the close of the bar, so they follow the same confirmed-bar rule the on-chart signals use.
- FBS Buy Signal
- FBS Sell Signal
- FBS Any Signal
- FBS Fractal High
- FBS Fractal Low
- FBS Any Fractal
- FBS Volume Spike
- FBS 20-Bar High
- FBS 20-Bar Low
Other markets and timeframes
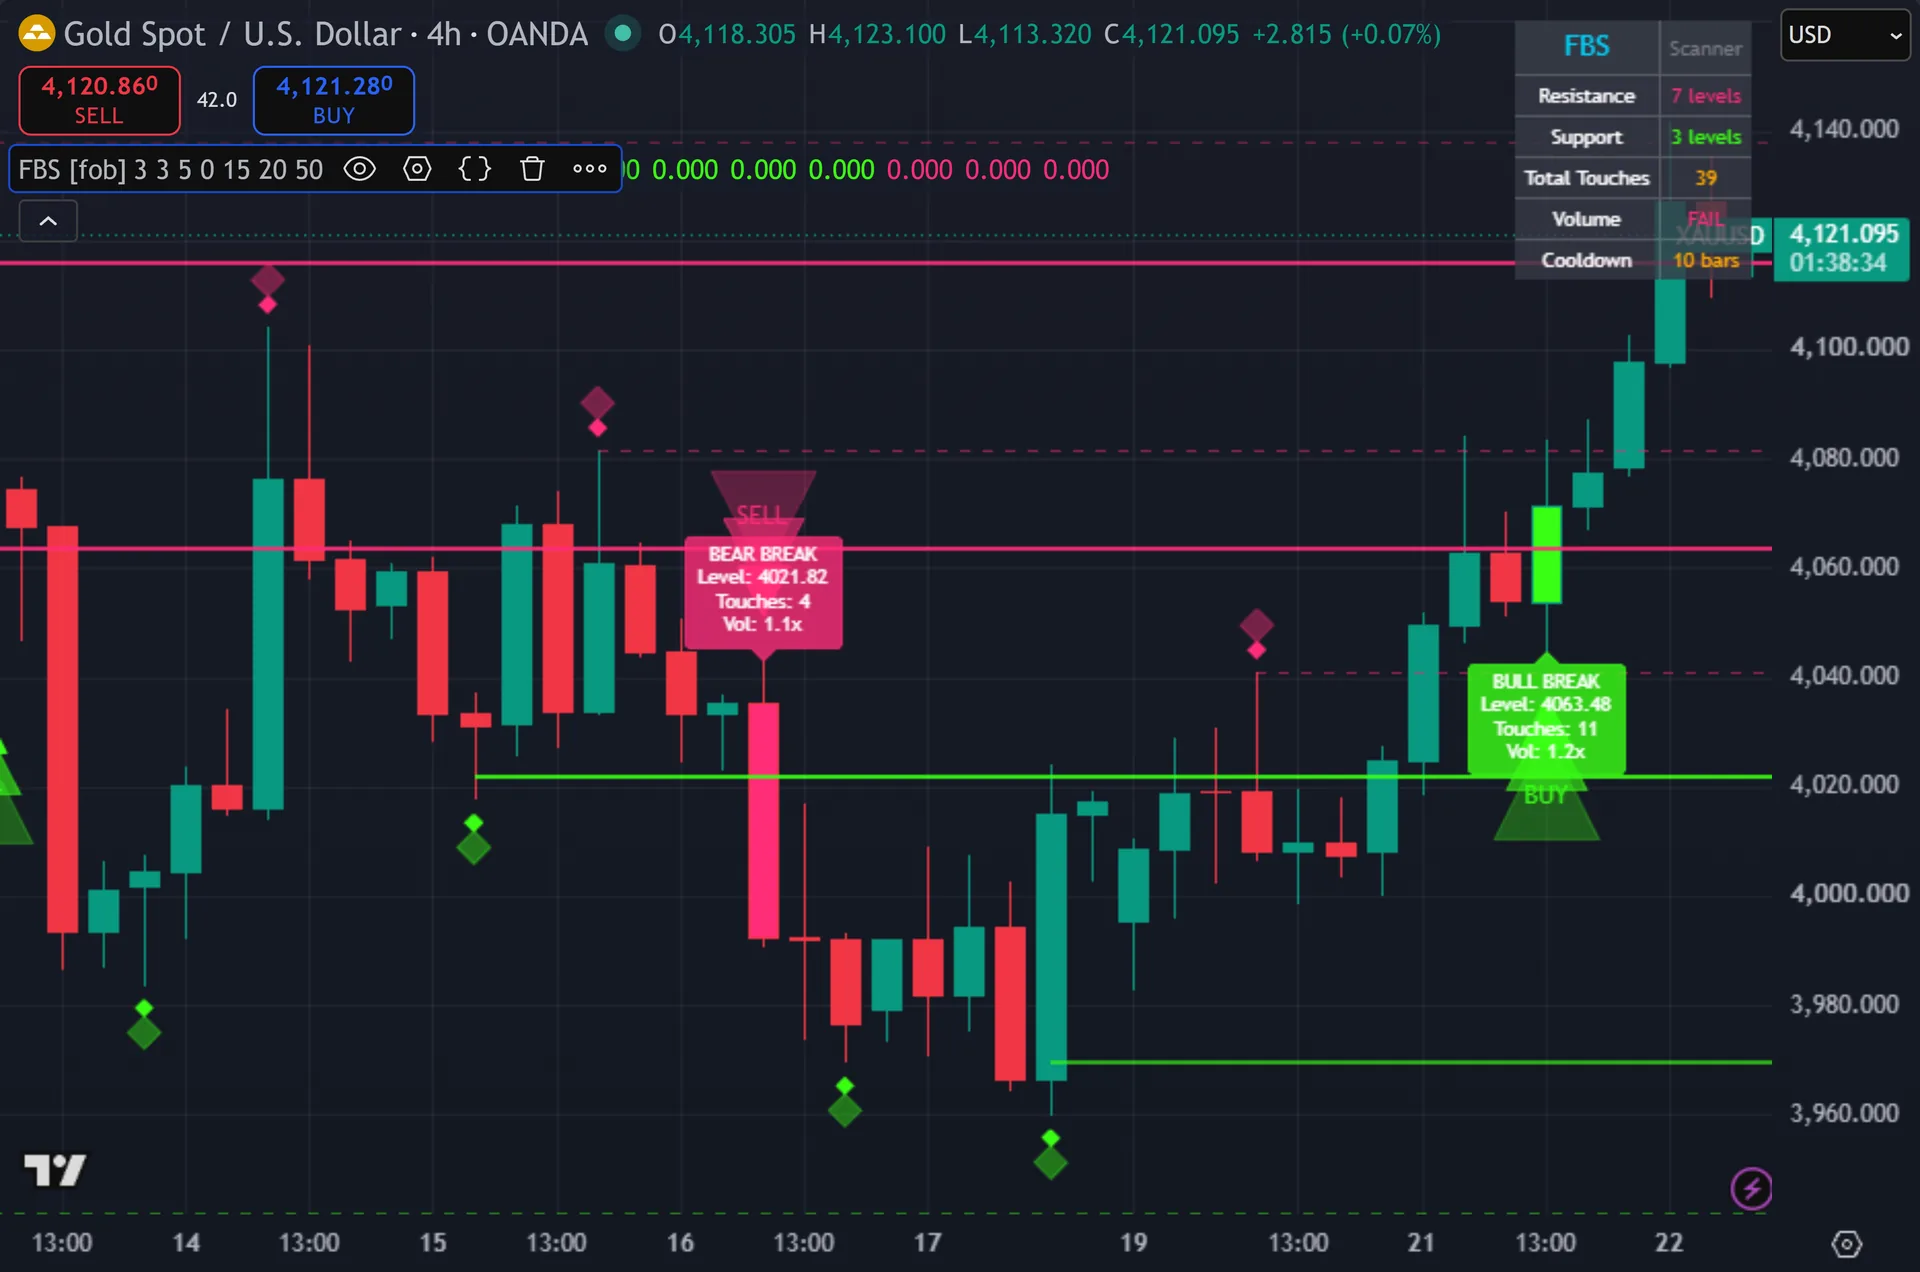
The level logic stays fully relative. Also, merge distance and touch distance both scale with 0.3 ATR, so the scanner behaves the same on any symbol and any timeframe without retuning. The volume filter is the part to think about. Indeed, spot forex charts report broker tick volume, which counts price updates rather than contracts traded. It still separates active bars from quiet ones. On symbols with no volume feed at all, the filter never passes and no breakout can print.
Limitations worth knowing
The scanner tracks a maximum of ten levels and drops the oldest when full. Still, long-standing higher timeframe levels can therefore fall off the list on a fast chart. It also never calls request.security, so everything you see comes from the chart timeframe alone.
A close beyond a level is not a held break. Thus, the script waits for no retest and measures no follow-through. False breaks look identical to real ones at the moment they print.
The 15-bar cooldown blocks a second signal even when a different genuine level breaks soon after the first. Hence, touch counting also stays approximate, since it registers only when a bar closes inside 0.3 ATR of the line after previously sitting outside it.
Get Fractal Breakout Scanner on TradingView
Open Fractal Breakout Scanner on TradingView
If you also trade MetaTrader, the MT4 and MT5 indicator library is available below.
Get the complete indicator library
One email unlocks the full MT4 and MT5 indicator library. Next, this TradingView script stays free on TradingView – the button above adds it to your chart.
Using it alongside MetaTrader
Adding a script on TradingView takes one click, so there is no install step here. Then, if you want the same idea on MetaTrader, the MT4 and MT5 indicator installation guide walks through copying files into the data folder and attaching them to a chart. You can also browse the full MetaTrader indicator library, the MT4 indicators section, or the other free TradingView scripts published on this profile. For related chart tools see the MT5 indicators section and the forex trading strategies guides.
External references
- Breakout (technical analysis) on Wikipedia
- Pivot Point at Investopedia
- Support and Resistance at StockCharts ChartSchool
Frequently asked questions
Does Fractal Breakout Scanner repaint?
Breakout signals do not. Yet, they require barstate.isconfirmed, so the triangle prints on the close and stays. The fractal dots are a separate case. Truly, they confirm three bars after the pivot, then draw backwards onto the pivot bar, which is normal behavior for fractal tools.
What does the touch count mean?
It counts how often price has interacted with that level. Plainly, a new fractal within 0.3 ATR of an existing level merges into it and adds one. A closed bar arriving within 0.3 ATR from outside also adds one. Also, three or more touches turns the line solid and thicker.
Can I show more levels on the chart?
Yes. Indeed, max S/R Levels sets the base count and the array holds twice that number, so the default of five tracks up to ten. Raise it for a busier map. Still, lowering the left and right bar settings also produces more fractals, which fills the list faster.
Why did a clear breakout print no arrow?
Three gates can stop it. Thus, volume may have failed to beat its 20-bar average, the 15-bar cooldown may still be running, or the level may have dropped out of the array. The table shows the volume check and the cooldown countdown live.
How much should I rely on this indicator?
Treat it as one input, not a decision. Hence, it is a chart analysis tool, not trading advice. Test it on your own markets and timeframes before relying on it. Results are not guaranteed; past performance is not indicative of future results.

About the author
Written by Dominic Walsh, a Forex trader and MT4/MT5 indicator, Expert Advisor and script developer. Every tool on forexmt4systems.com is tested on live charts before release and ships with ready-to-use compiled MT4 (.ex4) and MT5 (.ex5) files. Learn more about the trader and developer behind this site.
How we build, test and correct every tool: Editorial & Testing Policy. Trading carries risk; see the disclaimer.