
Price rarely stalls where nobody traded. Also, liquidity Void Mapper, a free volume profile indicator TradingView traders can add in one click, finds those thin pockets for you. It slices the last 50 bars into 20 price rows, spreads each bar’s volume across the rows it covered, then boxes any row holding under 30 percent of the average. Indeed, an entry into a void, with trend and volume agreeing, prints an arrow.
It is free and open source. Still, you can add it to any chart from the Liquidity Void Mapper script page on TradingView, and the full Pine source is published there for you to read.
What Liquidity Void Mapper plots on the price chart
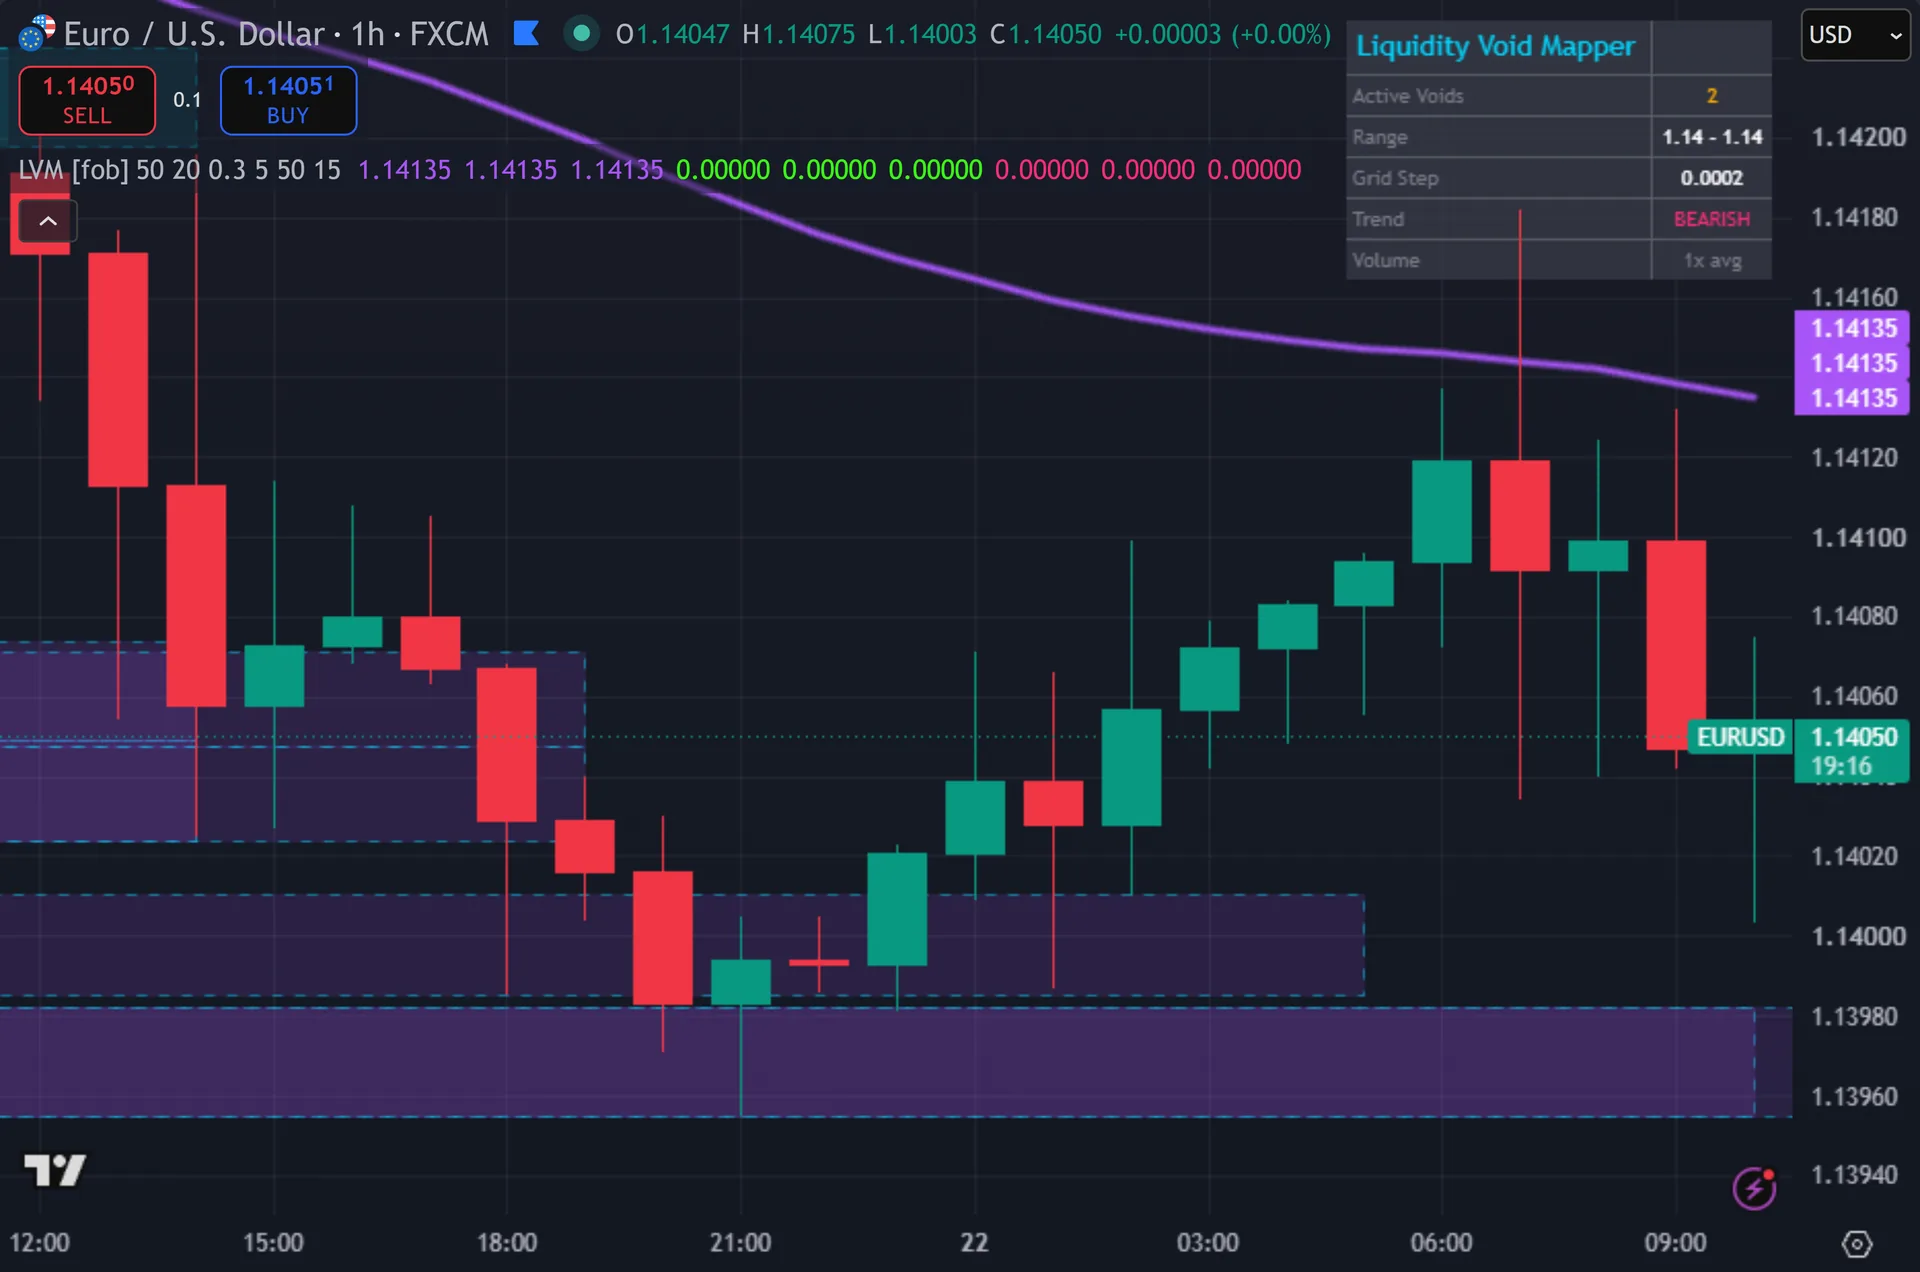
Dashed boxes mark each void row. Thus, they reach back over the lookback window and 10 bars into the future. Colour shows where price sits: cyan when price trades below the void, purple when above, gold when inside it. Hence, a purple 50-period EMA runs across the chart in three layers, thick and faint underneath, thin and solid on top. Signals arrive as green BUY and pink SELL triangles with a label. Next, the script also paints the signal bar and flashes the background. A six-row table lists active voids, the range, grid step, trend and relative volume.
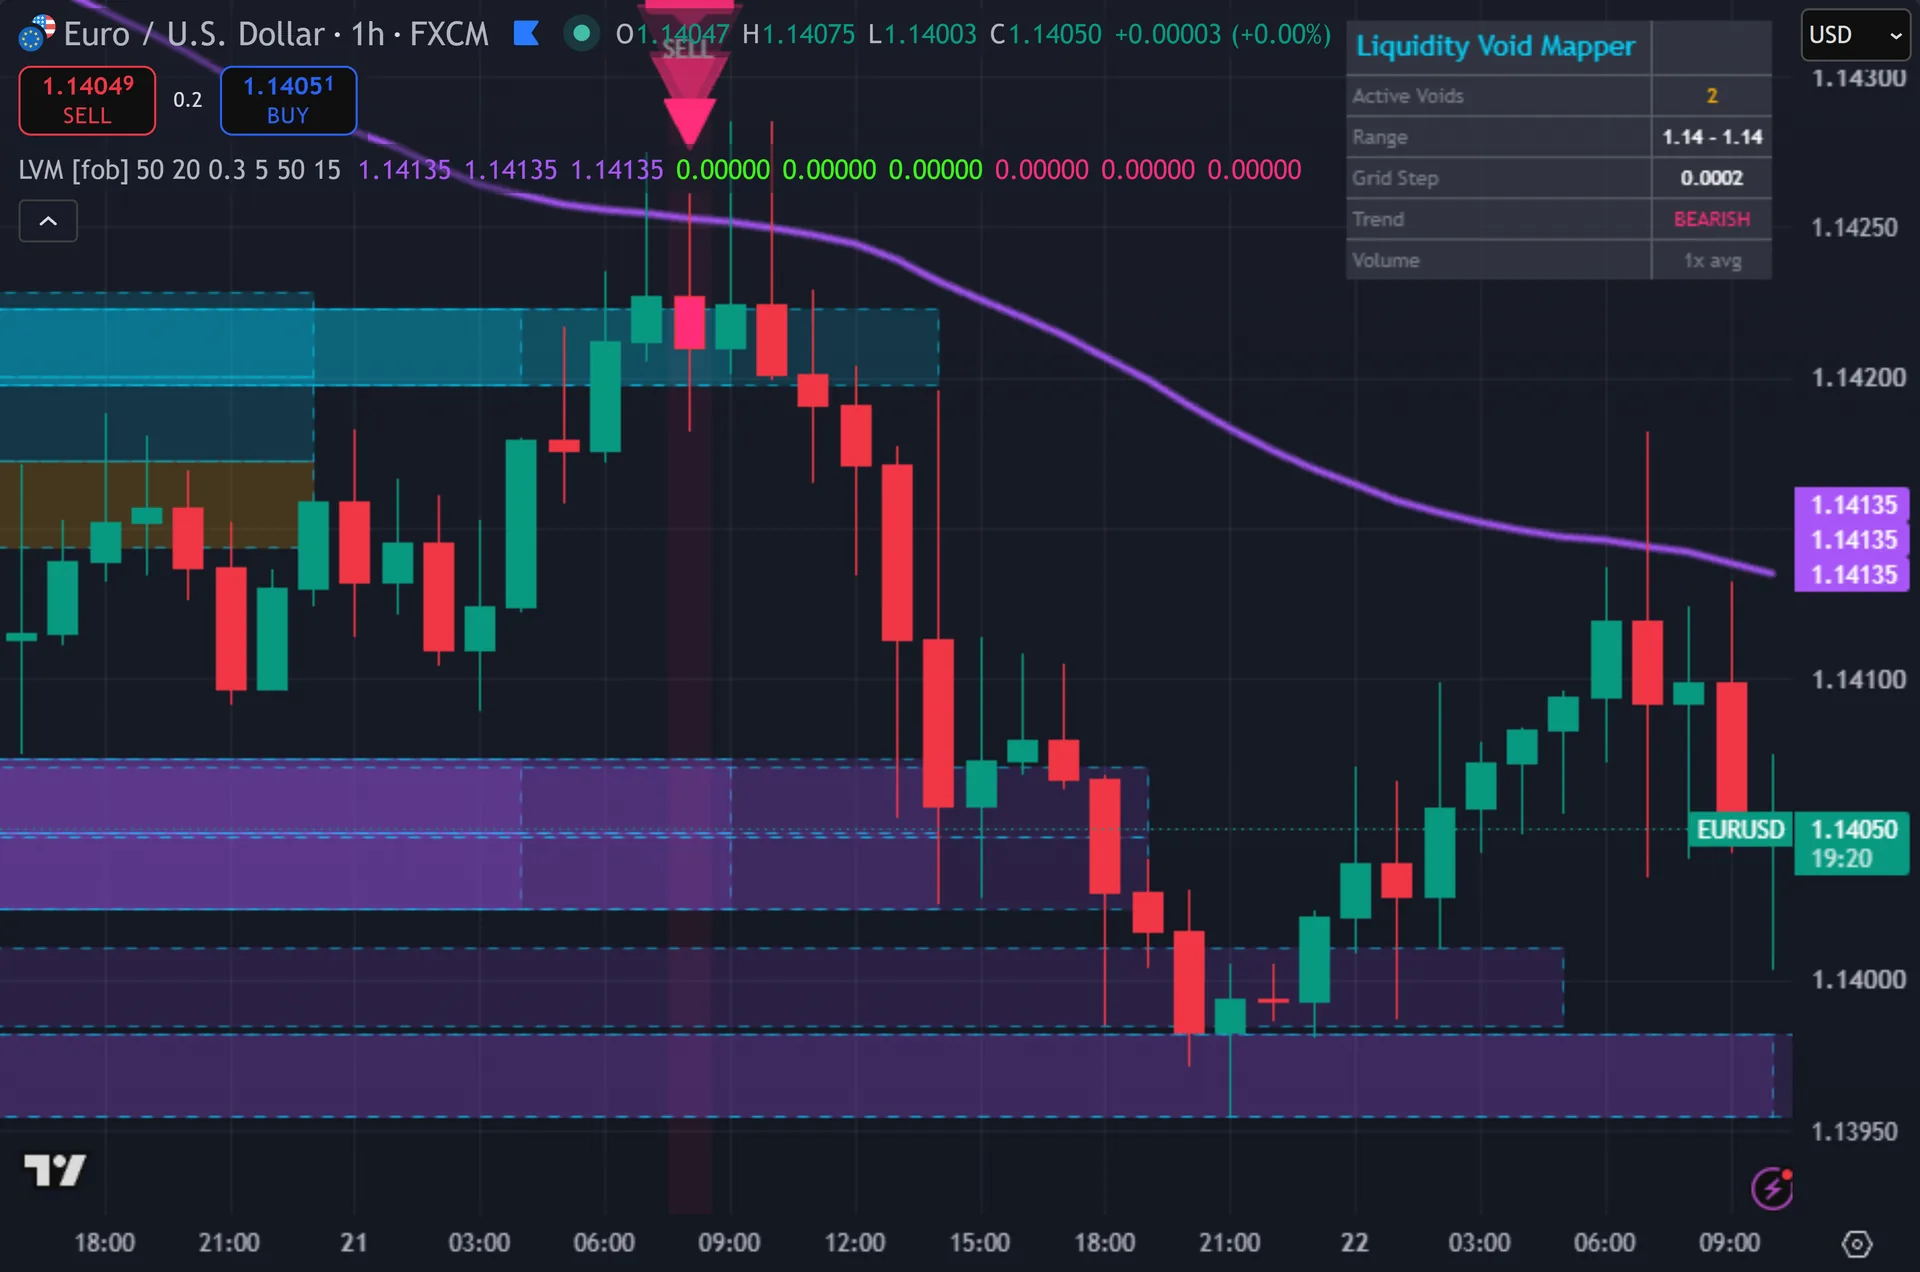
How Liquidity Void Mapper is built
Step one: build the volume grid
The script takes the highest high and the lowest low across the last 50 bars, then splits that range into 20 equal rows. Then, each row stands one grid step tall. This is a lightweight volume profile, built from the chart’s own bars rather than tick data.
Filling the grid is the interesting part. For every bar in the lookback, the script works out which rows the bar’s high and low span. It then splits that bar’s volume evenly across those rows. Yet, a wide bar therefore spreads its volume thin, while a tight bar dumps everything into one or two rows. Summing all rows and dividing by 20 gives the average row volume.
The whole grid rebuilds every fifth bar, and only on a confirmed bar. Truly, that keeps the nested loops cheap. It also means the map on your screen can run up to four bars behind price.
Step two: mark voids and time the entry
Each row earns a ratio: its own volume divided by the average row volume. Plainly, a row qualifies as a void when that ratio drops under 0.30. The script keeps the first five qualifying rows, scanning upward from the bottom of the range, and stores the top price, bottom price and ratio for each.
Entry logic watches the boundary. Also, the script asks whether this close sits inside a void row while the previous close sat at or below its floor. That marks an entry from below. Indeed, the mirror test, with the previous close at or above the ceiling, marks an entry from above.
Three filters then decide. Still, a buy needs close above the 50 EMA, volume above its 20-bar average, and 15 bars since the last signal. A sell needs close below the EMA with the same volume and cooldown rules. Thus, every signal waits for the bar to close first.
How to read the signals
Treat a void as thin ice, not a target. Hence, little volume traded there, so price often crosses it fast rather than grinding through. The colour gives you the current relationship: cyan means price sits below the pocket, purple means above, gold means inside it.
The arrow marks the moment price steps into a void with trend and volume behind it. Next, the idea is simple. Thin levels offer little friction, so a push in the EMA’s direction may carry across the gap. Then, watch the far side of the box, where volume picks up again.
Check the table’s Volume row before you act. Yet, it shows current volume as a multiple of its 20-bar average. A reading barely over 1.00x cleared the filter by a hair. Truly, active Voids tells you how many pockets the last rebuild found, up to the five-zone display cap.
Every Liquidity Void Mapper setting explained
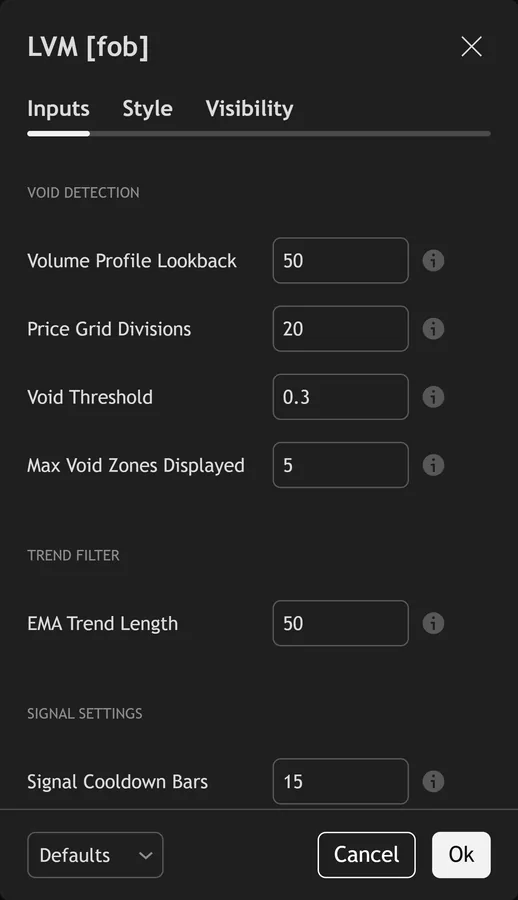
The script exposes 9 inputs, grouped in the settings panel exactly as shown below. Defaults are the published values.
Void Detection
| Setting | What it does | Default | Range |
|---|---|---|---|
| Volume Profile Lookback | Number of bars to analyze for volume distribution | 50 | 20 to 200 |
| Price Grid Divisions | Number of price levels to divide the range into | 20 | 10 to 50 |
| Void Threshold | Volume fraction below which a zone is considered a void (relative to average) | 0.3 | 0.05 to 0.8 |
| Max Void Zones Displayed | Maximum number of void boxes to show on chart | 5 | 1 to 15 |
Trend Filter
| Setting | What it does | Default | Range |
|---|---|---|---|
| EMA Trend Length | EMA length for trend direction filter | 50 | 10 to 200 |
Signal Settings
| Setting | What it does | Default | Range |
|---|---|---|---|
| Signal Cooldown Bars | Minimum bars between signals | 15 | 5 to 50 |
Visual Settings
| Setting | What it does | Default | Range |
|---|---|---|---|
| Show Void Boxes | Display liquidity void zones on chart | on | on / off |
| Show Info Table | Display summary table | on | on / off |
| Show Glow Effects | Enable 3-layer glow on signals | on | on / off |
Alerts built into Liquidity Void Mapper
The script ships 11 alert conditions. Plainly, open the alert dialog on the chart, pick the indicator as the condition source, then choose the event you want. Alerts fire on the close of the bar, so they follow the same confirmed-bar rule the on-chart signals use.
- LVM Buy Signal
- LVM Sell Signal
- LVM Any Signal
- LVM Void Entry Below
- LVM Void Entry Above
- LVM Many Voids
- LVM Volume Confirm
- LVM Any Void Entry
- LVM Webhook JSON
Other markets and timeframes
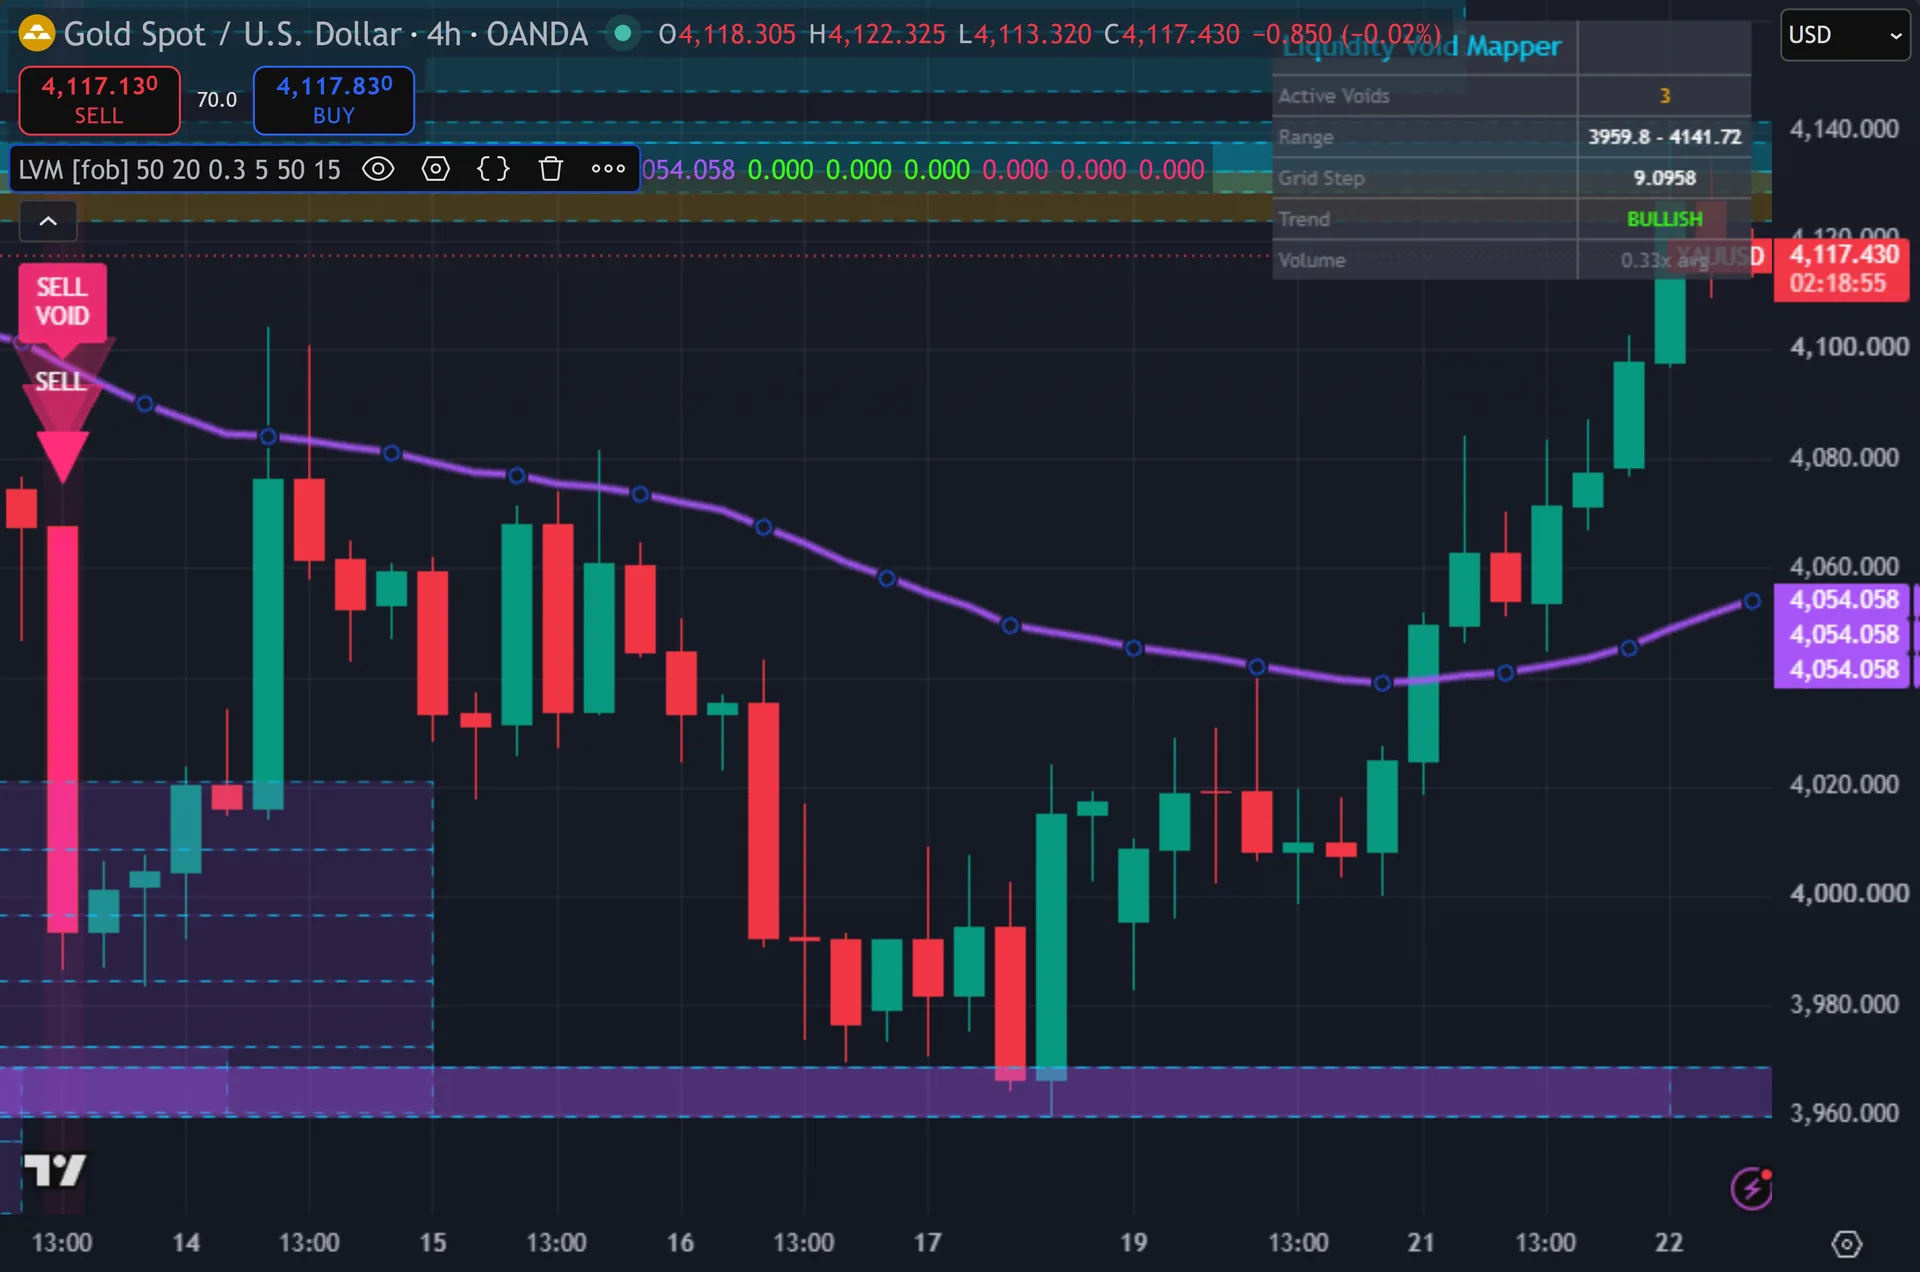
Every test here is a ratio. Also, voids come from row volume against average row volume, the trend gate uses an EMA of price itself, and the filter compares volume to its own 20-bar average. No absolute price or pip value appears anywhere. Indeed, so indices, crypto, gold and equities all run on the defaults. The catch is the volume feed. Still, spot forex uses broker tick volume, which approximates activity rather than measuring it, and instruments with no volume data produce a flat, useless grid.
Limitations worth knowing
The profile refreshes every five bars, so the boxes can trail price by up to four bars. On a fast chart that gap matters. The script trades freshness for speed, because rebuilding a 50 by 20 grid on every bar runs heavy.
The script spreads each bar’s volume evenly across the rows it covers. Thus, real activity clusters unevenly inside a bar. So this approximates a true volume profile rather than reproducing one, and wide bars smear their volume across many rows.
Old boxes stay on the chart. Hence, the script draws a fresh set every five bars without deleting the previous ones, so zones pile up until TradingView’s 500-box ceiling drops the oldest. Read the newest boxes near price and ignore the trail behind them.
Get Liquidity Void Mapper on TradingView
Open Liquidity Void Mapper on TradingView
If you also trade MetaTrader, the MT4 and MT5 indicator library is available below.
Get the complete indicator library
One email unlocks the full MT4 and MT5 indicator library. Next, this TradingView script stays free on TradingView – the button above adds it to your chart.
Using it alongside MetaTrader
Adding a script on TradingView takes one click, so there is no install step here. Then, if you want the same idea on MetaTrader, the MT4 and MT5 indicator installation guide walks through copying files into the data folder and attaching them to a chart. You can also browse the full MetaTrader indicator library, the MT4 indicators section, or the other free TradingView scripts published on this profile. For related chart tools see the MT5 indicators section and the forex trading strategies guides.
External references
Frequently asked questions
Does Liquidity Void Mapper repaint?
Signals do not. Yet, every arrow gates on barstate.isconfirmed, so it prints after the bar closes. The void boxes do change, because the grid rebuilds every fifth bar and a fresh set of boxes appears at that point.
What counts as a liquidity void here?
A price row whose volume comes to less than 30 percent of the average row volume across the 50-bar window. Truly, you can move that threshold from 0.05 up to 0.80 to make voids rarer or far more common.
Why does it show only five boxes?
The Max Void Zones input caps the display at five by default. Plainly, the script keeps the first five rows that qualify while it scans upward from the bottom of the range. Raise it to 15 if you want the fuller picture.
Does it use higher timeframe data?
No. Also, everything comes from the chart’s own bars, and the script makes no request.security calls. Load it on a higher timeframe chart if you want a wider, slower map of the same idea.
How much should I rely on this indicator?
Treat it as one input, not a decision. Indeed, it is a chart analysis tool, not trading advice. Test it on your own markets and timeframes before relying on it. Results are not guaranteed; past performance is not indicative of future results.

About the author
Written by Dominic Walsh, a Forex trader and MT4/MT5 indicator, Expert Advisor and script developer. Every tool on forexmt4systems.com is tested on live charts before release and ships with ready-to-use compiled MT4 (.ex4) and MT5 (.ex5) files. Learn more about the trader and developer behind this site.