
One regression line tells you little. Also, local Linear Slope Network runs four. This linear regression slope indicator TradingView traders can drop on any chart fits a least squares line over 10, 20, 40 and 80 bars. Indeed, it then checks the sign of each fitted line’s bar to bar change. It counts how many of the four agree. Still, signals fire only when agreement first reaches your minimum, which starts at three of four.
It is free and open source. Thus, you can add it to any chart from the Local Linear Slope Network script page on TradingView, and the full Pine source is published there for you to read.
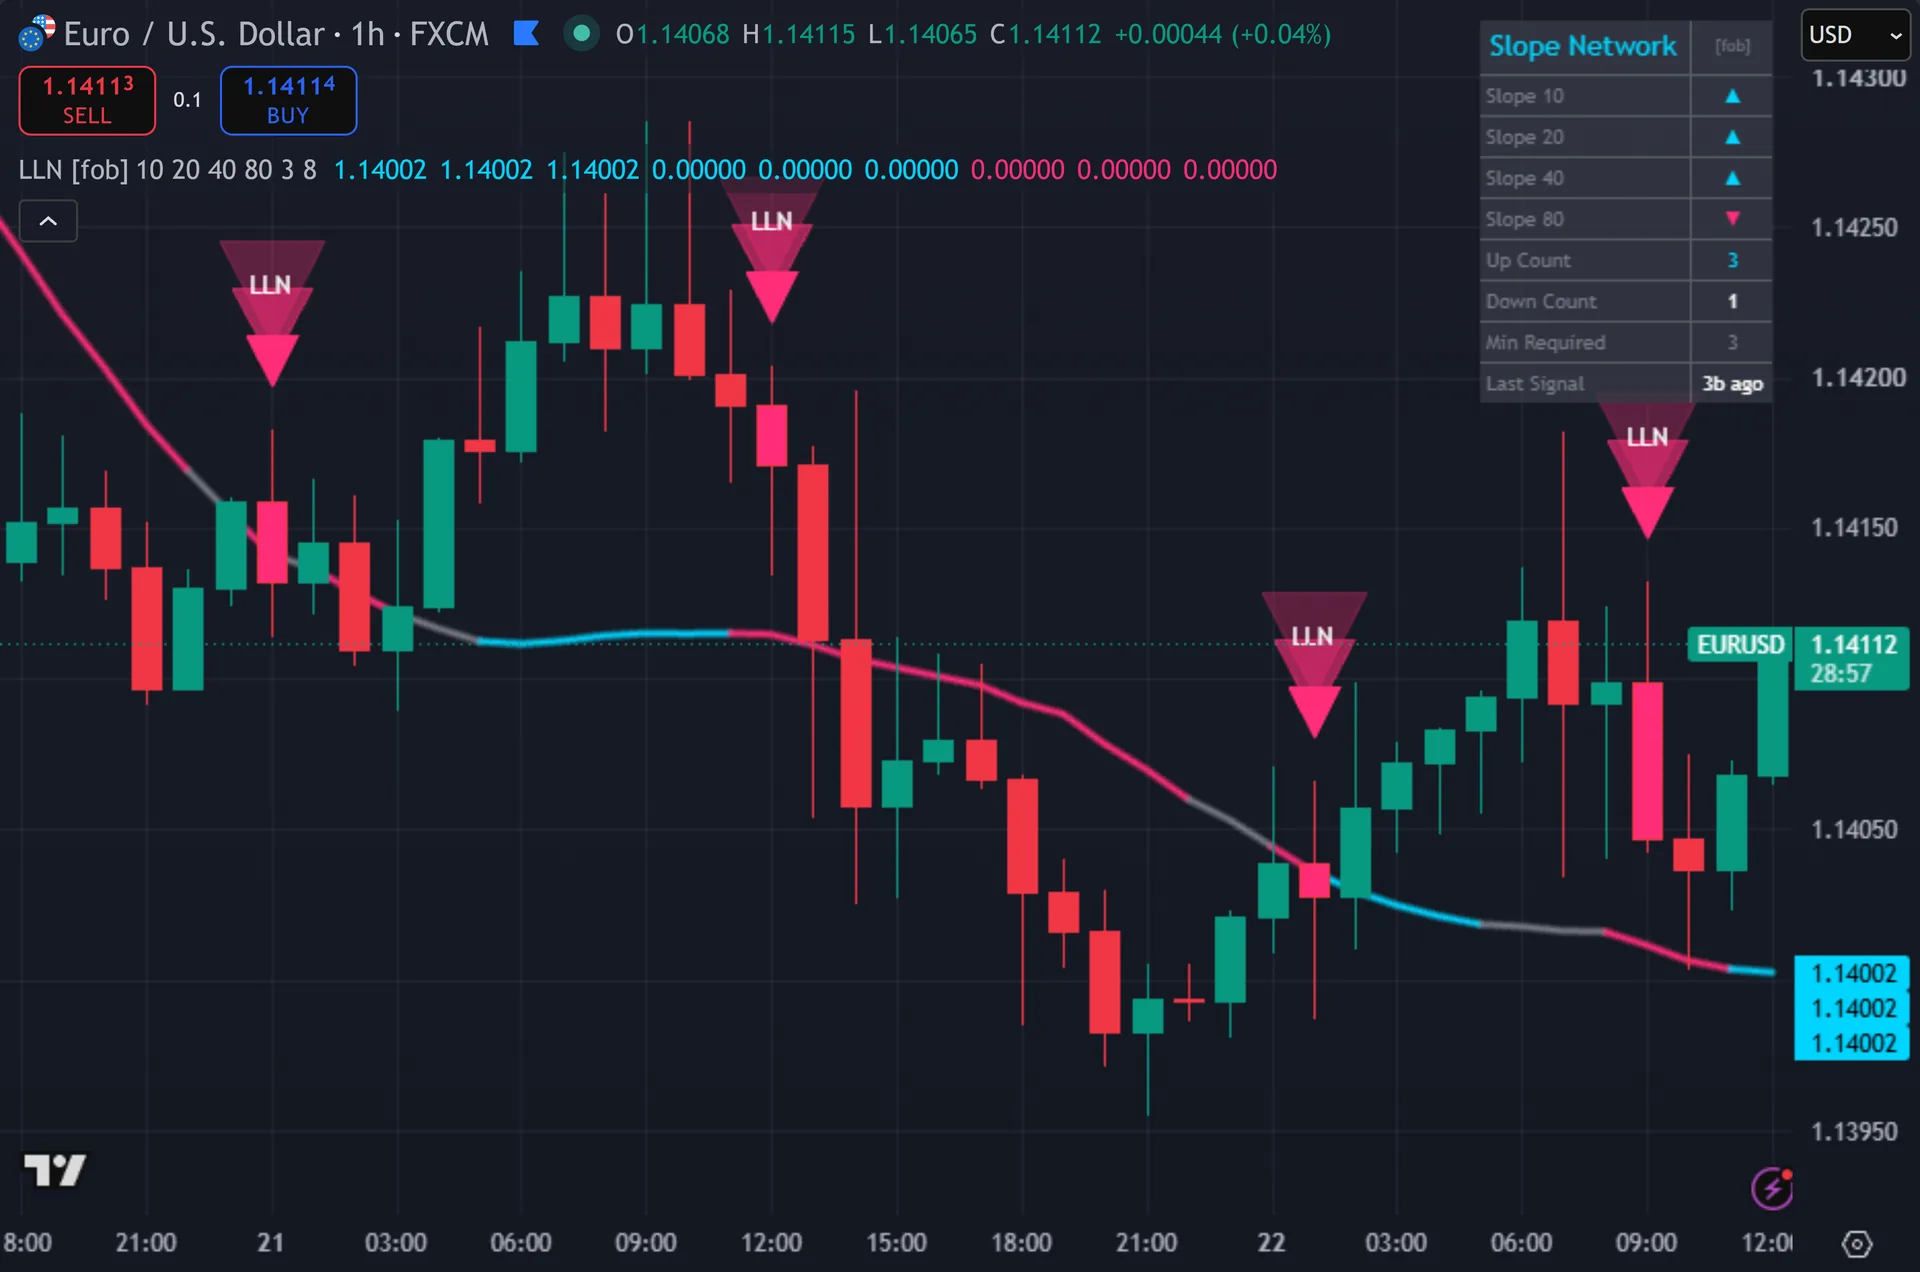
What Local Linear Slope Network plots on the price chart
The slowest regression line, 80 bars by default, sits on the price chart in three stacked layers. That builds a glow effect. Its colour follows the majority vote: cyan when more slopes point up, pink when more point down, gray on a tie. Hence, triangles mark signals below and above the bar, each carrying an LLN tag, and the script tints the signal bar too. A nine row dashboard sits top right. Next, it shows one arrow per window, the up count, the down count, your minimum and the bars since the last signal.
How Local Linear Slope Network is built
Four regressions, one direction vote
Each window calls ta.linreg(close, n, 0). Then, that returns the endpoint of a least squares line fitted to the last n closes. The script uses 10, 20, 40 and 80 bars by default. Yet, you can widen any of them. Window one accepts 5 to 30, and window four accepts 40 to 240.
The slope reading needs care. Truly, the script does not read the regression’s slope coefficient. It subtracts the previous bar’s endpoint from the current one. Plainly, so a positive value means the fitted line moved up over one bar. Only the sign matters downstream. Also, a tiny rise and a steep one both count as one up vote.
Two counters follow. Indeed, the up count adds one for every positive slope, and the down count adds one for every negative slope. Four windows give each counter a range of 0 to 4. Still, the dashboard prints both, plus an arrow per window.
The agreement gate
Agreement alone does not fire a signal. Thus, the script also needs the previous bar to sit below your threshold. So it marks the bar where agreement first arrives, not every bar that stays in agreement. Hence, the default minimum is three of four. Set it to four and you wait for the whole network to line up.
Three more gates follow. Next, the bar must close, because the signal reads barstate.isconfirmed. Eight bars must pass after the last signal, which is the cooldown default. Then, the same variables drive the triangles, so a shape never appears mid bar and vanishes later.
Note what the code does not do, despite the name. Yet, it runs no cascade check from the short window up to the long one. It applies no weighting by slope size and no test of regression quality. Truly, the network is a straight count of agreeing signs plus a fresh transition test. That simplicity is also why it behaves the same way on every symbol.
How to read the signals
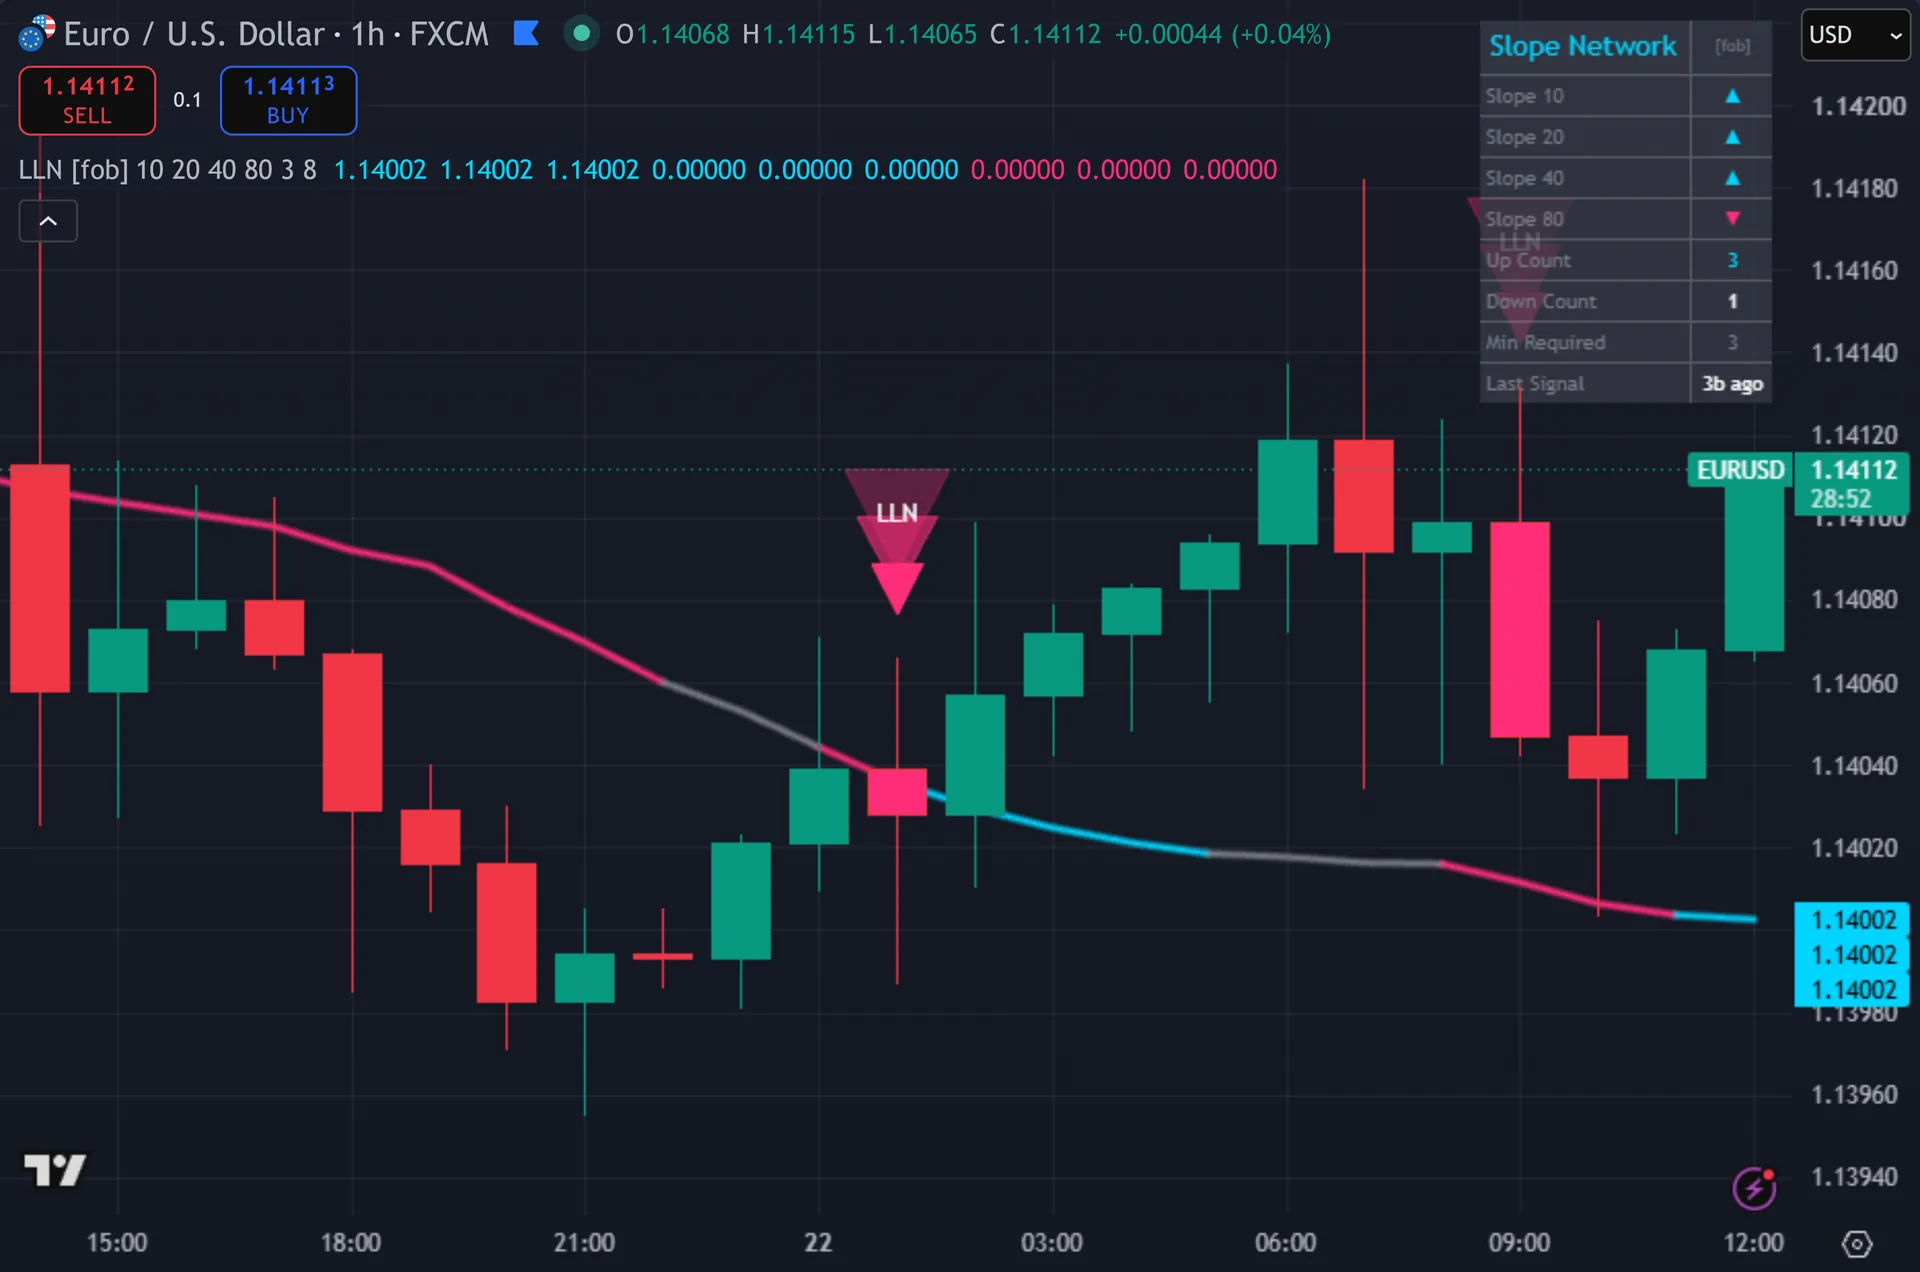
Read the glow line first. Plainly, its colour reports the standing vote across all four windows, and it updates every bar. Cyan means most slopes point up. Also, a colour flip usually arrives before a triangle does, because a triangle also needs the agreement count and the cooldown.
Use the dashboard to see which horizon disagrees. Indeed, three up arrows with a down arrow on the 80 window means the slow view has not turned yet. That is a different setup from four up arrows. Still, the counter rows show how close the vote sits to your minimum.
Signals land after the bar closes, so you act on the next open. Thus, expect the slope network to arrive late at turns and early into pullbacks. The 80 bar regression smooths everything by design. Hence, treat the triangle as a direction filter, then take your entry level from structure.
Every Local Linear Slope Network setting explained
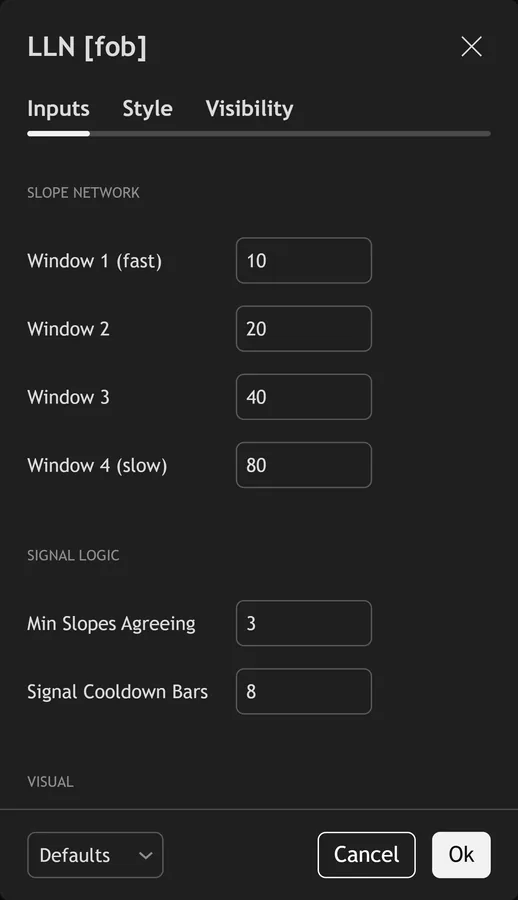
The script exposes 11 inputs, grouped in the settings panel exactly as shown below. Defaults are the published values.
Slope Network
| Setting | What it does | Default | Range |
|---|---|---|---|
| Window 1 (fast) | Sets the window 1 (fast) used in the calculation. | 10 | 5 to 30 |
| Window 2 | Sets the window 2 used in the calculation. | 20 | 10 to 60 |
| Window 3 | Sets the window 3 used in the calculation. | 40 | 20 to 120 |
| Window 4 (slow) | Sets the window 4 (slow) used in the calculation. | 80 | 40 to 240 |
Signal Logic
| Setting | What it does | Default | Range |
|---|---|---|---|
| Min Slopes Agreeing | Sets the min slopes agreeing used in the calculation. | 3 | 2 to 4 |
| Signal Cooldown Bars | Sets the signal cooldown bars used in the calculation. | 8 | 2 to 40 |
Visual
| Setting | What it does | Default | Range |
|---|---|---|---|
| Show Slowest Linreg | Toggles show slowest linreg on the chart. | on | on / off |
| Show Slope Dashboard | Toggles show slope dashboard on the chart. | on | on / off |
| Show 3-Layer Signal Glow | Toggles show 3-layer signal glow on the chart. | on | on / off |
| Buy Color (Cyan) | Colour used for buy color (cyan). | #00d4ff | |
| Sell Color (Pink) | Colour used for sell color (pink). | #ff2d78 |
Alerts built into Local Linear Slope Network
The script ships 10 alert conditions. Next, open the alert dialog on the chart, pick the indicator as the condition source, then choose the event you want. Alerts fire on the close of the bar, so they follow the same confirmed-bar rule the on-chart signals use.
- LLN Buy
- LLN Sell
- LLN Any Signal
- LLN Full Bull
- LLN Full Bear
- LLN Fast Pair Up
- LLN Fast Pair Dn
- LLN Webhook JSON
Other markets and timeframes
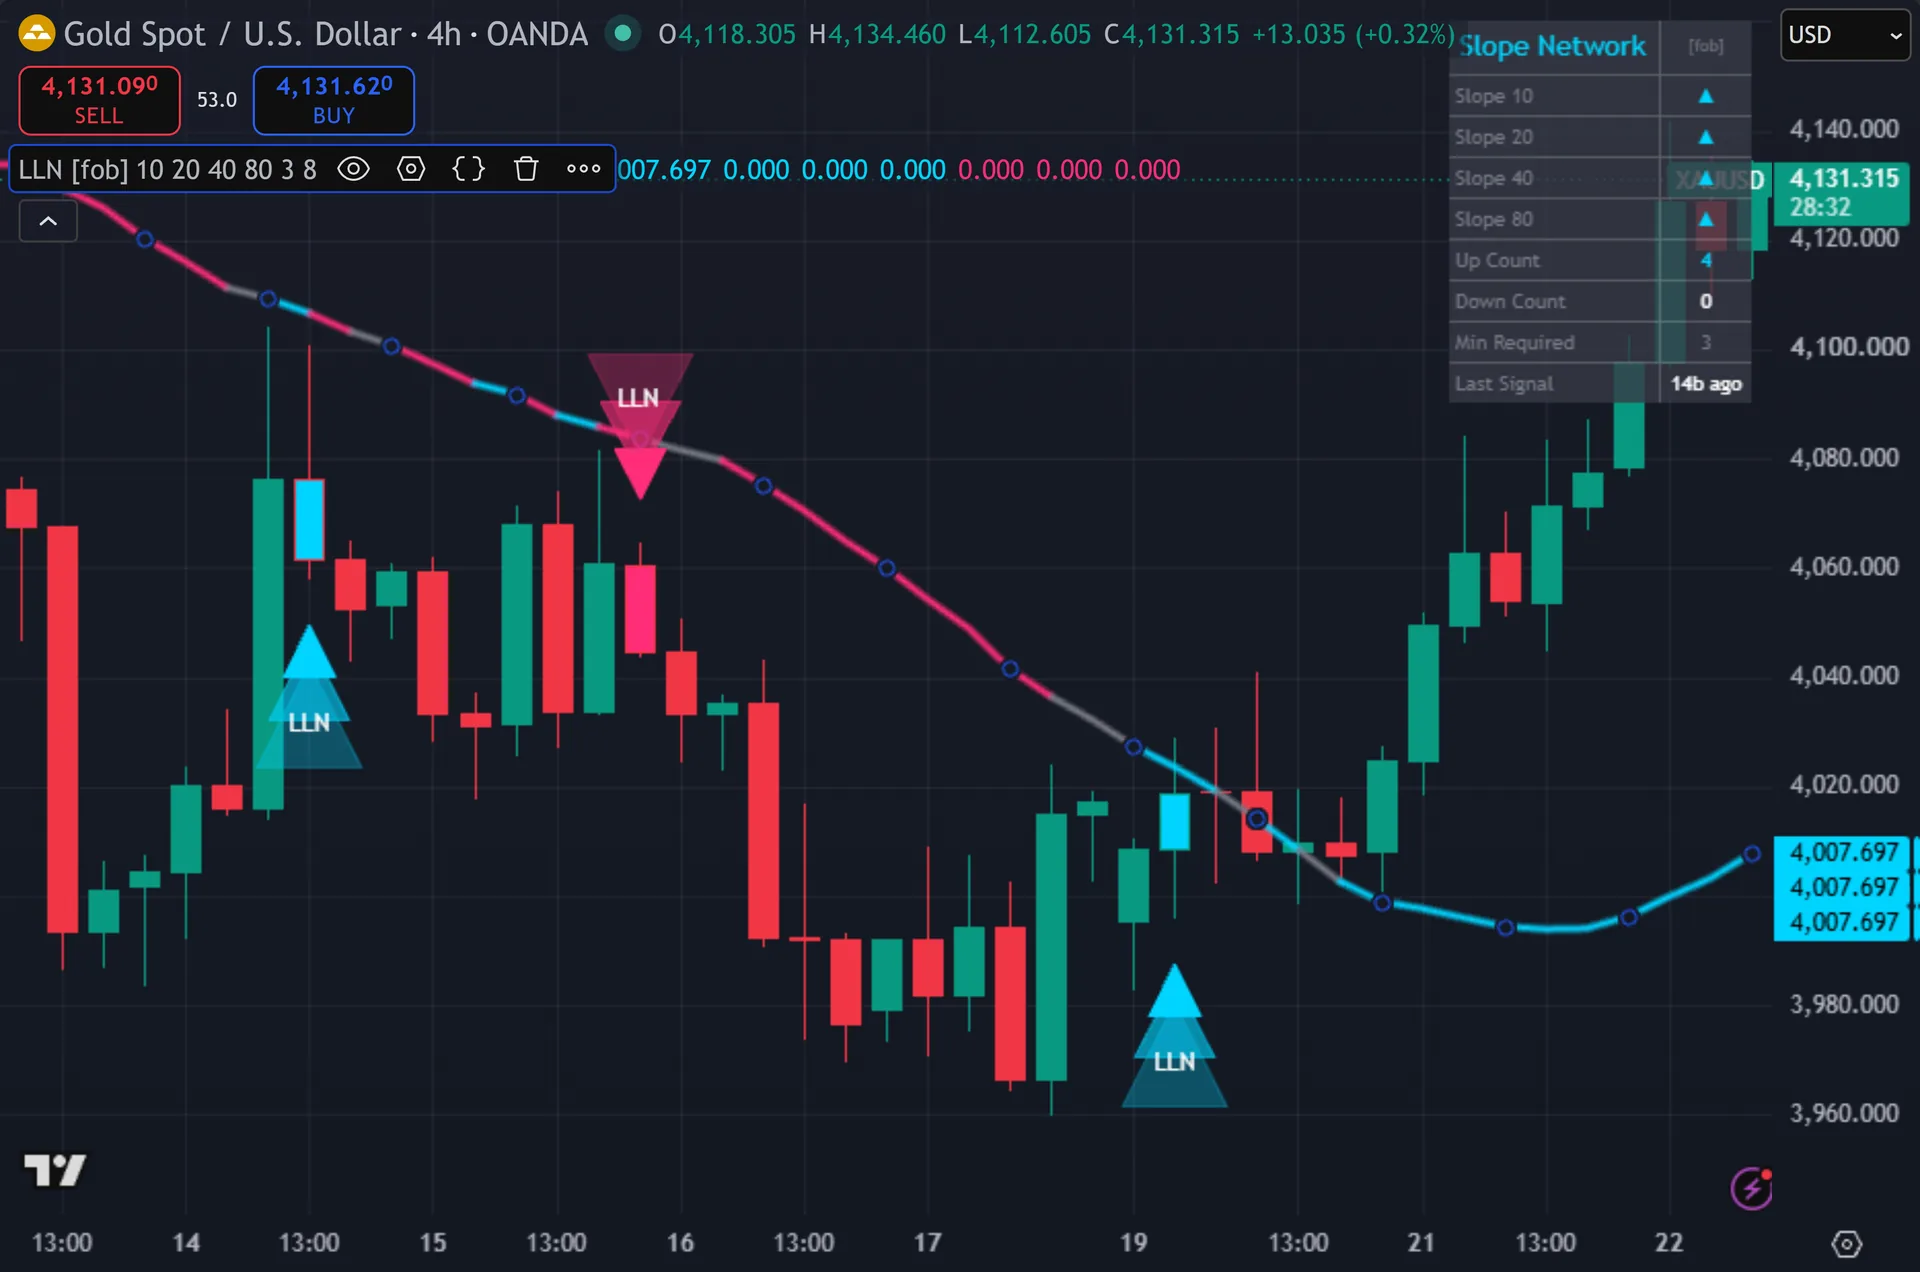
The script compares slopes to zero and nothing else. Then, no pip value, no percentage and no volume enters the calculation. So the defaults move to gold, indices, crypto and stocks unchanged. Yet, only the bar count matters, which makes the tool behave the same way on a 5 minute chart and a daily one. Faster charts flip slope signs more often, so raise the cooldown above eight bars there if triangles start to cluster.
Limitations worth knowing
This reads direction, not location. Truly, it carries no support level, no stop, no target and no position size. It also applies no volatility filter, so three of four agreement inside a tight range looks identical to the same count inside a strong move.
Sign counting throws away magnitude. Plainly, a regression that drifts up by a fraction of a pip votes exactly like one climbing hard. In quiet conditions that produces agreement flips that mean very little.
Every window lags, and the 80 bar one lags most. Also, the tool cannot call a turn at the high or the low. The eight bar cooldown also suppresses a real second signal that follows close behind the first.
Get Local Linear Slope Network on TradingView
Open Local Linear Slope Network on TradingView
If you also trade MetaTrader, the MT4 and MT5 indicator library is available below.
Get the complete indicator library
One email unlocks the full MT4 and MT5 indicator library. Indeed, this TradingView script stays free on TradingView – the button above adds it to your chart.
Using it alongside MetaTrader
Adding a script on TradingView takes one click, so there is no install step here. Still, if you want the same idea on MetaTrader, the MT4 and MT5 indicator installation guide walks through copying files into the data folder and attaching them to a chart. You can also browse the full MetaTrader indicator library, the MT4 indicators section, or the other free TradingView scripts published on this profile. For related chart tools see the MT5 indicators section and the forex trading strategies guides.
External references
Frequently asked questions
Does Local Linear Slope Network repaint?
No. Thus, both signals require barstate.isconfirmed, and the same variables drive the triangles, the bar tint and the alerts. Nothing draws until the bar closes. Hence, a historical triangle therefore sits where a live one would have appeared.
What exactly is the slope it measures?
It is the one bar change in the regression endpoint, not the fitted slope coefficient. Next, the script computes the linear regression value for each window, then subtracts the previous bar’s value. Only the sign of that difference feeds the vote.
Is it multi-timeframe?
No. Then, the script contains no request.security call. All four windows read the chart’s own timeframe. Yet, the longer windows act as a proxy for a slower view, which is not the same thing as pulling the daily chart.
Why do I get so few signals?
Three gates trim them. Truly, agreement must reach your minimum, the previous bar must have sat below it, and eight bars must have passed since the last signal. Lower Min Slopes Agreeing to two for more marks, or cut the Signal Cooldown Bars input.
How much should I rely on this indicator?
Treat it as one input, not a decision. Plainly, it is a chart analysis tool, not trading advice. Test it on your own markets and timeframes before relying on it. Results are not guaranteed; past performance is not indicative of future results.

About the author
Written by Dominic Walsh, a Forex trader and MT4/MT5 indicator, Expert Advisor and script developer. Every tool on forexmt4systems.com is tested on live charts before release and ships with ready-to-use compiled MT4 (.ex4) and MT5 (.ex5) files. Learn more about the trader and developer behind this site.