
Statistical Edge Finder answers a question most traders guess at. Which of these classic setups has actually behaved well on this chart? It works as a pattern backtesting indicator TradingView users can run in a lower pane. Also, the script detects six pattern families in both directions, measures what happened ten bars after each one, then grades all twelve from A to F in a live table.
It is free and open source. Indeed, you can add it to any chart from the Statistical Edge Finder script page on TradingView, and the full Pine source is published there for you to read.
What Statistical Edge Finder plots in a separate pane below price
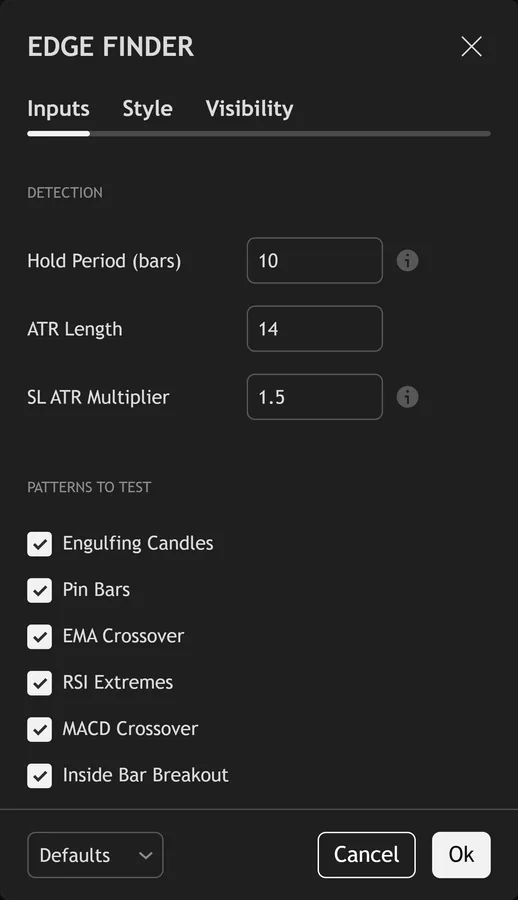
The main output is the table, not the plot. Still, an eighteen-row dashboard lists twelve pattern rows – engulfing, pin bar, EMA cross, RSI extreme, MACD cross and inside bar, each split bullish and bearish. Every row carries the sample count, Win %, average R, an expectancy figure and a letter grade. Thus, best and worst rows get highlighted, and an OVERALL line sums the lot. The pane itself plots one histogram: engulfing expectancy. Hence, five other expectancy series exist but route to the Data Window. BUY and SELL labels also print on the price chart.
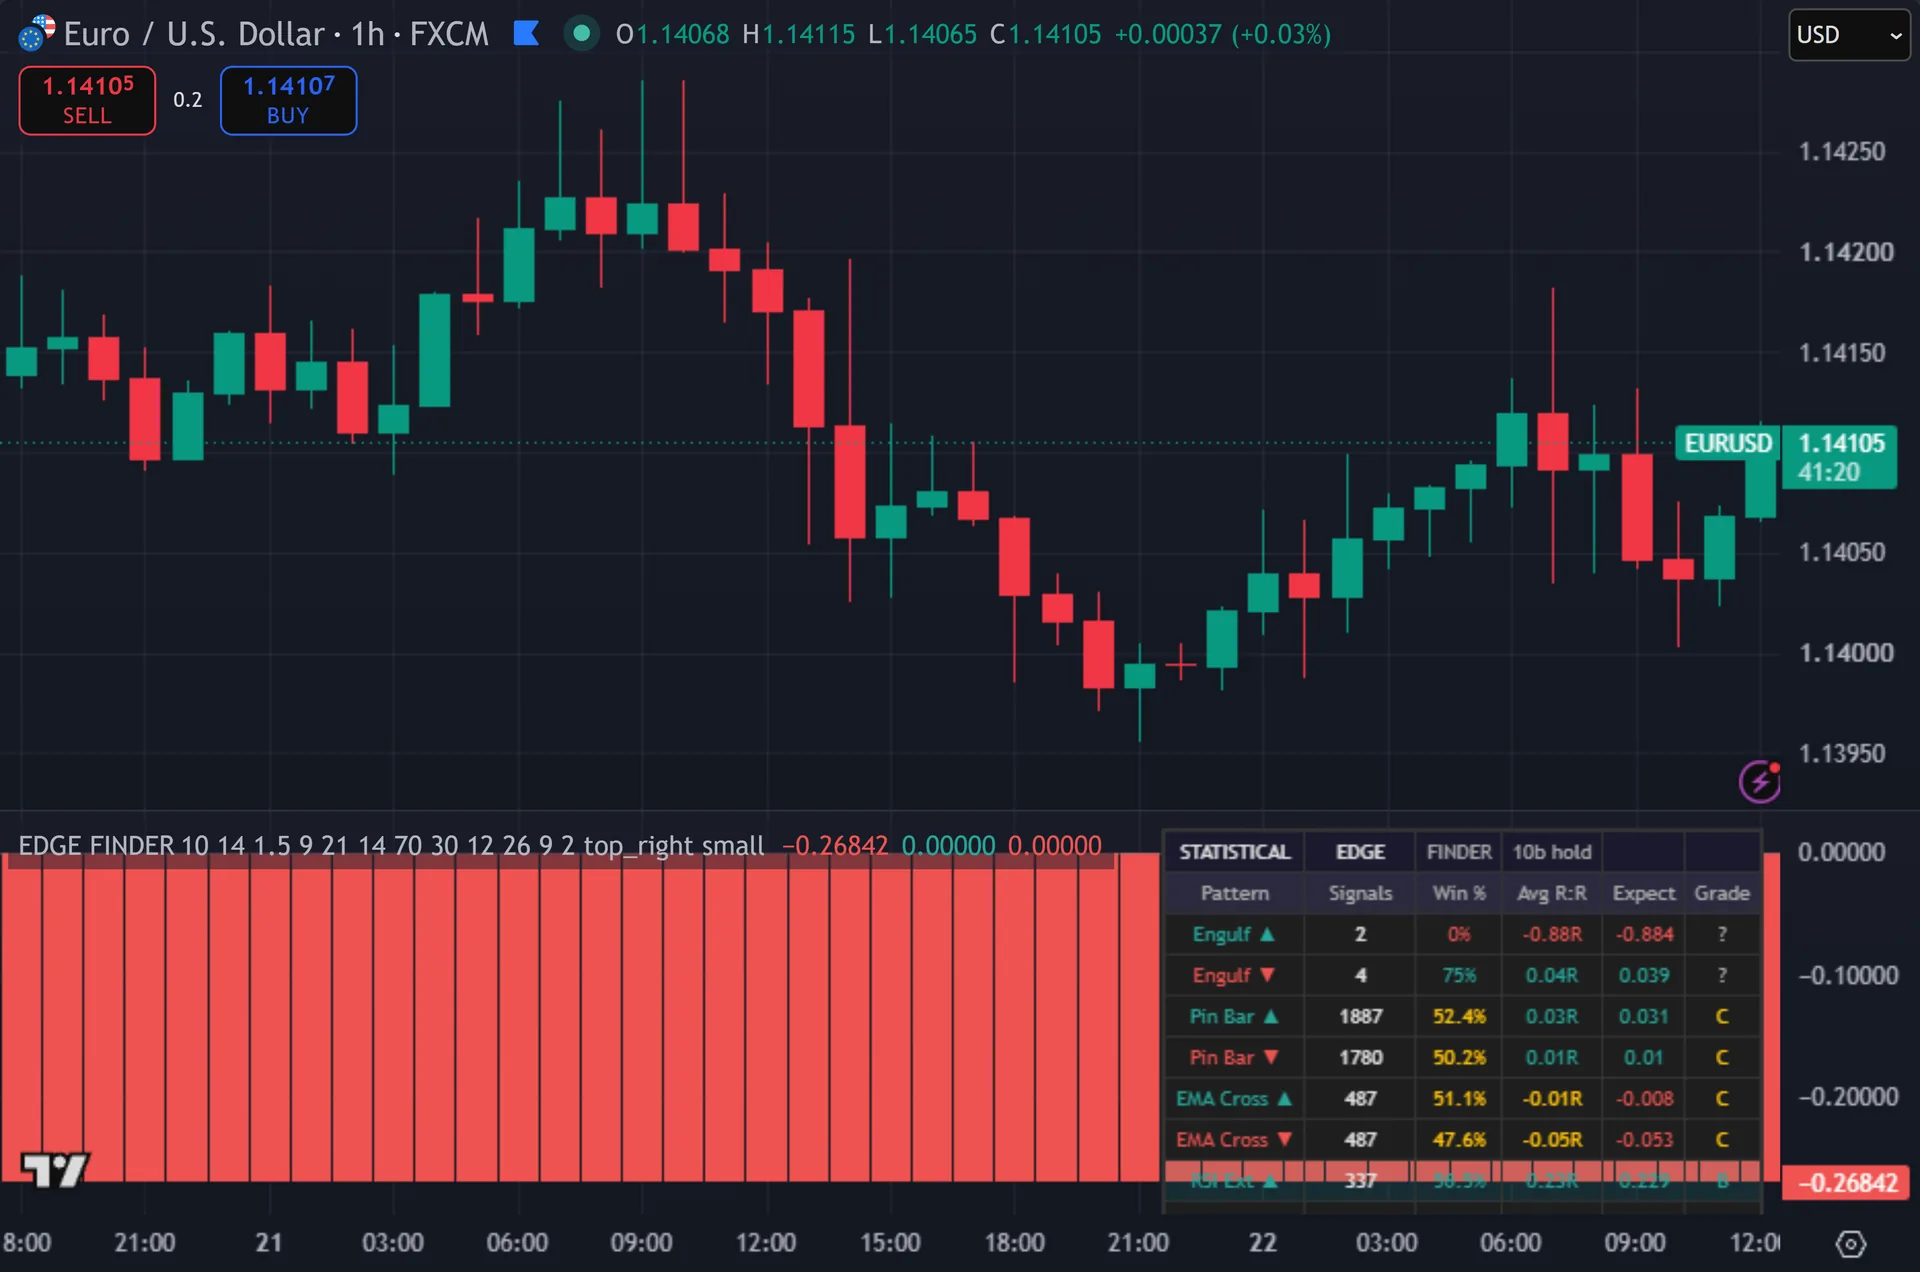
How Statistical Edge Finder is built
Six patterns, twelve tests
The detection block stays deliberately plain. Next, engulfing needs the current body to swallow the previous one, with the open and close straddling it. A pin bar needs a wick past 60 percent of the bar range and a body under 30 percent. Then, EMA cross uses 9 against 21. RSI extreme fires when RSI(14) crosses back through 30 or 70. Yet, MACD uses the standard 12, 26, 9 line against signal. Inside bar breakout needs the prior bar contained inside the one before it, then a close beyond that inner bar.
Each of the six splits into a bullish and a bearish version, which gives twelve tracked patterns. Truly, you can switch families off one at a time. Every detection is a plain boolean on the current bar. Plainly, there is no scoring, no ranking and no weighting between them.
How the measurement works
When a pattern fires on a confirmed bar, the script pushes a record onto a pending queue: pattern id, entry at that close, an ATR-based distance and the bar number. Also, ten bars later it settles the record. It measures close against entry, divides by 1.5 times ATR(14) to express the result in R, then counts the sample as positive or negative.
Be clear about what that is. Indeed, the ATR distance works as a divisor, not a stop. The script never checks whether price would have hit it first. Still, it never checks a target either. Every sample runs the full ten bars and exits at that close, with no spread and no slippage. Thus, so the table measures drift after a pattern, not the outcome of a trade you could place.
Grading needs five samples. Hence, above 0.3 average R earns an A. Above 0.1 earns a B. Next, between minus 0.1 and 0.1 scores a C, then D, then F below minus 0.3. Fewer than five samples show a question mark instead. Then, the Avg R:R and Expect columns print the same underlying number at different precision.
How to read the signals
Start with the Signals column. Yet, a grade built on six samples means very little. One built on sixty is worth reading. Truly, the script marks anything under five samples with a question mark for exactly this reason, and it only highlights a best or worst row once three samples exist.
Compare the pairs. Plainly, engulfing up graded B while engulfing down grades D tells you something specific about this instrument on this timeframe. The pattern behaved differently by direction here. Also, that asymmetry often carries more information than the headline grade.
Re-check after every reload. Indeed, the table counts from the first bar TradingView loaded, so the numbers shift when you change timeframe, change symbol or simply refresh. Nothing persists between sessions. Still, treat each reading as a snapshot of the loaded history, not a stored study.
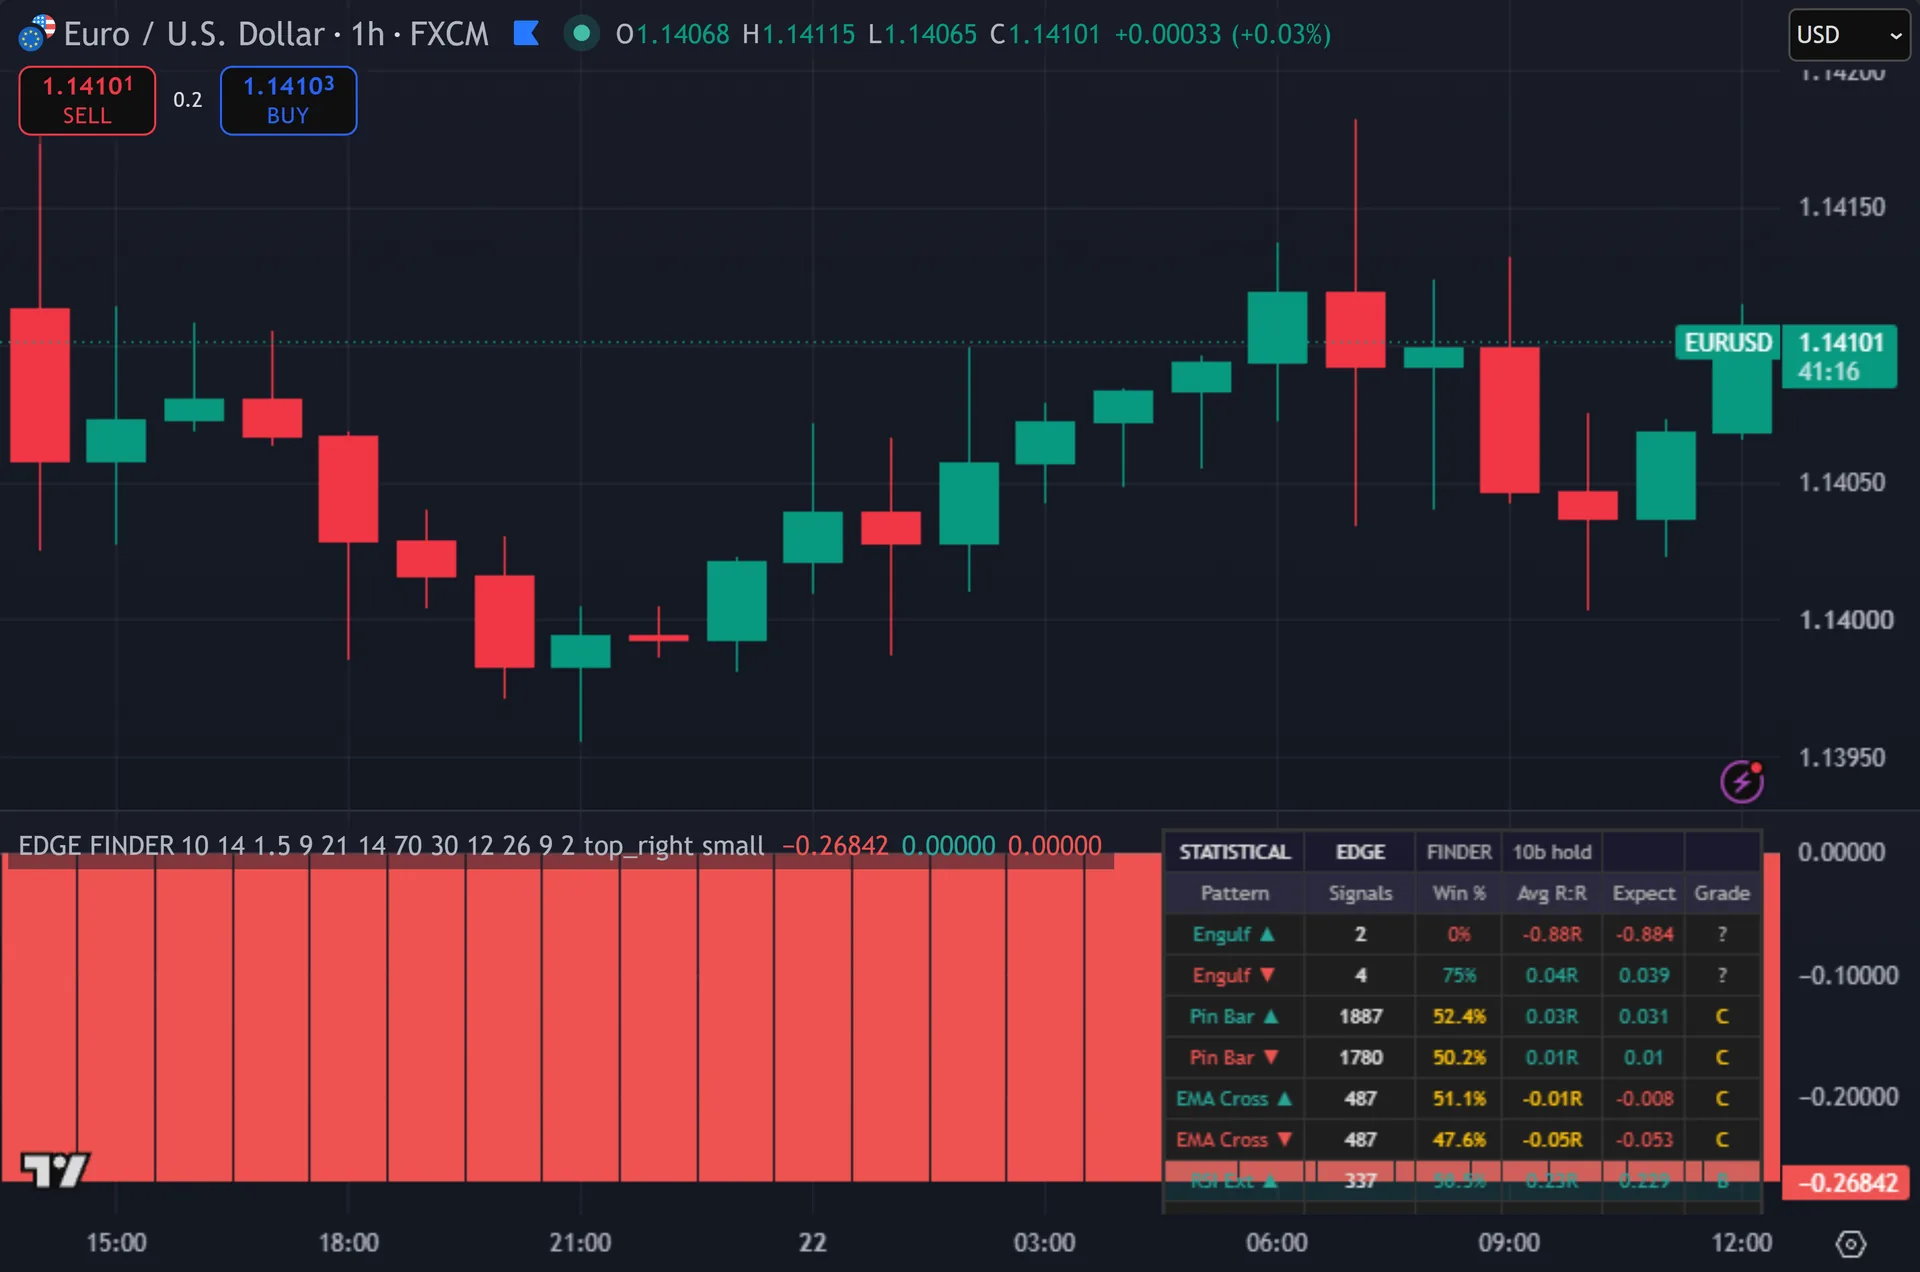
Every Statistical Edge Finder setting explained
The script exposes 26 inputs, grouped in the settings panel exactly as shown below. Defaults are the published values.
Detection
| Setting | What it does | Default | Range |
|---|---|---|---|
| Hold Period (bars) | Bars to hold after signal for P&L measurement | 10 | 3 to 50 |
| ATR Length | Sets the atr length used in the calculation. | 14 | 5 to 50 |
| SL ATR Multiplier | Stop loss distance = ATR × this | 1.5 | 0.5 to 5.0 |
Patterns to Test
| Setting | What it does | Default | Range |
|---|---|---|---|
| Engulfing Candles | Toggles engulfing candles on the chart. | on | on / off |
| Pin Bars | Toggles pin bars on the chart. | on | on / off |
| EMA Crossover | Toggles ema crossover on the chart. | on | on / off |
| RSI Extremes | Toggles rsi extremes on the chart. | on | on / off |
| MACD Crossover | Toggles macd crossover on the chart. | on | on / off |
| Inside Bar Breakout | Toggles inside bar breakout on the chart. | on | on / off |
Pattern Parameters
| Setting | What it does | Default | Range |
|---|---|---|---|
| EMA Fast | Sets the ema fast used in the calculation. | 9 | 2 to 50 |
| EMA Slow | Sets the ema slow used in the calculation. | 21 | 5 to 200 |
| RSI Length | Sets the rsi length used in the calculation. | 14 | 2 to 50 |
| RSI Overbought | Sets the rsi overbought used in the calculation. | 70 | 60 to 90 |
| RSI Oversold | Sets the rsi oversold used in the calculation. | 30 | 10 to 40 |
| MACD Fast | Sets the macd fast used in the calculation. | 12 | 2 to 50 |
| MACD Slow | Sets the macd slow used in the calculation. | 26 | 5 to 100 |
| MACD Signal | Sets the macd signal used in the calculation. | 9 | 2 to 50 |
Signal Filter
| Setting | What it does | Default | Range |
|---|---|---|---|
| Min Patterns for Signal | How many patterns must agree on the same bar to trigger a BUY/SELL signal | 2 | 1 to 6 |
Display
| Setting | What it does | Default | Range |
|---|---|---|---|
| Show Dashboard | Toggles show dashboard on the chart. | on | on / off |
| Show Buy/Sell Signals | Toggles show buy/sell signals on the chart. | on | on / off |
| Show Best/Worst Labels | Toggles show best/worst labels on the chart. | on | on / off |
| Dashboard Position | Choose the dashboard position from the listed options. | top_right | top_left, top_center, top_right, bottom_left, bottom_center, bottom_right |
| Text Size | Choose the text size from the listed options. | small | tiny, small, normal |
Colors
| Setting | What it does | Default | Range |
|---|---|---|---|
| Bullish / Positive | Colour used for bullish / positive. | #26A69A | |
| Bearish / Negative | Colour used for bearish / negative. | #EF5350 | |
| Neutral | Colour used for neutral. | #FFC107 |
Alerts built into Statistical Edge Finder
The script ships 5 alert conditions. Thus, open the alert dialog on the chart, pick the indicator as the condition source, then choose the event you want. Alerts fire on the close of the bar, so they follow the same confirmed-bar rule the on-chart signals use.
- BUY Signal
- SELL Signal
- Any Signal
- Engulfing Pattern
- EMA Crossover
Other markets and timeframes
Every test is relative. Hence, wick and body checks use percentages of the bar range, the RSI levels are standard, and results normalise by ATR. So the same defaults run on gold, indices, crypto and equities without a change. Next, that is rather the point, since the tool exists to compare identical patterns across instruments. One caveat: a ten-bar hold means very different things on a 1-minute chart and a weekly one, so set it to match the horizon you trade.
Limitations worth knowing
The measurement is not a backtest in the strategy sense. Then, no stop gets hit, no target gets taken, and every sample exits at a fixed ten-bar close. Spread, commission and slippage are all absent. Yet, a pattern graded A describes average drift over ten bars, nothing more.
Sample sizes stay small. On a loaded history of a few thousand bars, an EMA cross may fire fifty times and an inside bar breakout far less. Grades built on those counts move a lot from one instrument to the next. Truly, the script also computes a profit factor internally that it never displays, and the pane histogram plots only the engulfing series – the other five sit in the Data Window.
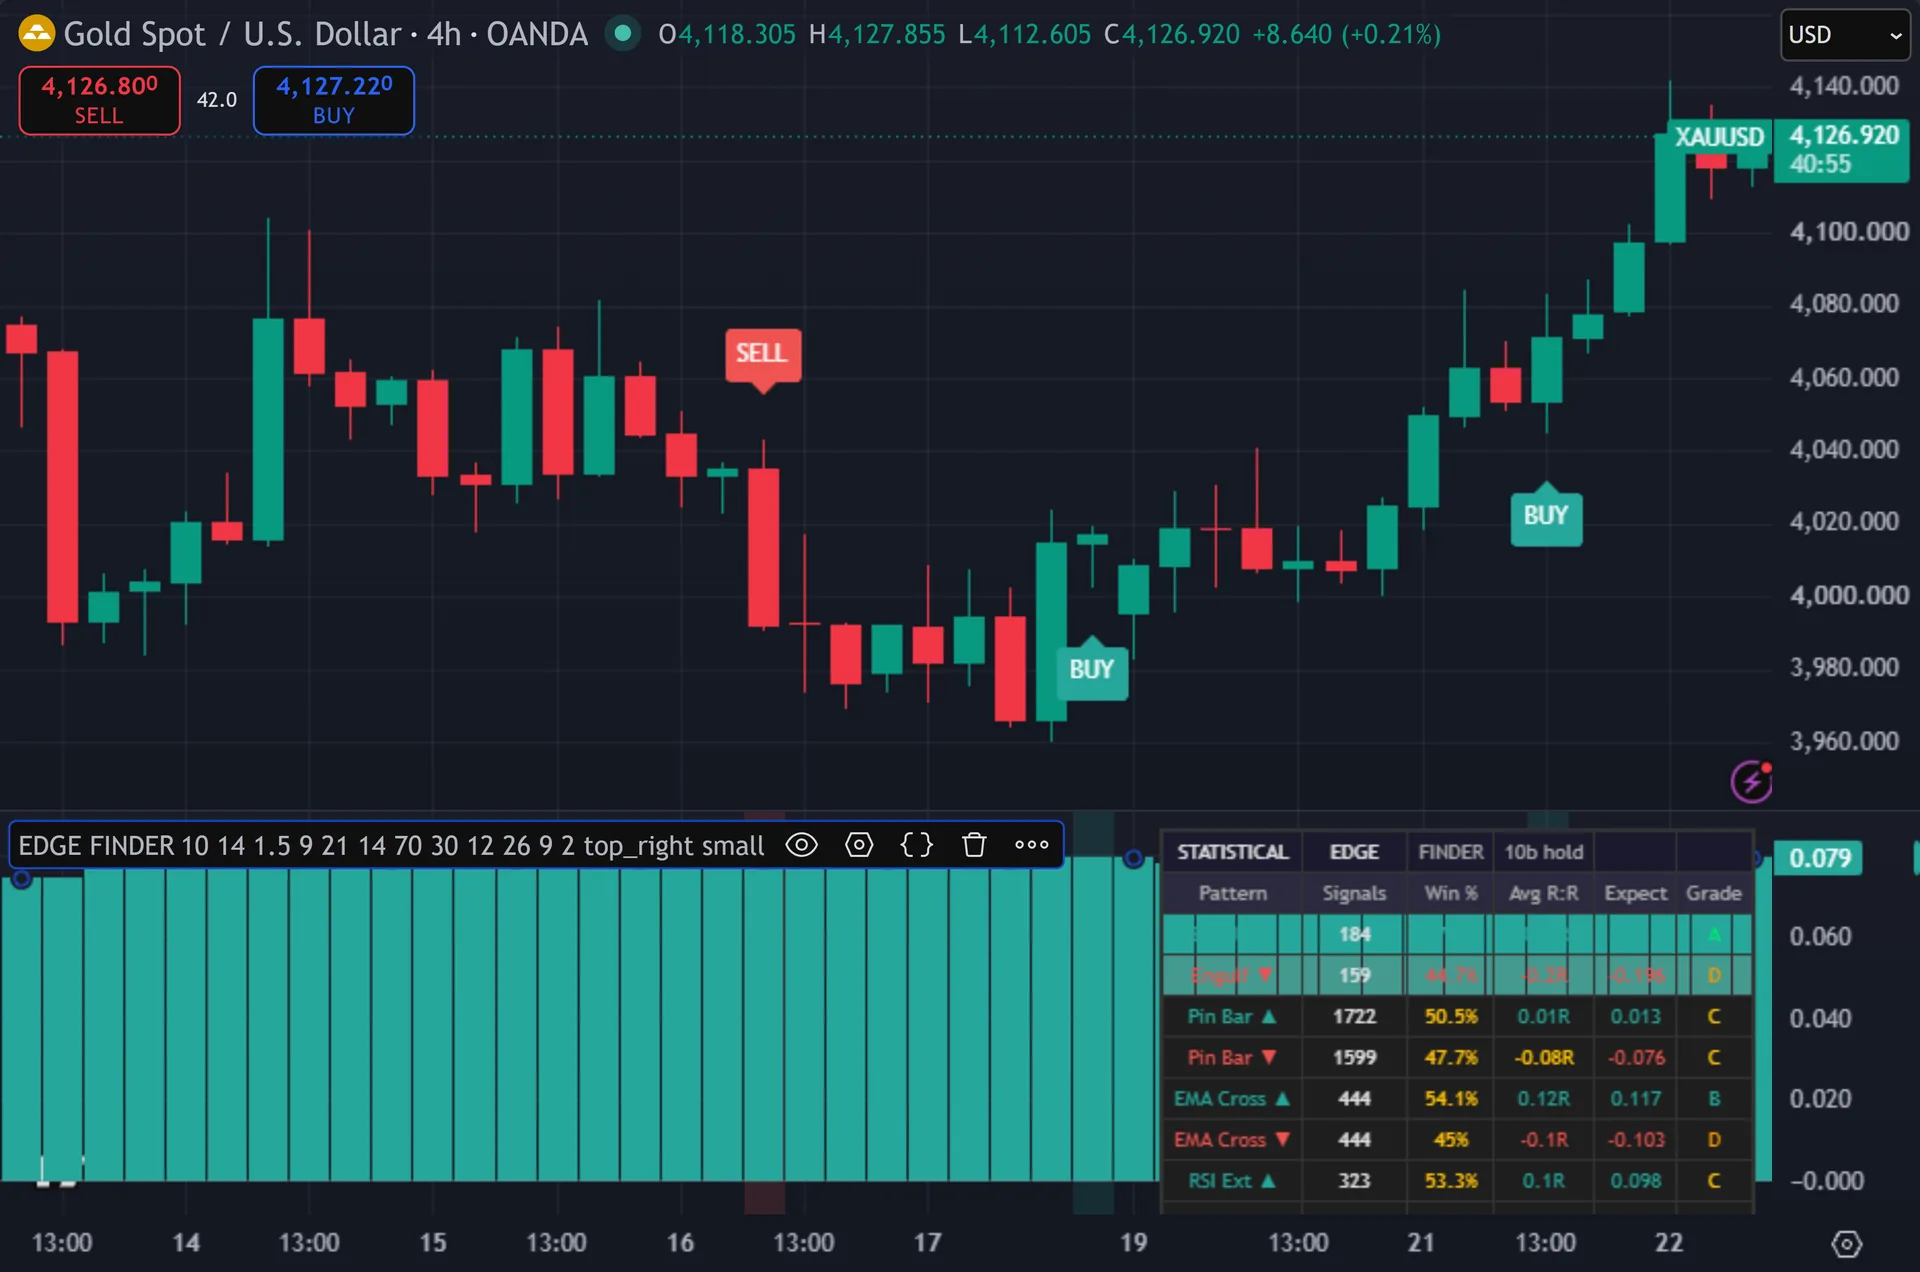
The BUY and SELL labels behave differently from the statistics. Plainly, the stats block waits for a confirmed bar. The labels do not. Also, they fire the moment enough patterns agree, so they can appear and vanish while the candle still moves. Wait for the close before acting on one.
Get Statistical Edge Finder on TradingView
Open Statistical Edge Finder on TradingView
If you also trade MetaTrader, the MT4 and MT5 indicator library is available below.
Get the complete indicator library
One email unlocks the full MT4 and MT5 indicator library. Indeed, this TradingView script stays free on TradingView – the button above adds it to your chart.
Using it alongside MetaTrader
Adding a script on TradingView takes one click, so there is no install step here. Still, if you want the same idea on MetaTrader, the MT4 and MT5 indicator installation guide walks through copying files into the data folder and attaching them to a chart. You can also browse the full MetaTrader indicator library, the MT4 indicators section, or the other free TradingView scripts published on this profile. For related chart tools see the MT5 indicators section and the forex trading strategies guides.
External references
- Backtesting on Wikipedia
- Stochastic Oscillator at Investopedia
- Candlestick Bearish Reversal Patterns at StockCharts ChartSchool
Frequently asked questions
Does the Statistical Edge Finder repaint?
Partly, and the distinction matters. Thus, the statistics block sits inside barstate.isconfirmed, so the table only records closed bars. The BUY and SELL labels carry no such gate. Hence, they evaluate live, which means a label can appear mid-candle and vanish before the bar closes. Wait for the close before treating one as a signal.
Is the Win % column a real backtest result?
No. Next, it is the share of samples where price sat above the entry close ten bars later for longs, or below it for shorts. There is no stop, no target, no spread and no commission. Then, it measures short-horizon drift after a pattern. A trade with a real stop would produce different figures.
Why do Avg R:R and Expect show the same number?
Because both read the same variable – total R divided by the sample count. Yet, expect simply prints it to three decimals instead of two. Average R per sample is the useful figure, so read one column and ignore the duplicate.
How many samples do I need before trusting a grade?
More than the script’s own minimum. Truly, it grades at five samples and marks anything under that with a question mark. Five is far too few to separate a pattern from noise. Plainly, look for several dozen at least, and compare the same pattern across two or three instruments before drawing any conclusion.
How much should I rely on this indicator?
Treat it as one input, not a decision. Also, it is a chart analysis tool, not trading advice. Test it on your own markets and timeframes before relying on it. Results are not guaranteed; past performance is not indicative of future results.

About the author
Written by Dominic Walsh, a Forex trader and MT4/MT5 indicator, Expert Advisor and script developer. Every tool on forexmt4systems.com is tested on live charts before release and ships with ready-to-use compiled MT4 (.ex4) and MT5 (.ex5) files. Learn more about the trader and developer behind this site.