
Fixed-length oscillators assume the market keeps one rhythm. Also, this one measures the rhythm first. Detrend Cycle Oscillator is a detrended price oscillator TradingView traders can run in a sub-pane, with an adaptive twist. Indeed, it searches lags 5 to 50 for the strongest autocorrelation, halves the winning lag, then detrends price with a moving average of that length. ATR normalises the result into average-range units.
It is free and open source. Still, you can add it to any chart from the Detrend Cycle Oscillator script page on TradingView, and the full Pine source is published there for you to read.
What Detrend Cycle Oscillator plots in a separate pane below price
The indicator sits in its own pane, not on the candles. Thus, it plots two lines: a light blue raw oscillator and an amber EMA-smoothed version. Three horizontal levels mark zero and your plus and minus threshold, 0.25 by default. Hence, circles print at the pane top and bottom on signals, and force_overlay mirrors the same entries as triangles on the price chart. The pane tints on a signal bar. Next, an eight-row dashboard reports state, dominant cycle in bars, best correlation, both oscillator values, position and bars since the last signal.

How Detrend Cycle Oscillator is built
Finding the dominant cycle
A helper function computes the Pearson correlation between close and close[k] over a 30-bar window. Then, it sums x, y, x squared, y squared and xy by hand. That hand-rolled maths matters. Yet, a manual sum carries no hidden series state, so the script can call it inside a loop where the lag changes on every pass. Built-in ta functions cannot do that safely.
The script then runs that helper for every lag from 5 to 50. Truly, that is 46 correlations on every single bar. It stores each result in an array and takes the argmax. Plainly, the winning lag becomes the dominant cycle estimate, and the dashboard prints it next to the correlation that won.
Be clear about what this is. Also, it is an autocorrelation argmax, not a Fourier or Hilbert transform. Price autocorrelation usually decays as the lag grows, so on strongly trending data the search often settles near the minimum lag of 5. Indeed, read the Best Corr row to judge whether the lock means anything.
Detrending and the signal gates
The script halves the winning lag, floors it at 2, then subtracts a simple moving average of that length from close. Still, the remainder is the detrended series – price minus its own short mean. Dividing by ATR(14) turns it into average-range units. Thus, so a reading of 1.0 means price sits one ATR above that short mean.
A 3-period EMA smooths the oscillator. Hence, the raw line supplies the trigger. The smoothed line supplies the confirmation.
A long needs four things at once. Next, the raw oscillator must cross zero upward. The smoothed line must already read above 0.25. Then, the bar must close, since the signal reads barstate.isconfirmed. And 5 cooldown bars must have passed. Yet, the internal position state also blocks a second long while a long already stands. Shorts mirror all of it with a downward zero cross and a smoothed value under -0.25. Truly, an optional session window narrows the day further.
How to read the signals
Zero is the anchor. Plainly, above it, price trades over its own adaptive short mean. Below it, price trades under. Also, the distance reads in ATR units, so 0.8 means eight tenths of an average bar range, on any instrument.
Watch the Dominant Cycle row change. Indeed, a stable number across many bars means the correlation search keeps landing on the same rhythm. A number that jumps around every bar means the market has no clean cycle, and the detrending length keeps shifting under you.
The threshold makes signals late on purpose. Still, a bare zero cross fires early and often. Requiring the smoothed line to sit past 0.25 in the same direction filters out crosses that die immediately. Thus, you pay for that with a later entry.

Every Detrend Cycle Oscillator setting explained
The script exposes 16 inputs, grouped in the settings panel exactly as shown below. Defaults are the published values.
Cycle Estimation
| Setting | What it does | Default | Range |
|---|---|---|---|
| Min Cycle Lag | Lower bound for the autocorrelation argmax search. | 5 | 2 to 20 |
| Max Cycle Lag | Upper bound for the autocorrelation argmax search. | 50 | 20 to 200 |
| Correlation Window | Window for Pearson correlation at each lag. | 30 | 10 to 200 |
| ATR Length | Sets the atr length used in the calculation. | 14 | 5 to 50 |
| Oscillator EMA | Sets the oscillator ema used in the calculation. | 3 | 2 to 20 |
Signal Logic
| Setting | What it does | Default | Range |
|---|---|---|---|
| Smoothed Threshold | |smoothed osc| must exceed this for a signal. | 0.25 | 0.1 to 3.0 |
| Cooldown Bars | Sets the cooldown bars used in the calculation. | 5 | 1 to 60 |
Filters
| Setting | What it does | Default | Range |
|---|---|---|---|
| Restrict to Session | Toggles restrict to session on the chart. | off | on / off |
| Session Window | Controls session window. | 0000-2400 |
Visual
| Setting | What it does | Default | Range |
|---|---|---|---|
| Show Dashboard | Toggles show dashboard on the chart. | on | on / off |
| Show 3-Layer Glow | Toggles show 3-layer glow on the chart. | on | on / off |
| Buy Color | Colour used for buy color. | #00ffd1 | |
| Sell Color | Colour used for sell color. | #ff3df0 | |
| Oscillator Color | Colour used for oscillator color. | #7df9ff | |
| Smoothed Color | Colour used for smoothed color. | #fbbf24 | |
| Dashboard BG | Colour used for dashboard bg. | color.new(#0a1a14, 16) |
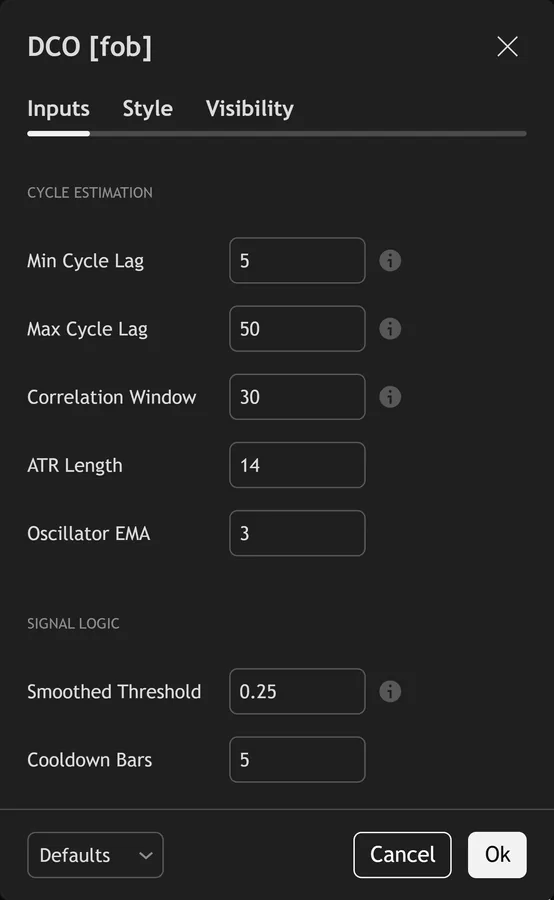
Alerts built into Detrend Cycle Oscillator
The script ships 13 alert conditions. Hence, open the alert dialog on the chart, pick the indicator as the condition source, then choose the event you want. Alerts fire on the close of the bar, so they follow the same confirmed-bar rule the on-chart signals use.
- DCO Buy
- DCO Sell
- DCO Any Signal
- DCO Zero Cross Up
- DCO Zero Cross Dn
- DCO Overbought
- DCO Oversold
- DCO Cycle Shift
- DCO Strong Lock
- DCO Weak Lock
- DCO Webhook JSON
Other markets and timeframes
Every quantity here stays relative. Next, the oscillator divides by ATR, so it reads in average-range units on any instrument. Correlation is scale-free too, and the script touches no volume at all. Then, the same 0.25 threshold therefore transfers to gold, indices, crypto and equities without retuning. The lag bounds are the one thing worth revisiting. Yet, a 5 to 50 search covers minutes on an M1 chart and months on a daily chart, so the meaning of the cycle number changes with the timeframe.

Limitations worth knowing
This measures where price sits against a moving mean. Truly, it does not identify trend, market structure or support. It carries no stop, no target and no sizing logic, and it makes no claim about what happens after a cross.
The cycle estimate is fragile. Plainly, forty-six correlations per bar over a 30-bar window produce a noisy argmax, and the winning lag can flip from 5 to 47 and back. Every flip changes the moving average length and reshapes the oscillator. Also, that loop also costs real compute, so the script loads slower than a fixed-length DPO.
Signals confirm at bar close, so a circle appears at the open of the next candle. Indeed, the two lines themselves still move inside the live bar. The 5-bar cooldown also suppresses a genuine second cross that arrives quickly after the first.
Get Detrend Cycle Oscillator on TradingView
Open Detrend Cycle Oscillator on TradingView
If you also trade MetaTrader, the MT4 and MT5 indicator library is available below.
Get the complete indicator library
One email unlocks the full MT4 and MT5 indicator library. Still, this TradingView script stays free on TradingView – the button above adds it to your chart.
Using it alongside MetaTrader
Adding a script on TradingView takes one click, so there is no install step here. Thus, if you want the same idea on MetaTrader, the MT4 and MT5 indicator installation guide walks through copying files into the data folder and attaching them to a chart. You can also browse the full MetaTrader indicator library, the MT4 indicators section, or the other free TradingView scripts published on this profile. For related chart tools see the MT5 indicators section and the forex trading strategies guides.
External references
- Momentum (finance) on Wikipedia
- Momentum at Investopedia
- Cme Futures And Spot Prices at StockCharts ChartSchool
Frequently asked questions
Does the Detrend Cycle Oscillator repaint?
The signals do not. Hence, both entry flags include barstate.isconfirmed, so circles, mirrored triangles and the tint on a signal bar are final once the candle closes. The two plotted lines update within the forming bar, as any oscillator line does. Next, values on closed historical bars stay as they were computed.
How does this differ from a standard DPO?
A classic detrended price oscillator subtracts a displaced moving average of fixed length. Then, this one picks its own length from an autocorrelation search on every bar, and it applies no displacement. It then divides by ATR, so the output reads in average-range units instead of raw price.
What does the Best Corr row tell me?
It is the Pearson correlation of the winning lag over the 30-bar window. Yet, above 0.5 the data really does repeat at that spacing. Near zero or below, the dominant cycle is just the least bad option in the search and the number deserves little weight. Truly, alert conditions flag both cases at 0.5 and 0.0.
Is it multi-timeframe?
No. Plainly, the script contains no request.security call, so every input comes from the chart timeframe. Open a second chart at a higher resolution if you want the cycle estimate for that timeframe.
How much should I rely on this indicator?
Treat it as one input, not a decision. Also, it is a chart analysis tool, not trading advice. Test it on your own markets and timeframes before relying on it. Results are not guaranteed; past performance is not indicative of future results.

About the author
Written by Dominic Walsh, a Forex trader and MT4/MT5 indicator, Expert Advisor and script developer. Every tool on forexmt4systems.com is tested on live charts before release and ships with ready-to-use compiled MT4 (.ex4) and MT5 (.ex5) files. Learn more about the trader and developer behind this site.
How we build, test and correct every tool: Editorial & Testing Policy. Trading carries risk; see the disclaimer.