
Two trends rarely unfold at the same speed. Also, DTW Template Tracker is a dynamic time warping indicator TradingView traders can use to match the last 15 closes against two ideal shapes: a straight rise and a straight fall. Time warping lets the comparison stretch and compress, so a slow grind and a quick ramp can both score as the same shape. Indeed, the lower distance wins the bar.
It is free and open source. Still, you can add it to any chart from the DTW Template Tracker script page on TradingView, and the full Pine source is published there for you to read.
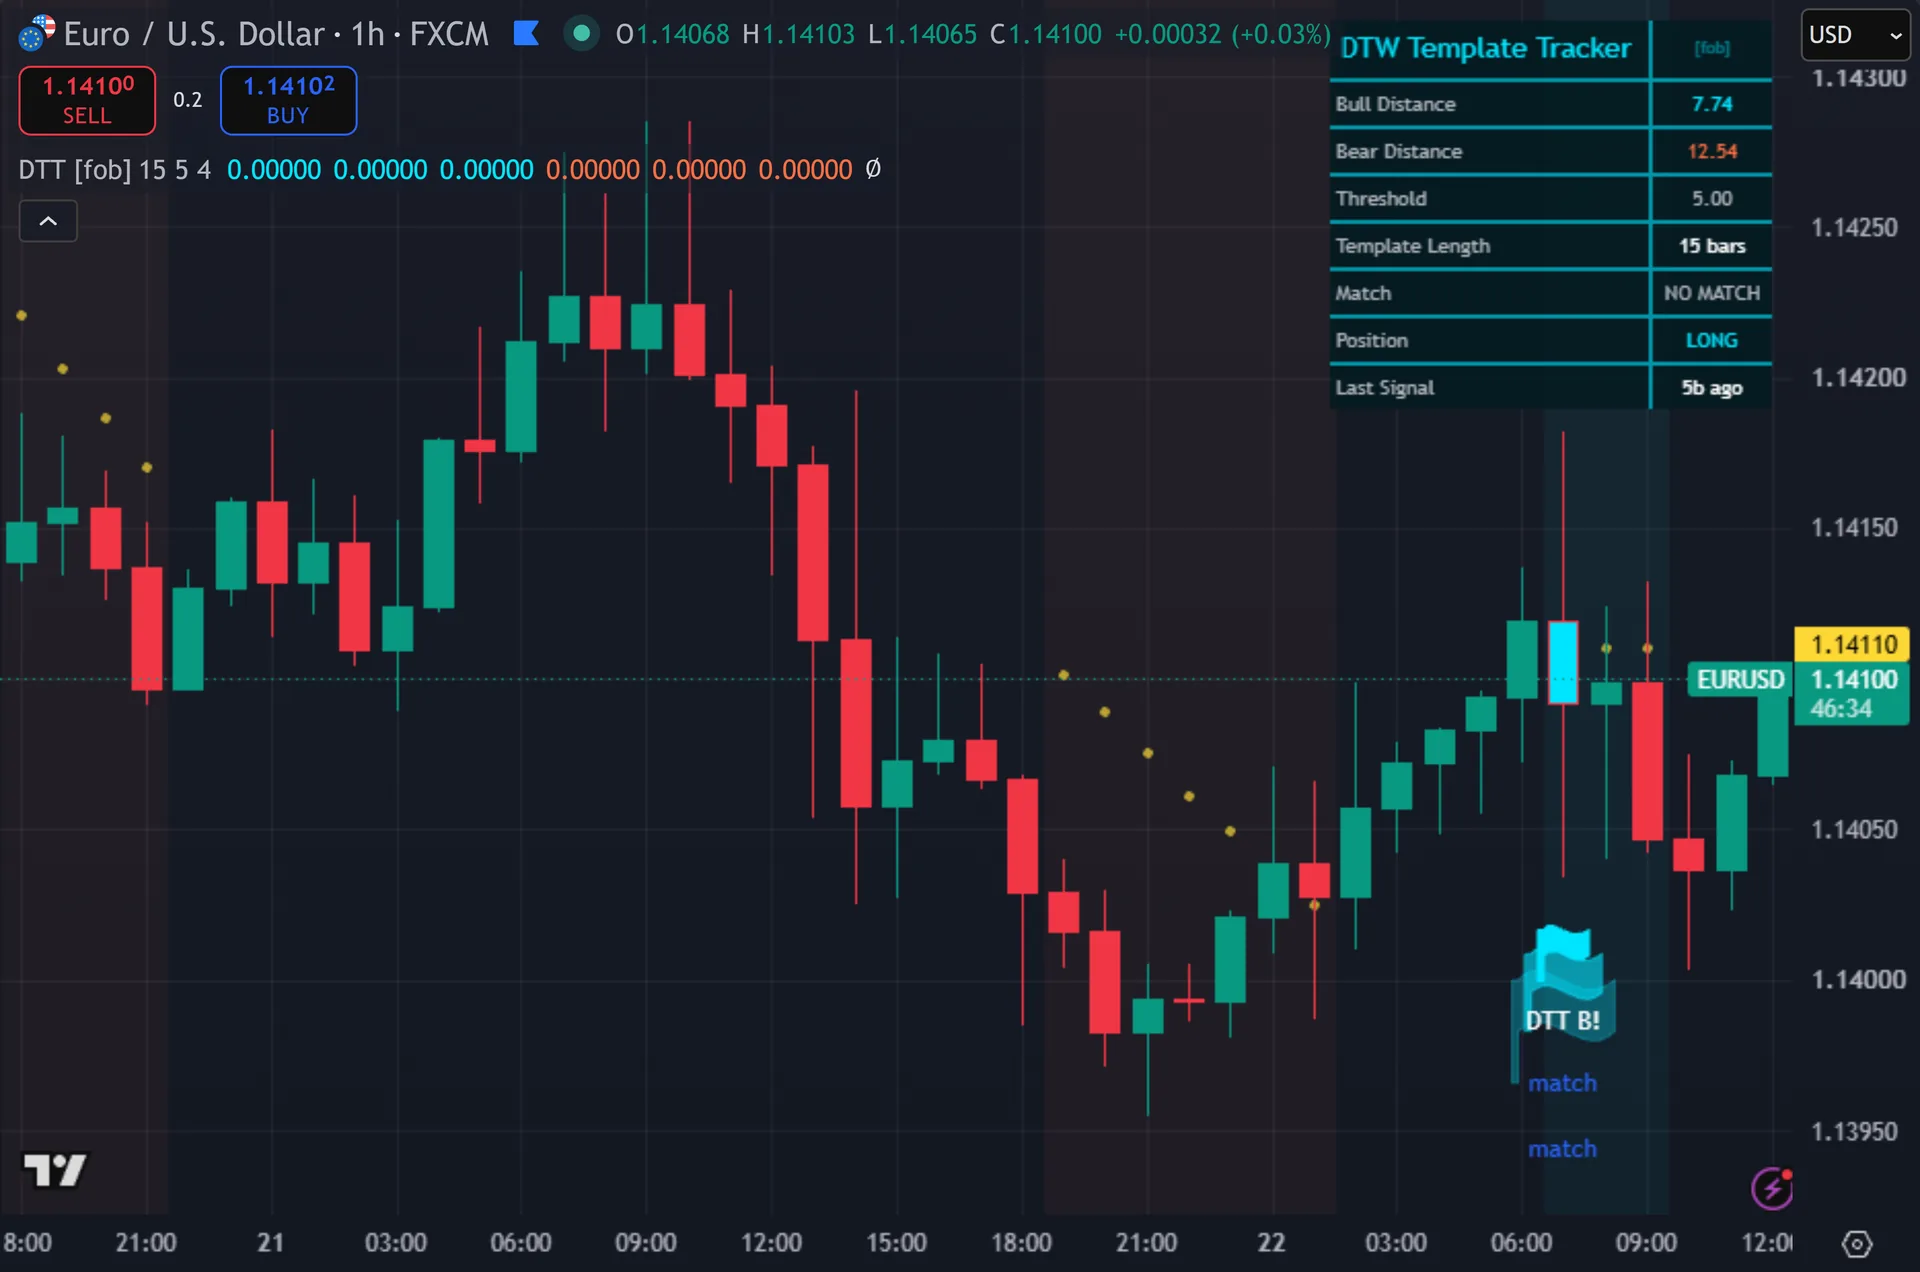
What DTW Template Tracker plots on the price chart
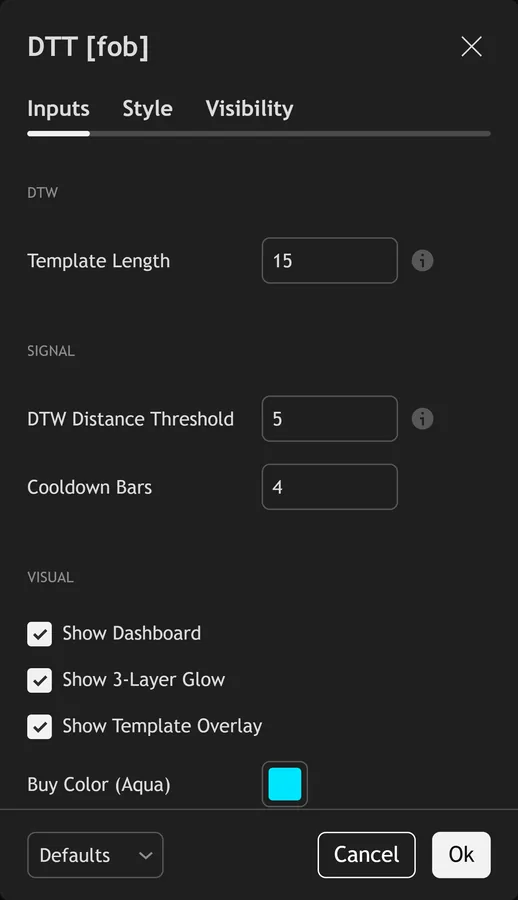
Buy flags print below the bar in aqua and sell flags print above it in salmon. Thus, each signal stacks three flag layers for a glow effect and carries the text DTT B! or DTT S!. The script tints the signal bar and washes the background while either template leads. Hence, yellow circles plot half an ATR above or below the 15-bar average price during a match. An eight-row dashboard shows both DTW distances, the threshold, template length, current match, position state and bars since the last signal.
How DTW Template Tracker is built
Z-scoring and the two templates
The script strips price level and volatility out of the window first. Next, it takes the last 15 closes, subtracts the 15-bar simple moving average and divides by the 15-bar standard deviation. That leaves a pure shape measured in standard deviations. Then, a move from 1.0850 to 1.0900 and a move from 60,000 to 63,000 can now produce identical numbers.
Two templates then act as targets. Yet, the bull template is a straight line from -1 to +1 across the window. The bear template is its mirror, +1 down to -1. Truly, nothing more complex sits behind them. So the tool asks one question: how close does the recent shape run to a clean monotone rise, or a clean monotone fall? Plainly, it holds no library of named chart patterns.
The DTW distance and the signal gates
Dynamic time warping compares two series that may run at different speeds. Also, the script builds a 15 by 15 cost matrix. Each cell holds the absolute difference between one window point and one template point, plus the cheapest of the three neighbours behind it. Indeed, the bottom-right cell holds the total warped distance.
A Sakoe-Chiba band of width 2 keeps the cost tractable. Still, the script fills only cells where the two indexes sit within two positions of each other. That caps the warp, so a match may shift by two bars rather than ten. Thus, everything outside the band stays at a huge sentinel value and never wins a minimum.
Signals need four things. Hence, one template must beat the other outright. Its distance must sit at or under the threshold, which defaults to 5.0 and ranges from 0.5 to 20. Next, the match must be new, so the script fires on the first bar of a match and not on the rest. And the bar must close, since both signals carry barstate.isconfirmed. Then, a four-bar cooldown and a position-state lock then stop repeat flags on the same side.
How to read the signals
Read the two distances, not just the flag. Yet, the dashboard shows bull distance and bear distance side by side. A bull reading of 2.4 against a bear reading of 9.1 marks a decisive shape. Truly, a 4.8 against a 5.2 is close to a coin flip that happened to clear the threshold.
The distance threshold is absolute and it scales with template length. Plainly, the script puts 4 to 10 in the typical band for a 15-bar template. Raise template length to 25 and every distance grows, so raise the threshold too or the tool goes quiet.
Flags need a closed bar, so a signal lands at the open of the next candle. Also, the background tint and the dashboard numbers do not wait. They update while the bar moves. Indeed, watch a tint change mid-candle and you have seen the difference between the display layer and the signal layer.
Every DTW Template Tracker setting explained
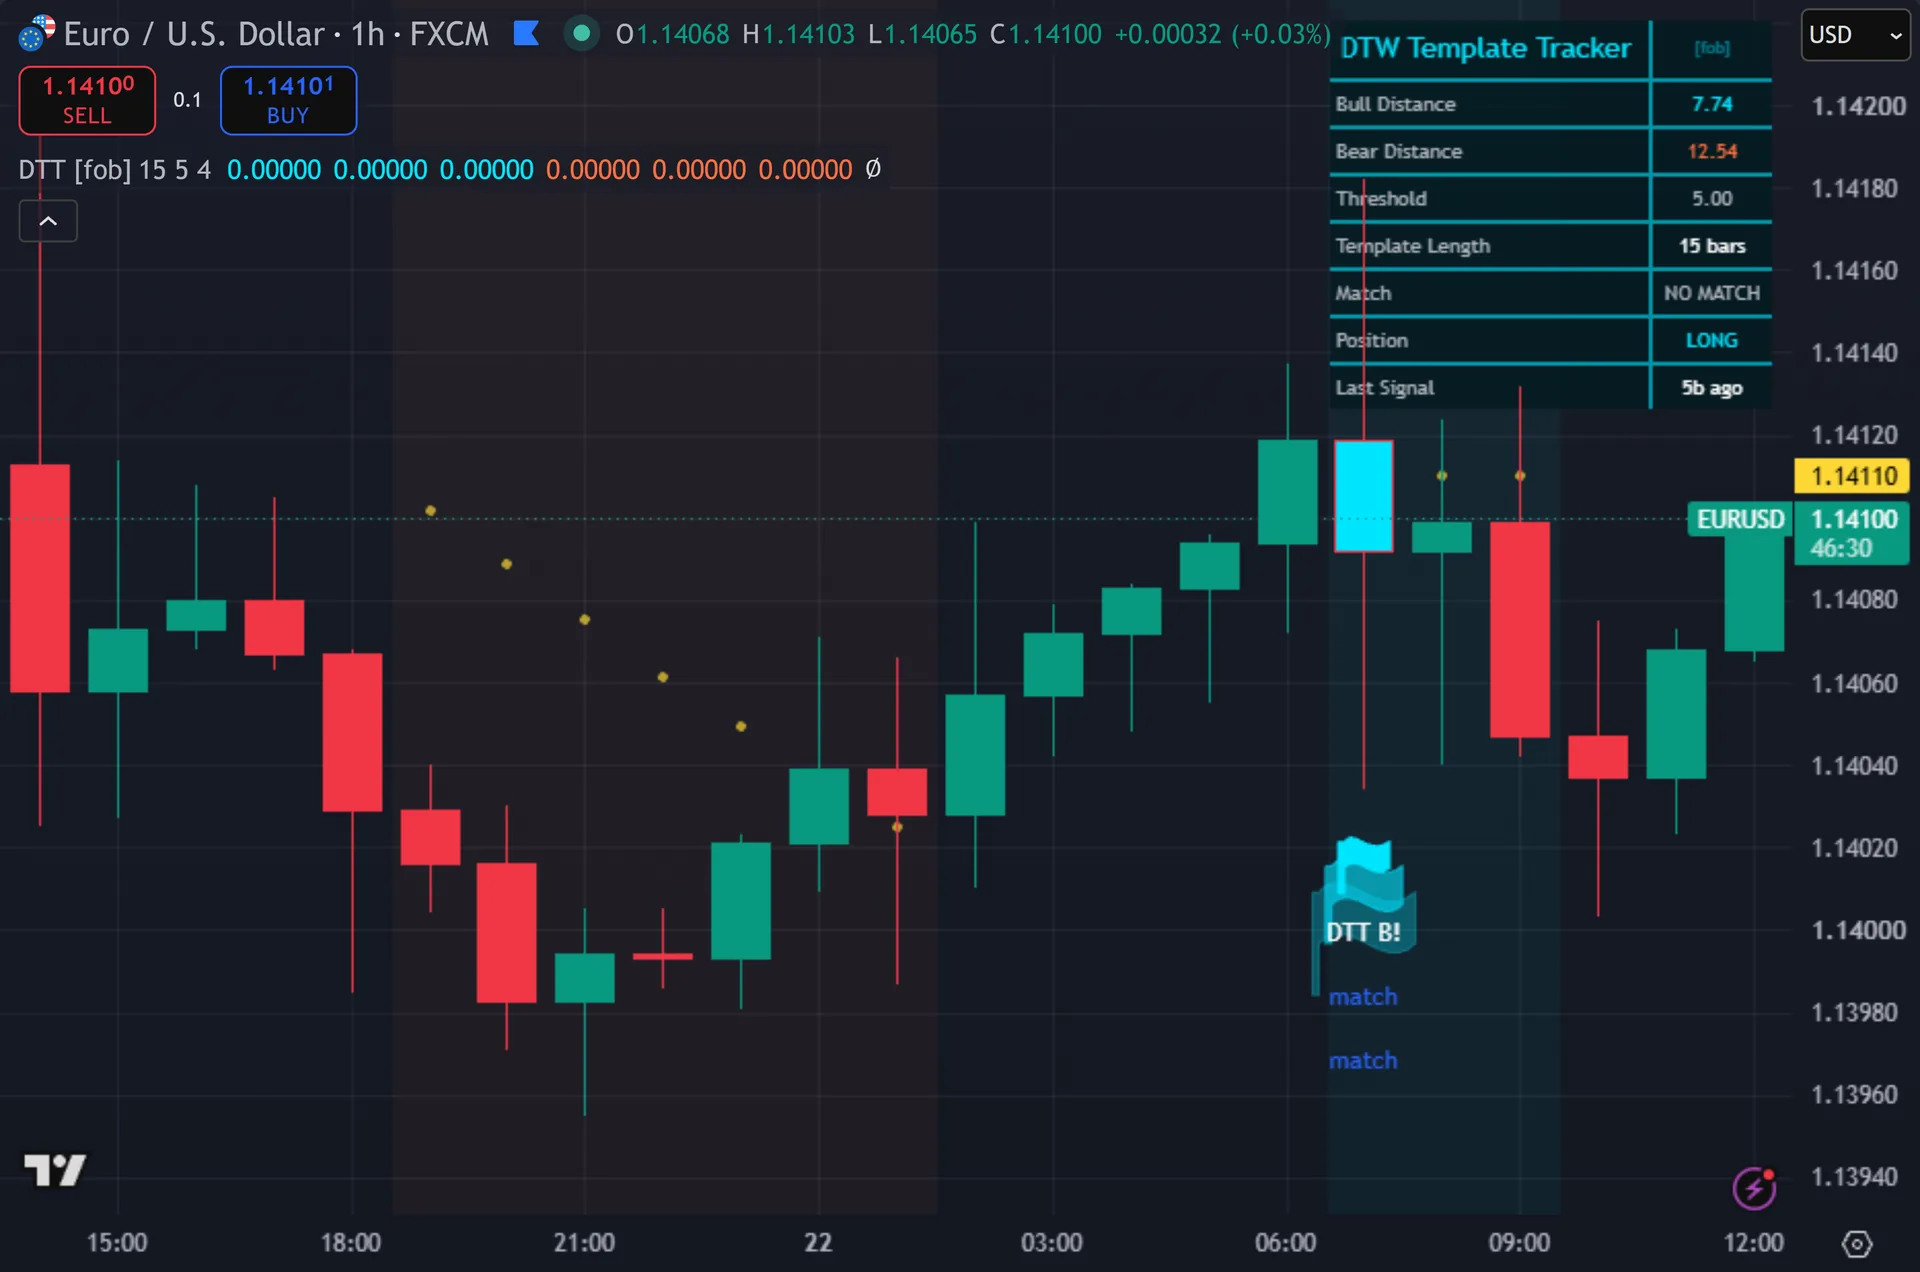
The script exposes 8 inputs, grouped in the settings panel exactly as shown below. Defaults are the published values.
DTW
| Setting | What it does | Default | Range |
|---|---|---|---|
| Template Length | DTW cost grows ~ N^2 (with band). Keep N <= 25 for performance. | 15 | 8 to 30 |
Signal
| Setting | What it does | Default | Range |
|---|---|---|---|
| DTW Distance Threshold | DTW distances scale with template length; ~4-10 is typical for N=15. | 5.0 | 0.5 to 20.0 |
| Cooldown Bars | Sets the cooldown bars used in the calculation. | 4 | 1 to 20 |
Visual
| Setting | What it does | Default | Range |
|---|---|---|---|
| Show Dashboard | Toggles show dashboard on the chart. | on | on / off |
| Show 3-Layer Glow | Toggles show 3-layer glow on the chart. | on | on / off |
| Show Template Overlay | Toggles show template overlay on the chart. | on | on / off |
| Buy Color (Aqua) | Colour used for buy color (aqua). | #00e5ff | |
| Sell Color (Salmon) | Colour used for sell color (salmon). | #ff7043 |
Alerts built into DTW Template Tracker
The script ships 11 alert conditions. Still, open the alert dialog on the chart, pick the indicator as the condition source, then choose the event you want. Alerts fire on the close of the bar, so they follow the same confirmed-bar rule the on-chart signals use.
- DTT Buy
- DTT Sell
- DTT Any Signal
- DTT Bull Match
- DTT Bear Match
- DTT Bull Tight
- DTT Bear Tight
- DTT Strong
- DTT Webhook JSON
Other markets and timeframes
Z-scoring makes the shape comparison market-agnostic. Thus, the window loses its price level and its volatility before the distance runs, so gold, indices, crypto and equities feed the same numbers as a currency pair. The threshold is absolute, but it applies to z-scored data, so 5.0 means the same thing everywhere. Hence, only template length changes that scale. Keep the default 15 and the threshold transfers across symbols with no retuning. Next, the script also reads close alone, so a missing volume feed changes nothing.
Limitations worth knowing
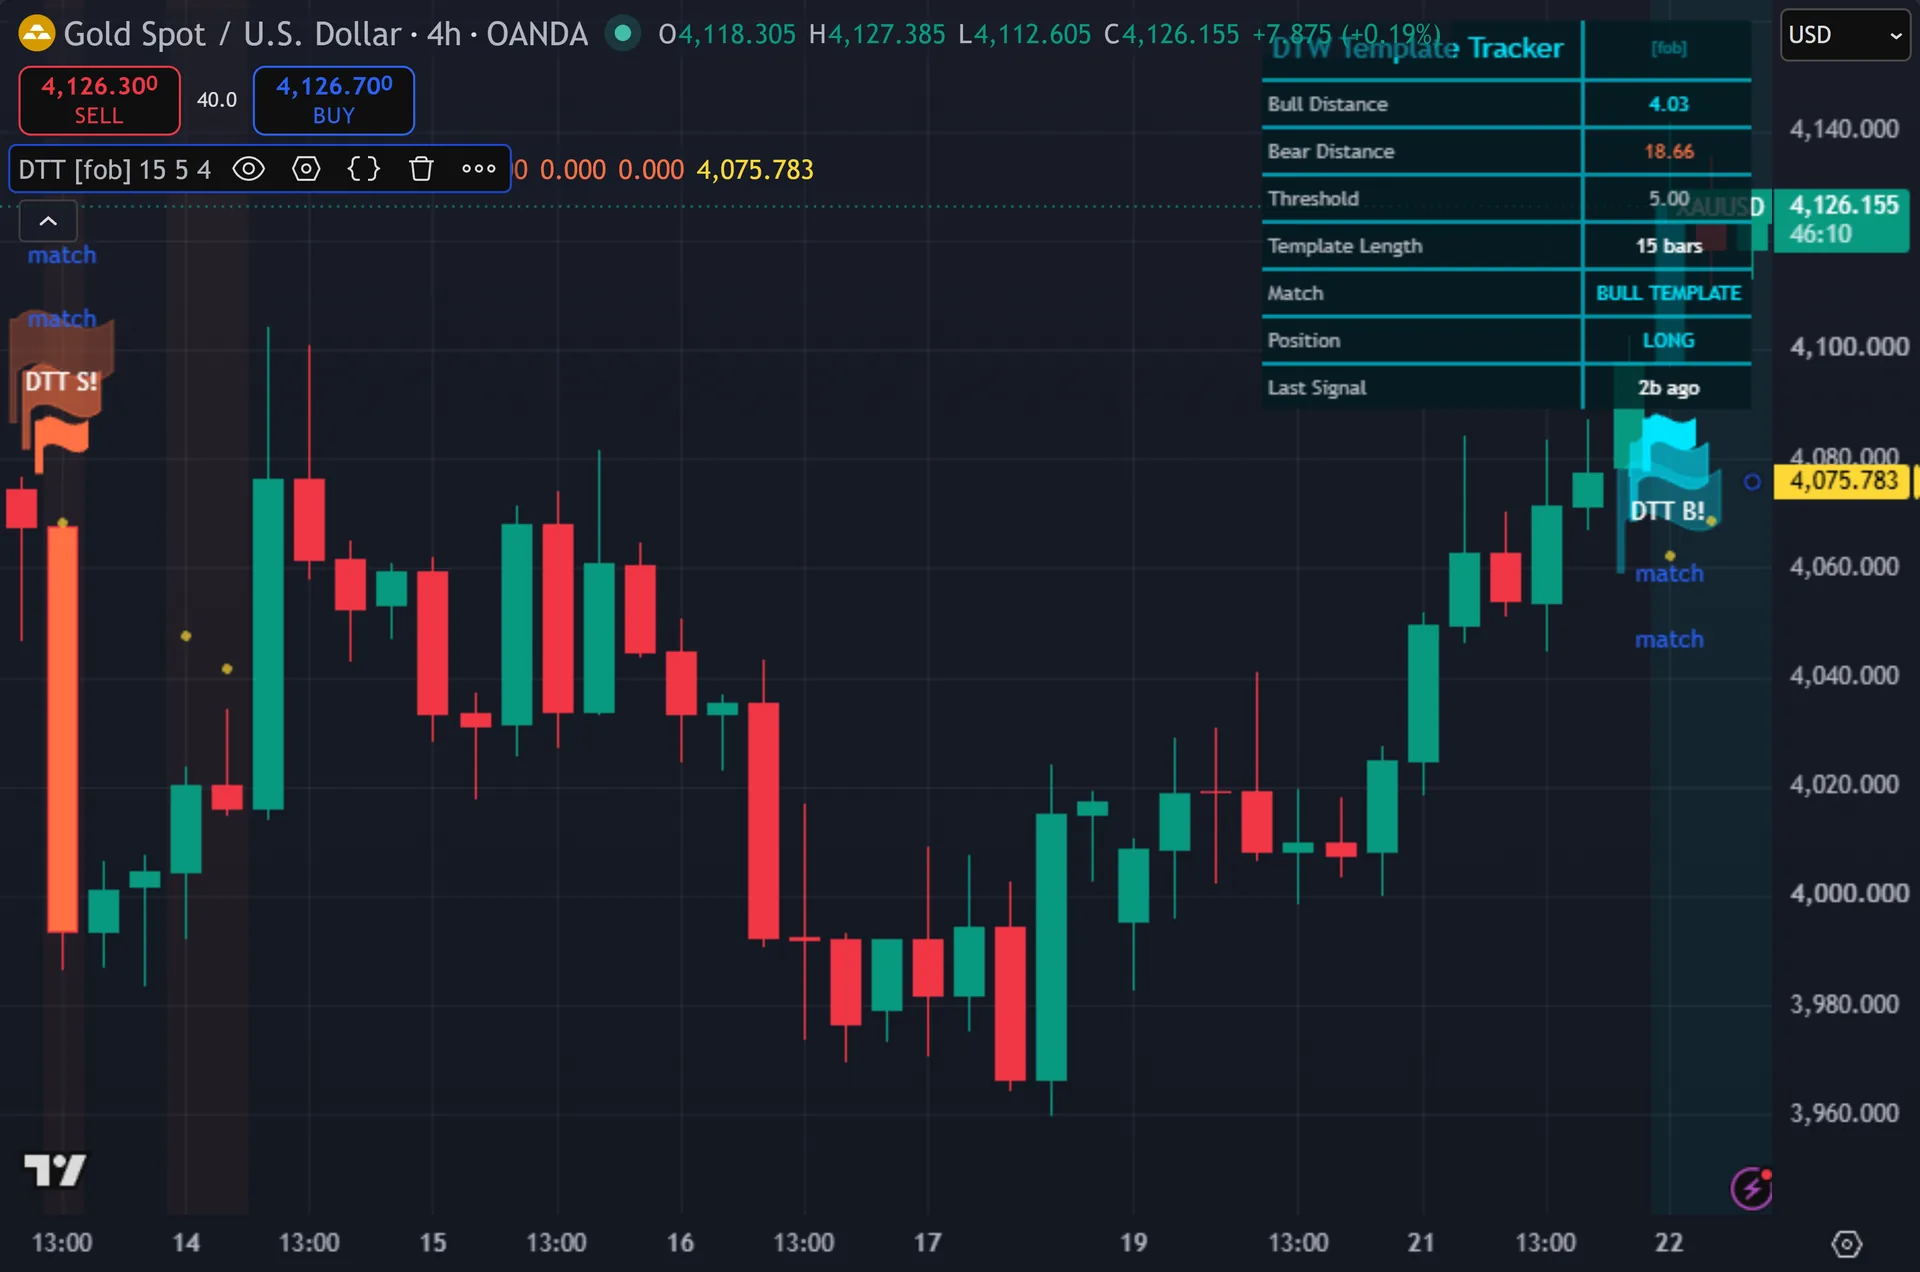
The templates are two straight lines. Then, the tool cannot find a head and shoulders, a double top, a flag or any pattern with internal structure. It measures one thing: how cleanly the recent window runs in one direction. Yet, treat the name as a description of the method, not of a pattern library.
DTW distance is not a probability. Truly, a distance of 1.2 says the shape fits the ramp closely. It says nothing about the next bar, and the script carries no stop, target or position sizing logic.
Cost grows roughly with the square of template length even inside the band, so useful values stop near 25. Plainly, the window also carries no volume, trend or level context. A perfect straight-line rise into major resistance scores exactly the same as one in open space.
Get DTW Template Tracker on TradingView
Open DTW Template Tracker on TradingView
If you also trade MetaTrader, the MT4 and MT5 indicator library is available below.
Get the complete indicator library
One email unlocks the full MT4 and MT5 indicator library. Also, this TradingView script stays free on TradingView – the button above adds it to your chart.
Using it alongside MetaTrader
Adding a script on TradingView takes one click, so there is no install step here. Indeed, if you want the same idea on MetaTrader, the MT4 and MT5 indicator installation guide walks through copying files into the data folder and attaching them to a chart. You can also browse the full MetaTrader indicator library, the MT4 indicators section, or the other free TradingView scripts published on this profile. For related chart tools see the MT5 indicators section and the forex trading strategies guides.
External references
- Stochastic oscillator on Wikipedia
- Stochastic Oscillator at Investopedia
- Fibonacci Time Zones at StockCharts ChartSchool
Frequently asked questions
Is this real dynamic time warping?
Yes, the dynamic programming is genuine. Still, the script builds a full cost matrix, accumulates minimum path costs and reads the bottom-right cell as the distance. The simplification sits in the templates rather than the algorithm. Thus, it warps against two straight lines instead of against stored historical patterns.
Does DTW Template Tracker repaint?
The flags do not. Hence, every plotshape sits behind barstate.isconfirmed, so a flag appears only after the bar closes and then stays put. The background tint, the yellow template circles and the dashboard distances use the live match state, so those do move during an open bar.
Why does the distance never drop under the threshold?
Distances scale with template length. Next, if you raised Template Length above 15, every distance grew and 5.0 became too tight. Read the live bull and bear numbers on the dashboard, then set the threshold a little above the values you actually see.
What does the position row mean?
It shows the last side the script fired. Then, that state locks the side, so a buy cannot follow a buy and the next flag must be a sell. Together with the four-bar cooldown it keeps the chart from filling with repeated same-direction flags inside one move.
How much should I rely on this indicator?
Treat it as one input, not a decision. Yet, it is a chart analysis tool, not trading advice. Test it on your own markets and timeframes before relying on it. Results are not guaranteed; past performance is not indicative of future results.

About the author
Written by Dominic Walsh, a Forex trader and MT4/MT5 indicator, Expert Advisor and script developer. Every tool on forexmt4systems.com is tested on live charts before release and ships with ready-to-use compiled MT4 (.ex4) and MT5 (.ex5) files. Learn more about the trader and developer behind this site.
How we build, test and correct every tool: Editorial & Testing Policy. Trading carries risk; see the disclaimer.