
A moving average uses a fixed weight. Also, a Kalman filter recalculates its weight every bar from its own error. Kalman Trend State is a kalman filter indicator TradingView traders can use to track two hidden values at once: a smoothed price and a per-bar velocity. Indeed, entries need velocity to clear an ATR-scaled threshold, the filter to track cleanly, and price to cross the filter line in the same direction.
It is free and open source. Still, you can add it to any chart from the Kalman Trend State script page on TradingView, and the full Pine source is published there for you to read.
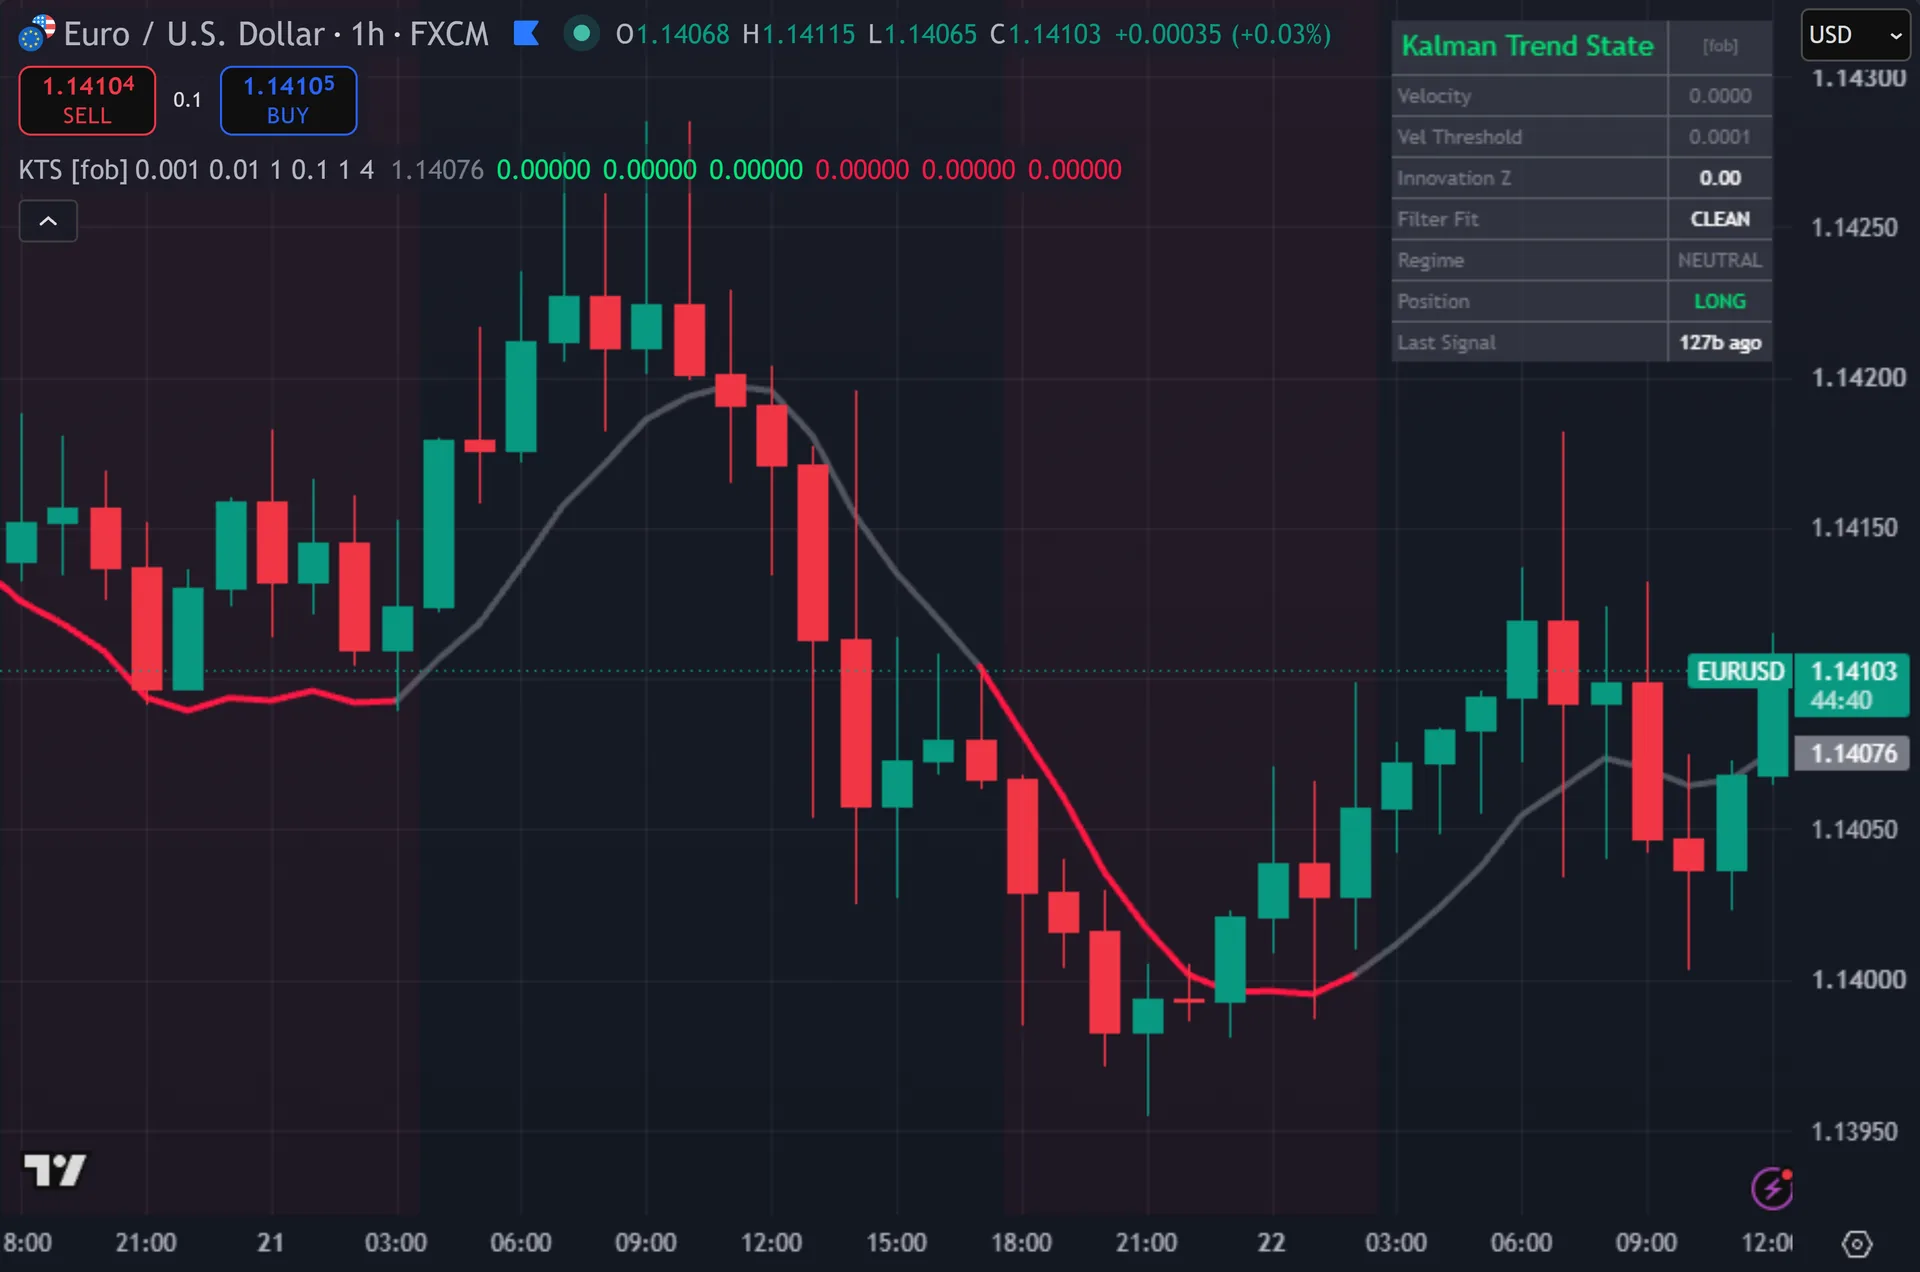
What Kalman Trend State plots on the price chart
One thick line carries the Kalman price estimate. Thus, it turns green while velocity reads positive beyond the threshold, red while it reads negative, and grey while the regime stays neutral. The background washes the same colours. Hence, green triangles print below the bar with the text KTS up, and red triangles print above it with KTS dn, each stacked in three layers for a glow. An eight-row dashboard reports velocity, the velocity threshold, the innovation z-score, filter fit, regime, position state and bars since the last signal.
How Kalman Trend State is built
The two-state filter
The state vector holds price and velocity. Next, each bar starts with a prediction: next price equals current price plus current velocity, and velocity carries forward unchanged. The script propagates a two-by-two covariance matrix alongside that prediction. Then, that covariance step is what separates a Kalman filter from a moving average.
Then comes the update. Yet, innovation is the raw difference between the close and the predicted price. The script divides predicted variance by that variance plus measurement noise R to get the gain, then corrects both price and velocity by gain times innovation. Truly, larger recent errors lift the covariance, which lifts the gain, which makes the filter track price harder. Small errors do the reverse.
Process noise adapts on its own. Plainly, q starts at 0.001 and adds 0.01 times ATR over 14 bars divided by close. So a volatile symbol earns a larger Q, which keeps the filter responsive when ranges expand. Also, r defaults to 1.0 and stays fixed unless you change it.
The two signal layers
Layer one is a regime gate. Indeed, the script compares estimated velocity against 0.10 times ATR over 14 bars. Above that line the regime reads trending up. Below its negative, trending down. Between the two it reads neutral and no entry can fire. Still, ATR scaling keeps that test proportional across symbols and timeframes.
Layer two is the trigger. Thus, price must cross the Kalman line in the regime direction, and the innovation z-score must sit inside one sigma. That second test asks whether the filter still tracks cleanly. Hence, a large z-score means price jumped further than the filter expected, so the script sits that bar out.
Two more locks apply. Next, a position state stores the last side and blocks a repeat on the same side, so buys and sells must alternate. A four-bar cooldown blocks anything too soon after the previous signal. Then, both signals also require barstate.isconfirmed, so nothing fires mid-bar.
How to read the signals
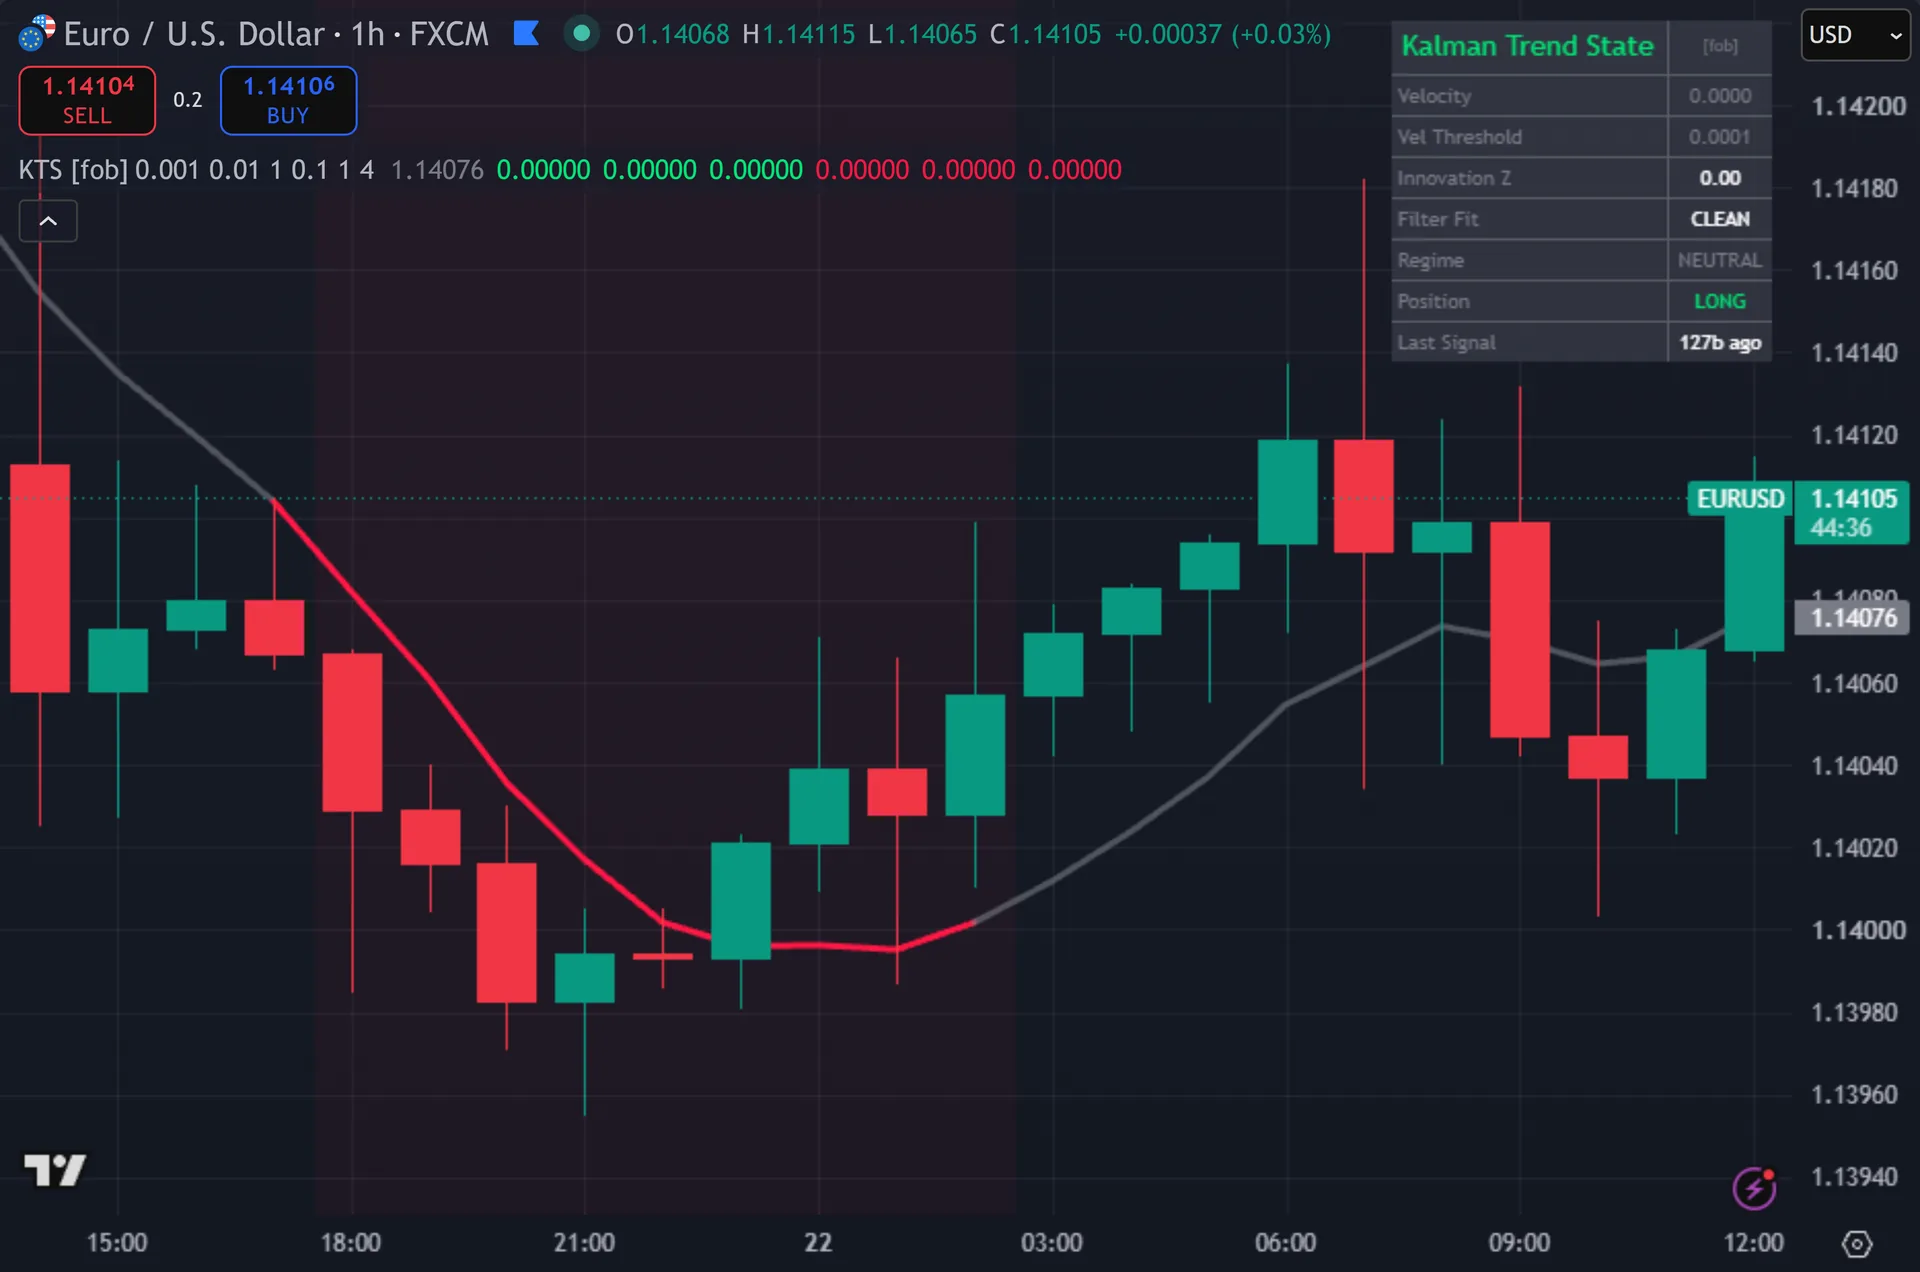
Watch the velocity row against the threshold row. Yet, the dashboard prints both to four decimals. Velocity well beyond the threshold marks a committed move. Truly, velocity hovering at the line marks a market the filter cannot separate from noise, and the background tint will flicker to match.
Filter fit matters as much as regime. Plainly, when that row reads NOISY, the innovation ran beyond one sigma and no entry can fire, however strong the trend looks. That is the design. Also, the tool refuses to signal at the moment its own model has just been surprised.
The triangles wait for the bar to close, so a signal lands at the open of the next candle. Indeed, everything else on the chart is live. The Kalman line, its colour, the background wash and every dashboard number all update while the current bar moves.
Every Kalman Trend State setting explained
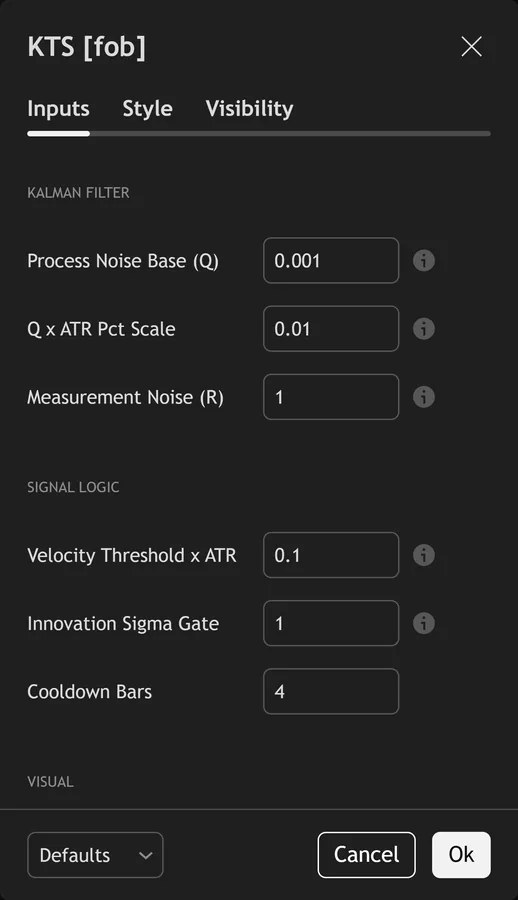
The script exposes 11 inputs, grouped in the settings panel exactly as shown below. Defaults are the published values.
Kalman Filter
| Setting | What it does | Default | Range |
|---|---|---|---|
| Process Noise Base (Q) | Base process noise. Higher = more responsive to fast moves; lower = smoother. | 0.001 | 0.00001 to 0.1 |
| Q x ATR Pct Scale | Scales process noise by atr/close so the filter auto-adapts across symbols and timeframes. | 0.01 | 0.0 to 0.5 |
| Measurement Noise (R) | Observation noise. Higher = filter trusts the model; lower = trusts price more. | 1.0 | 0.01 to 10.0 |
Signal Logic
| Setting | What it does | Default | Range |
|---|---|---|---|
| Velocity Threshold x ATR | |velocity| must exceed k x ATR for a ‘trending’ regime. ATR-adaptive across instruments. | 0.10 | 0.01 to 1.00 |
| Innovation Sigma Gate | Entry only fires when |innovation| <= k x sigma (filter is tracking cleanly). | 1.0 | 0.5 to 3.0 |
| Cooldown Bars | Sets the cooldown bars used in the calculation. | 4 | 1 to 20 |
Visual
| Setting | What it does | Default | Range |
|---|---|---|---|
| Show Dashboard | Toggles show dashboard on the chart. | on | on / off |
| Show 3-Layer Glow | Toggles show 3-layer glow on the chart. | on | on / off |
| Show Kalman Line | Toggles show kalman line on the chart. | on | on / off |
| Buy Color | Colour used for buy color. | #00e676 | |
| Sell Color | Colour used for sell color. | #ff1744 |
Alerts built into Kalman Trend State
The script ships 11 alert conditions. Still, open the alert dialog on the chart, pick the indicator as the condition source, then choose the event you want. Alerts fire on the close of the bar, so they follow the same confirmed-bar rule the on-chart signals use.
- KTS Buy
- KTS Sell
- KTS Any Signal
- KTS Trend Up Start
- KTS Trend Down Start
- KTS Clean Fit
- KTS Cross Up
- KTS Cross Down
- KTS Webhook JSON
Other markets and timeframes
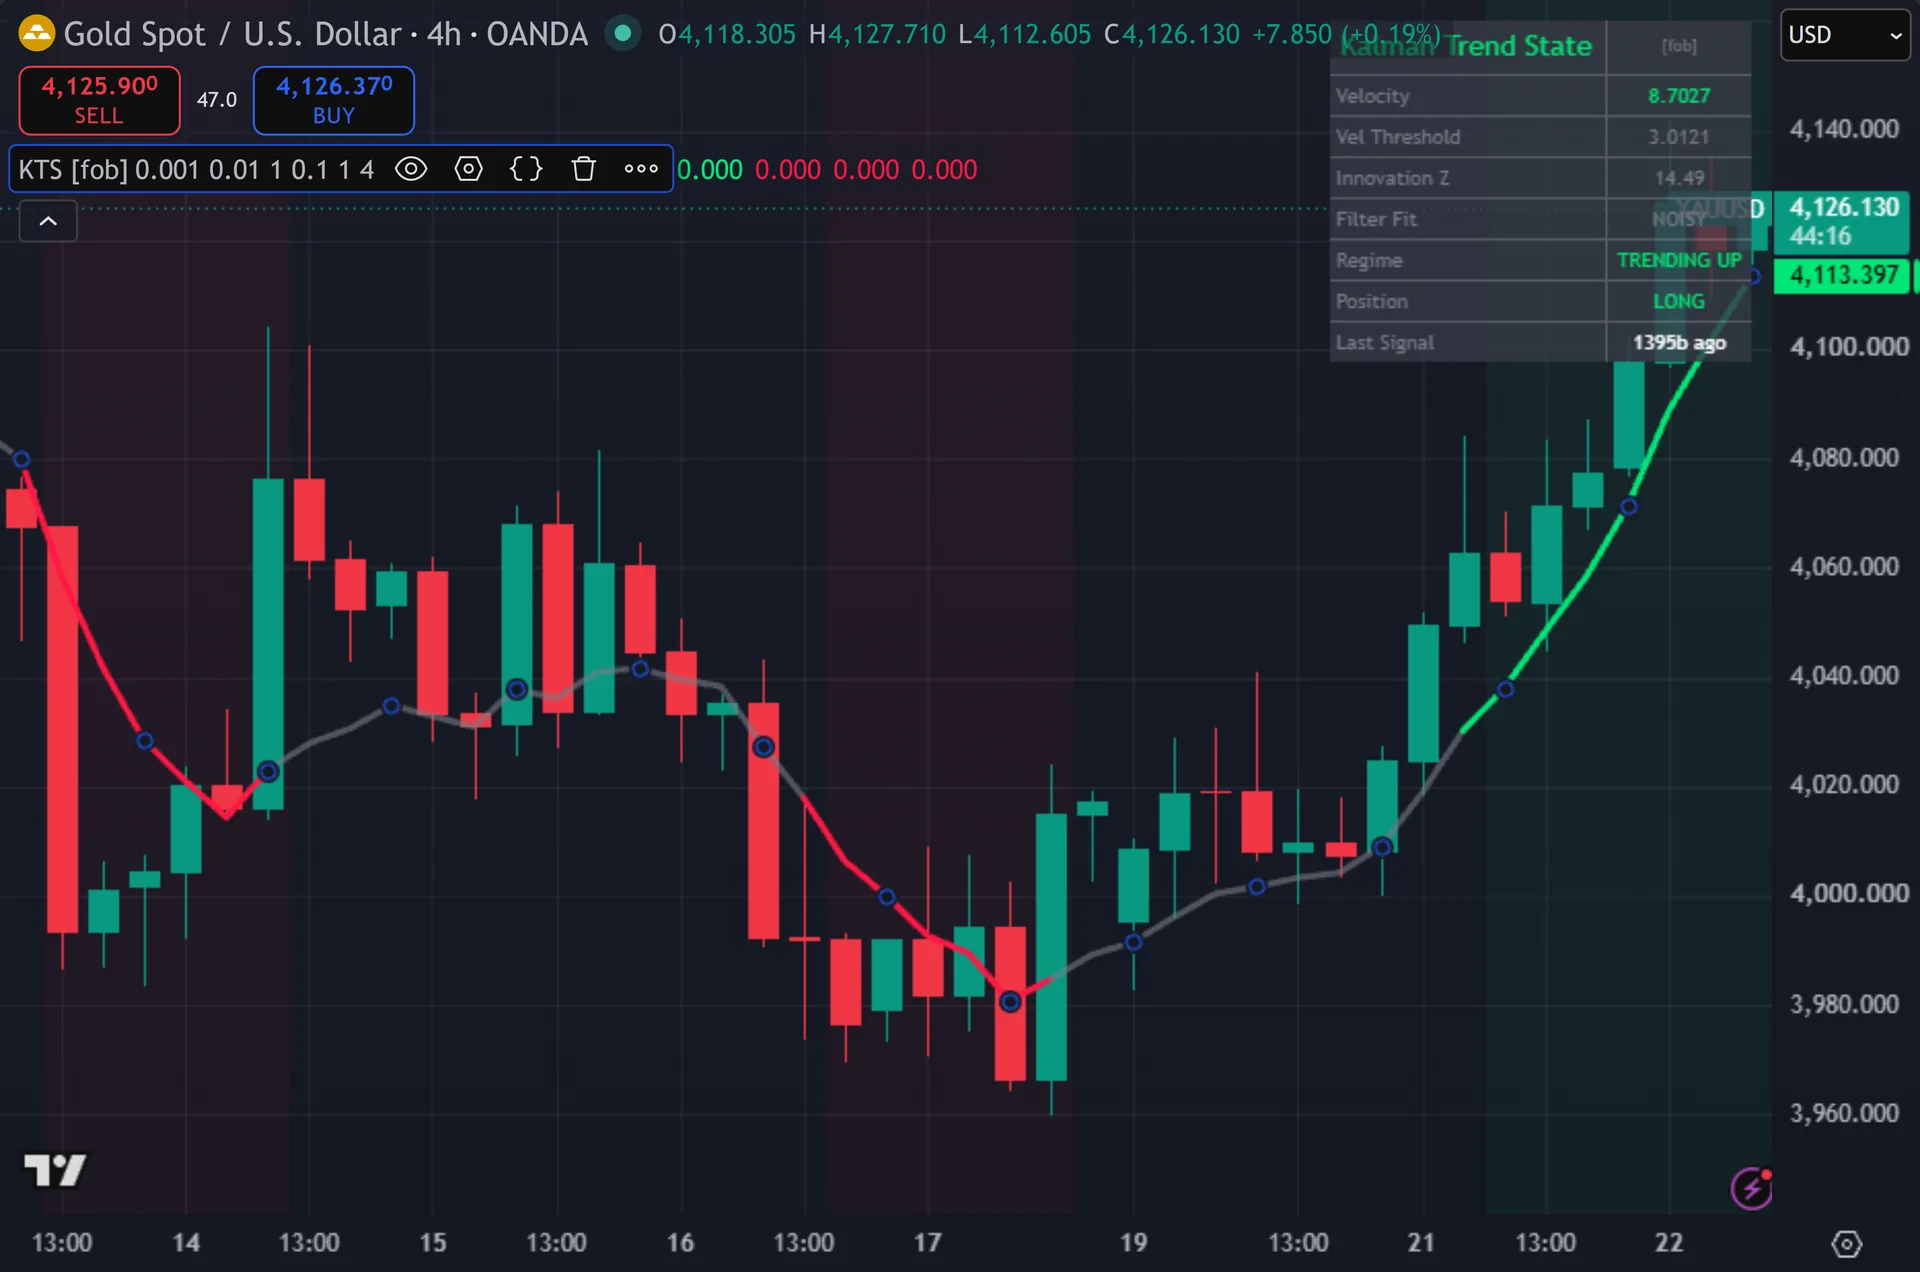
Half the logic is market-agnostic and half is not. Thus, the velocity gate scales with ATR, so it transfers cleanly to gold, indices, crypto and equities. Measurement noise R does not. Hence, r sits in raw price units, so 1.0 means something very different on a pair near 1.10 than on an index near 60,000. Test R and Q on each new instrument before you trust the defaults, because that pair of numbers sets how hard the filter tracks price.
Limitations worth knowing
The filter estimates a state. It does not forecast one. Velocity describes the move the last few bars produced, and it turns after price turns, exactly like every other smoother.
The default noise settings are scale-dependent. Next, with R at 1.0 in price units, the innovation gate rarely bites on a currency pair, where innovations are tiny numbers. On a high-priced symbol the same gate can block constantly. Then, tune R to the instrument or the second signal layer does little useful work.
There are no stops, no targets, no position sizing and no higher-timeframe context. Yet, the script also holds one position state at a time, so it will not add to a running move, and the four-bar cooldown suppresses a genuine second entry that follows quickly.
Get Kalman Trend State on TradingView
Open Kalman Trend State on TradingView
If you also trade MetaTrader, the MT4 and MT5 indicator library is available below.
Get the complete indicator library
One email unlocks the full MT4 and MT5 indicator library. Truly, this TradingView script stays free on TradingView – the button above adds it to your chart.
Using it alongside MetaTrader
Adding a script on TradingView takes one click, so there is no install step here. Plainly, if you want the same idea on MetaTrader, the MT4 and MT5 indicator installation guide walks through copying files into the data folder and attaching them to a chart. You can also browse the full MetaTrader indicator library, the MT4 indicators section, or the other free TradingView scripts published on this profile. For related chart tools see the MT5 indicators section and the forex trading strategies guides.
External references
Frequently asked questions
Is this a real Kalman filter or a rebranded moving average?
It is a real recursive filter. Also, the script propagates a two-by-two covariance matrix, computes an innovation and a gain on every bar, then updates both price and velocity from that gain. The gain changes bar by bar, which a moving average weight never does.
Does Kalman Trend State repaint?
The triangles do not. Indeed, both signal booleans require barstate.isconfirmed, so an arrow appears only after the bar closes. The Kalman line itself is recursive and updates on the live bar, as do the background tint and every dashboard number.
What is the innovation z-score for?
It measures how far the close landed from the filter prediction, in units of the filter’s own expected error. Still, inside one sigma the fit reads CLEAN and entries are allowed. Beyond it the fit reads NOISY and the script blocks entries until the filter catches up.
Why do I see no signals on my chart?
Four conditions stack. Thus, velocity must clear 0.10 times ATR, the innovation must sit inside one sigma, price must cross the line in the regime direction, and the four-bar cooldown must have elapsed. Lower the velocity threshold or raise the sigma gate to loosen it.
How much should I rely on this indicator?
Treat it as one input, not a decision. Hence, it is a chart analysis tool, not trading advice. Test it on your own markets and timeframes before relying on it. Results are not guaranteed; past performance is not indicative of future results.

About the author
Written by Dominic Walsh, a Forex trader and MT4/MT5 indicator, Expert Advisor and script developer. Every tool on forexmt4systems.com is tested on live charts before release and ships with ready-to-use compiled MT4 (.ex4) and MT5 (.ex5) files. Learn more about the trader and developer behind this site.
How we build, test and correct every tool: Editorial & Testing Policy. Trading carries risk; see the disclaimer.