
Momentum Divergence Engine compares swing points in price against swing points in RSI. Also, this RSI divergence indicator TradingView traders can use on any symbol tracks both regular and hidden divergence, on a 14 period RSI by default. It confirms pivots with 5 bars left and 3 bars right. Indeed, a 50 EMA band, a volume test and a 15 bar cooldown then filter what survives.
It is free and open source. Still, you can add it to any chart from the Momentum Divergence Engine script page on TradingView, and the full Pine source is published there for you to read.
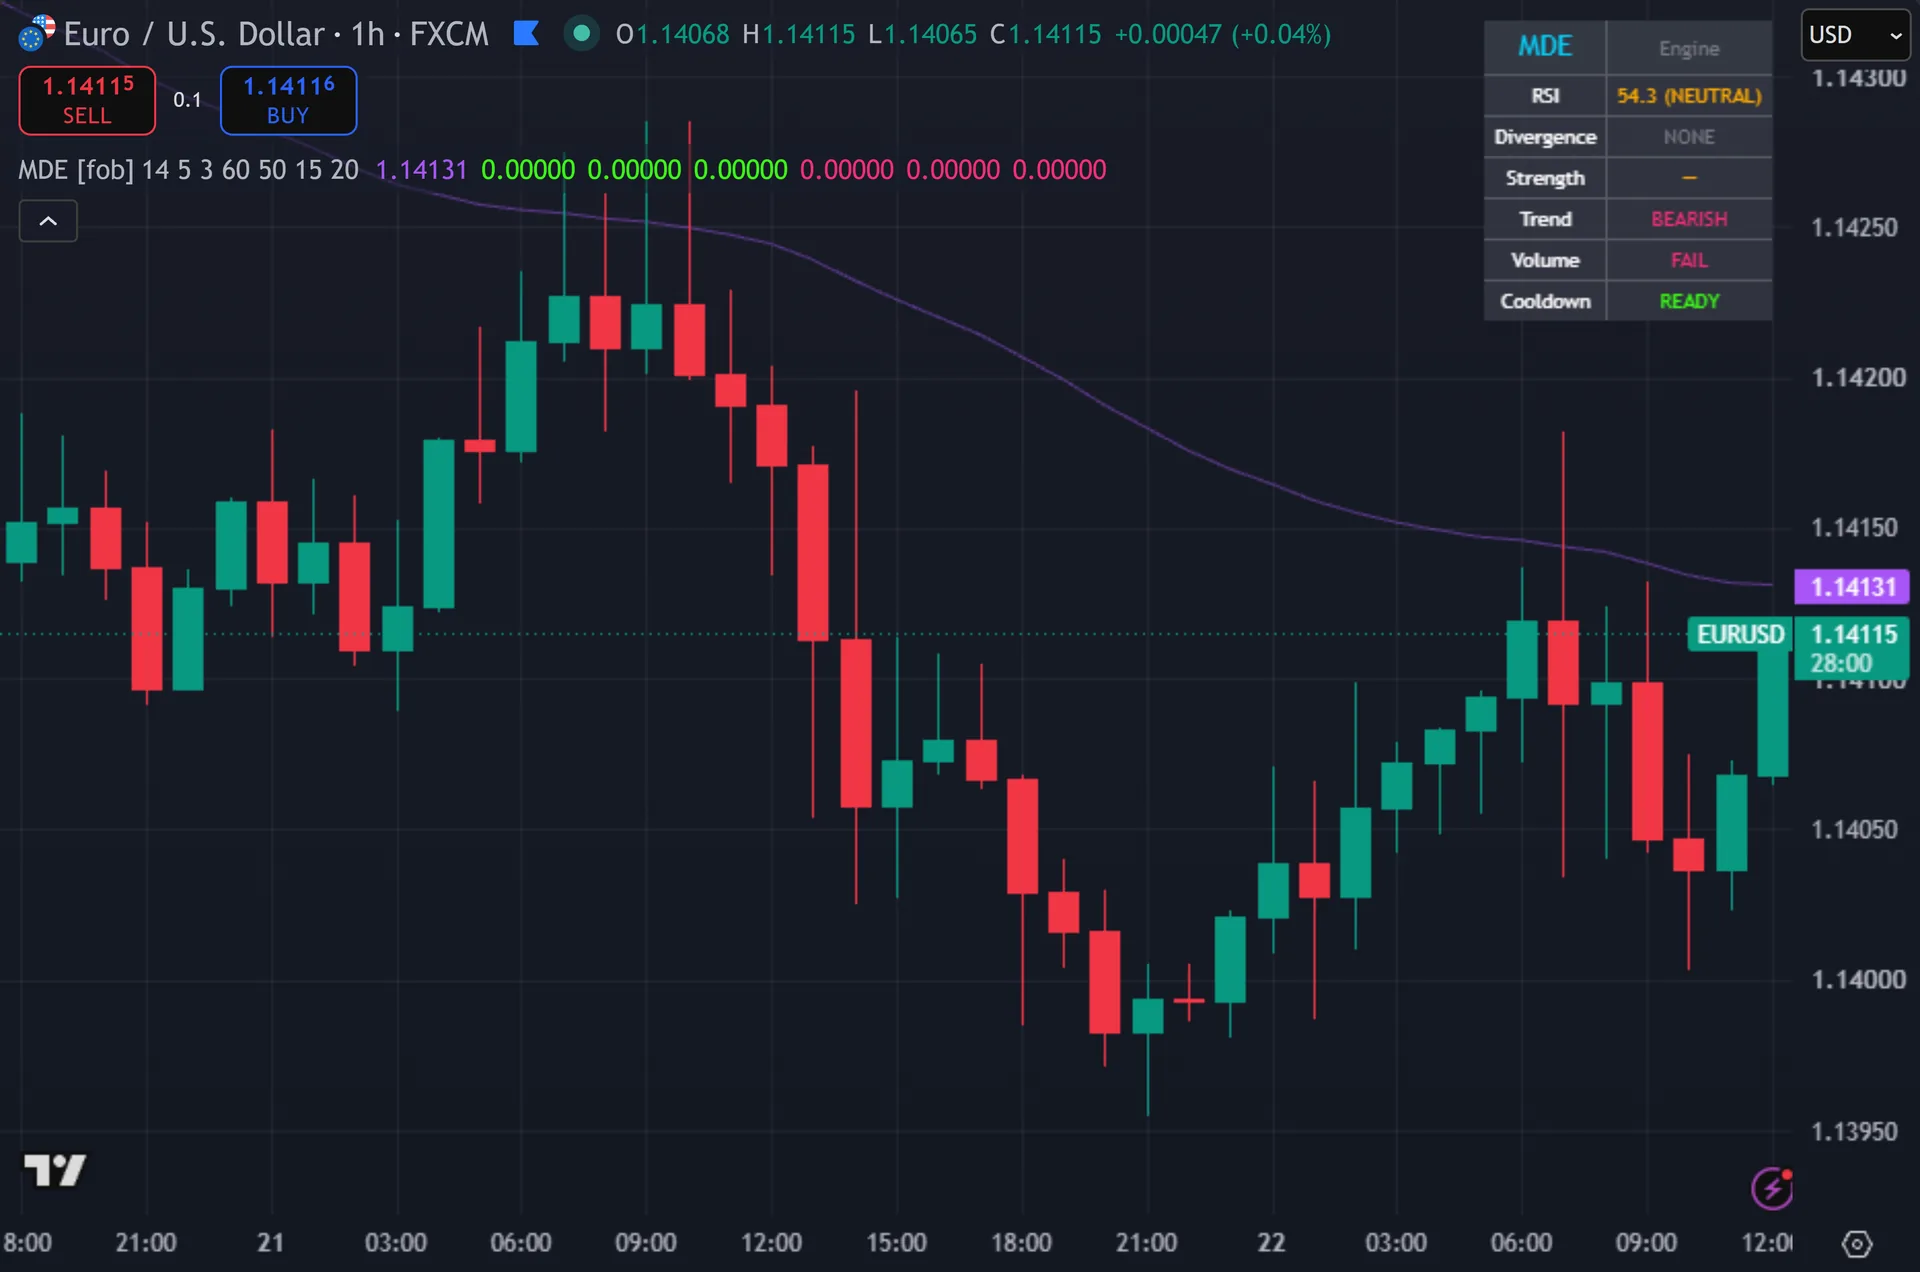
What Momentum Divergence Engine plots on the price chart
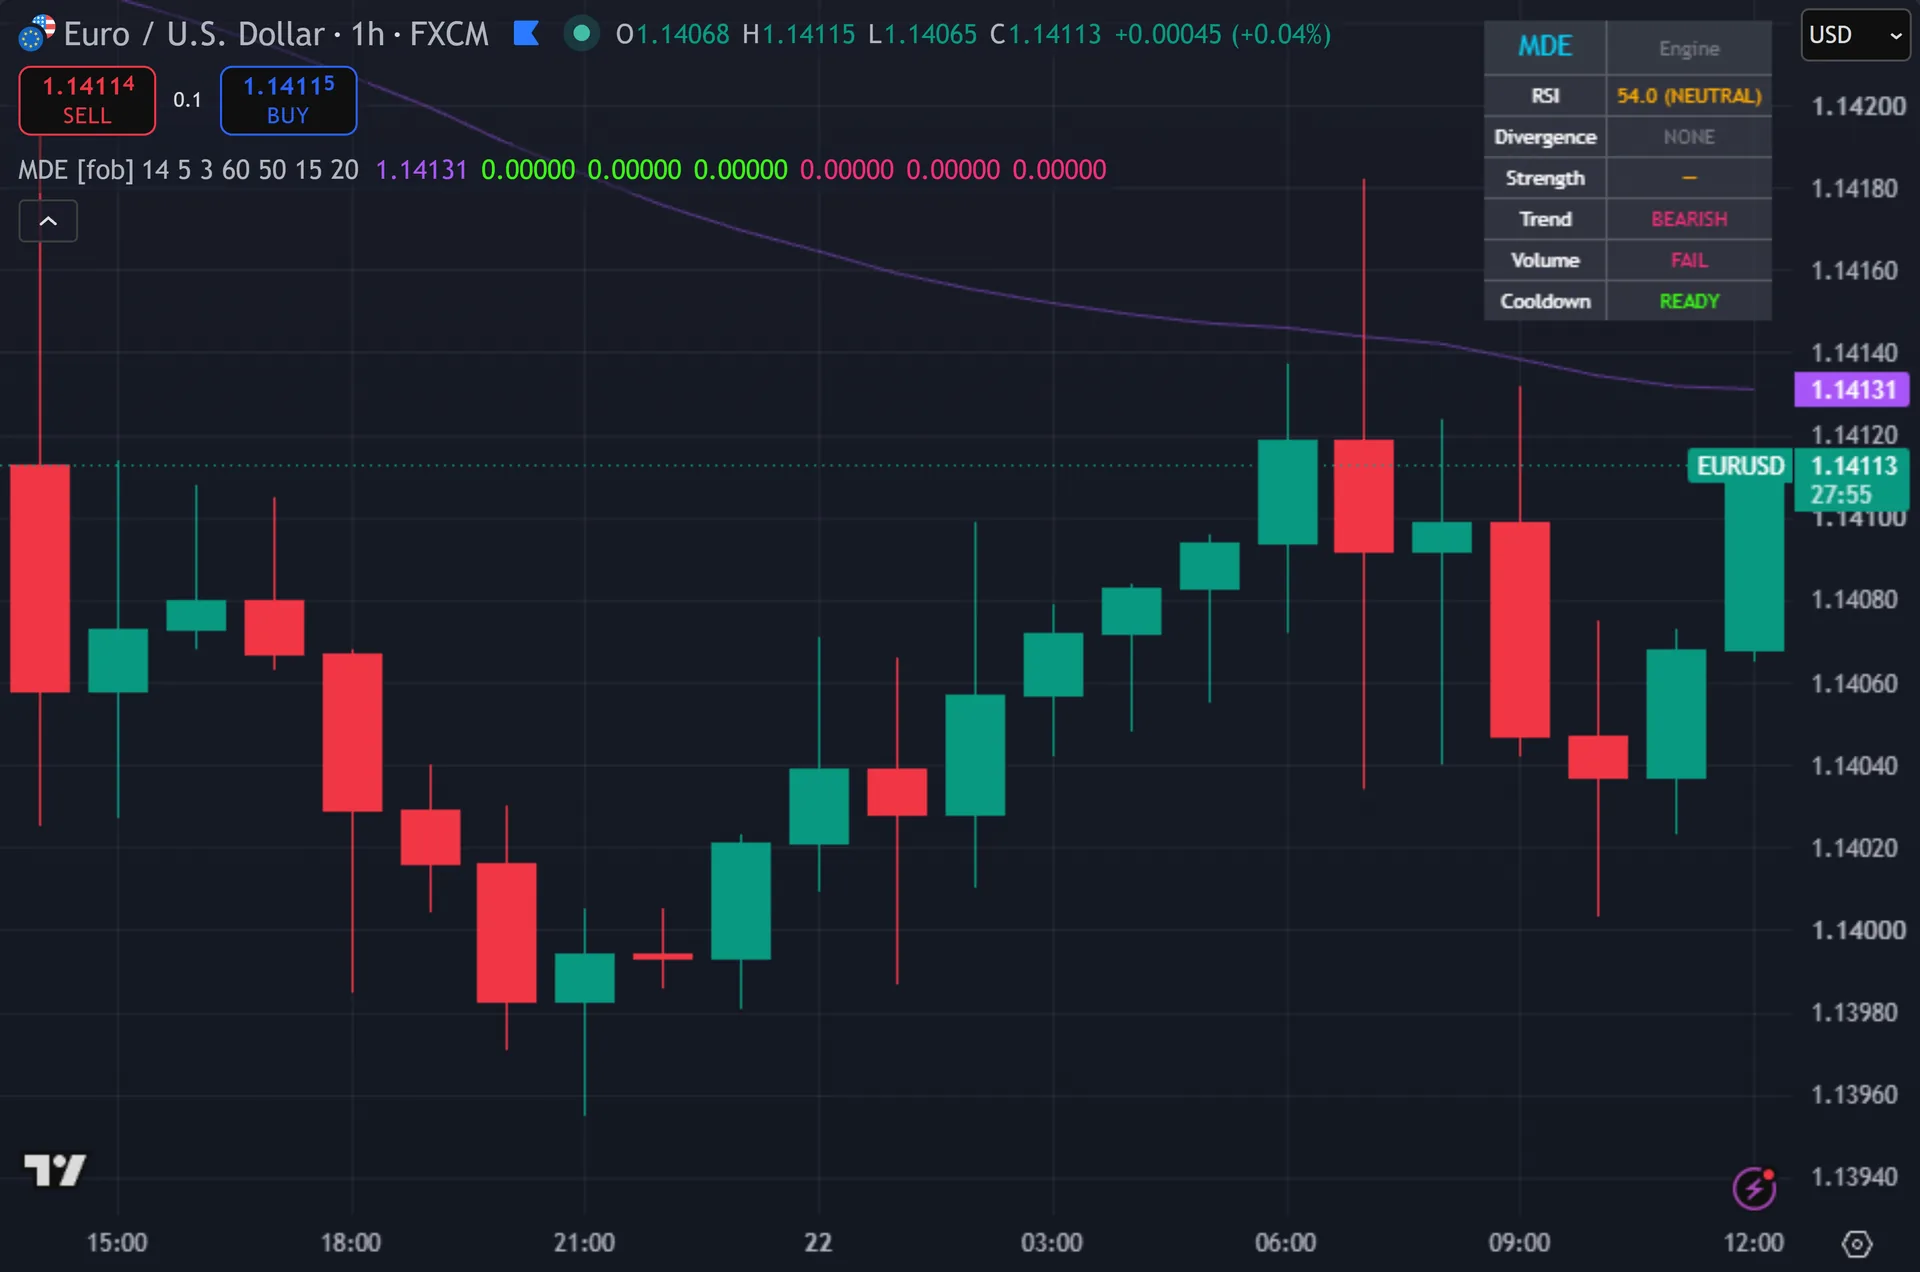
A dashed line connects the two pivots behind each divergence, right on the price chart. Thus, green marks a bullish pair, pink a bearish one. Triangles print below or above the bar in three glow layers, carrying a BUY or SELL tag. Hence, a label then reports the divergence type, the RSI value, the strength in RSI points and volume as a multiple of its 20 bar average. The 50 EMA plots in purple. Next, a seven row dashboard shows RSI and its zone, the last divergence, its strength, the trend side, the volume verdict and cooldown status.
How Momentum Divergence Engine is built
Pivots in two series at once
The script runs pivot detection twice. Then, once on price highs and lows. Once on the RSI line itself. Yet, both use the same geometry: 5 bars to the left and 3 bars to the right. A pivot confirms only after those 3 right hand bars close.
Here is the part worth knowing. Truly, the pivot store updates only when the price pivot and the RSI pivot confirm on the same bar. If RSI turns a bar earlier than price, that pair never enters memory. Plainly, the rule is strict on purpose, and it explains why the chart shows fewer divergences than your eye finds.
Each store keeps two generations: the current pivot and the one before it. Also, every comparison runs between those two. The pair must also sit within 60 bars of each other, which is the Max Bars Between Pivots default.
Four divergence tests, then four filters
Regular bullish needs a lower price low with a higher RSI low. Indeed, regular bearish needs a higher price high with a lower RSI high. Hidden bullish flips the first pair: a higher price low with a lower RSI low. Still, hidden bearish takes a lower price high with a higher RSI high. Regular wins any tie, because the hidden tests skip whenever a regular one already fired on that bar.
Strength is the gap between the two RSI pivot values, in RSI points. Thus, a regular bull pair where RSI lifted from 22 to 34 reads 12. That number measures how wide the momentum gap opened. It measures nothing else.
Four filters then decide. The bar must close. Volume must beat its own 20 bar average. Hence, fifteen bars must pass after the last signal. And the trend filter checks price against the 50 EMA with a 2 percent tolerance. Next, a bullish divergence needs a close at or below 1.02 times the EMA. A bearish one needs a close at or above 0.98 times it. On forex, 2 percent is a wide band, so that filter rarely blocks anything. On fast crypto it bites.
How to read the signals
Divergence describes disagreement, not a reversal. Then, a regular bull pair says price made a lower low while momentum did not. That matters at a level the market has respected before. Yet, mid range it says much less.
Use the label numbers to rank each signal. Truly, a strength over roughly 10 RSI points marks a wide momentum gap. A volume multiple of 1.5x means the confirming bar traded heavily against its own 20 bar norm. Plainly, both together outweigh a 3 point gap on 1.0x volume.
Remember the 3 bar delay. Also, a pivot needs 3 bars to its right before it exists, so the triangle prints at least 3 bars after the actual swing low or high. The dashed line still reaches back to where those pivots really sat. Indeed, size your stop for that gap.
Every Momentum Divergence Engine setting explained
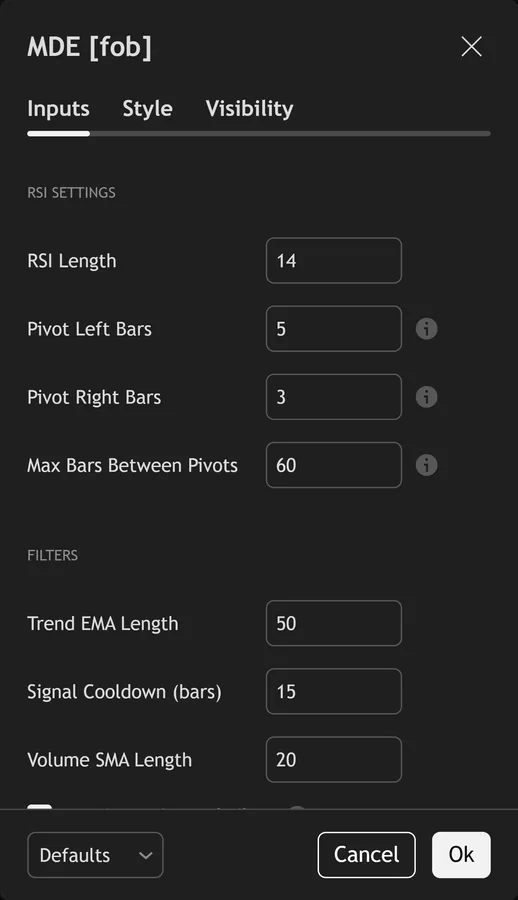
The script exposes 12 inputs, grouped in the settings panel exactly as shown below. Defaults are the published values.
RSI Settings
| Setting | What it does | Default | Range |
|---|---|---|---|
| RSI Length | Sets the rsi length used in the calculation. | 14 | |
| Pivot Left Bars | Bars to the left of pivot for divergence detection | 5 | |
| Pivot Right Bars | Bars to the right confirming pivot | 3 | |
| Max Bars Between Pivots | Maximum distance between two pivots for divergence | 60 |
Filters
| Setting | What it does | Default | Range |
|---|---|---|---|
| Trend EMA Length | Sets the trend ema length used in the calculation. | 50 | |
| Signal Cooldown (bars) | Sets the signal cooldown (bars) used in the calculation. | 15 | |
| Volume SMA Length | Sets the volume sma length used in the calculation. | 20 | |
| Require EMA Trend Filter | Bull div requires price near/below EMA; bear div near/above | on | on / off |
Divergence Types
| Setting | What it does | Default | Range |
|---|---|---|---|
| Show Regular Divergence | Toggles show regular divergence on the chart. | on | on / off |
| Show Hidden Divergence | Toggles show hidden divergence on the chart. | on | on / off |
Visuals
| Setting | What it does | Default | Range |
|---|---|---|---|
| Show Dashboard | Toggles show dashboard on the chart. | on | on / off |
| Show Divergence Lines on Price | Toggles show divergence lines on price on the chart. | on | on / off |
Alerts built into Momentum Divergence Engine
The script ships 13 alert conditions. Still, open the alert dialog on the chart, pick the indicator as the condition source, then choose the event you want. Alerts fire on the close of the bar, so they follow the same confirmed-bar rule the on-chart signals use.
- MDE Buy Signal
- MDE Sell Signal
- MDE Any Signal
- MDE Regular Bull Div
- MDE Regular Bear Div
- MDE Hidden Bull Div
- MDE Hidden Bear Div
- MDE RSI Overbought
- MDE RSI Oversold
Other markets and timeframes
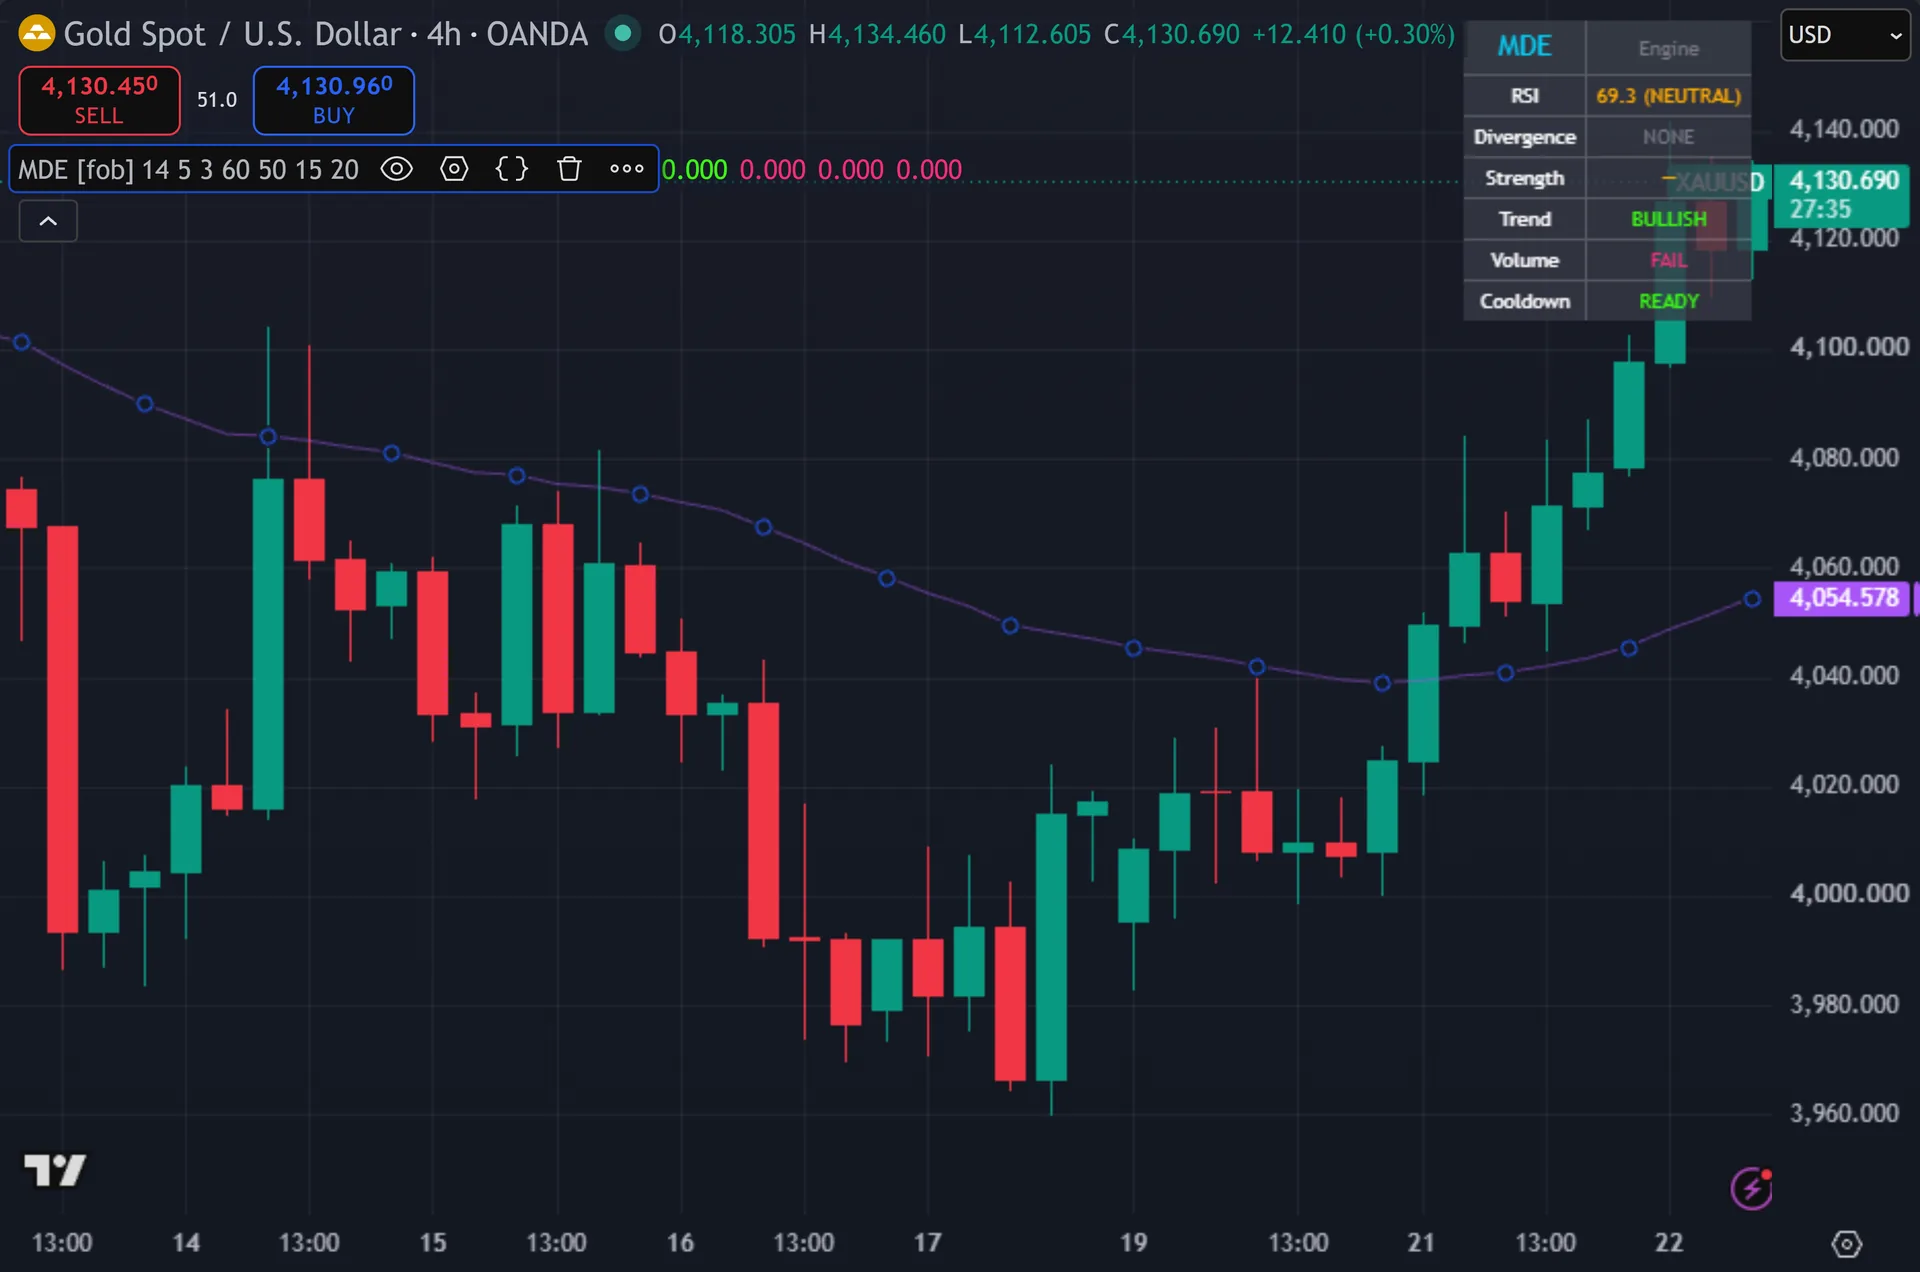
Most of the logic travels well. Thus, pivot geometry, RSI levels and the strength figure carry no currency units. Two things do not travel cleanly. Hence, the 2 percent EMA band is an absolute percentage. Two percent of EURUSD covers a very long distance. Next, two percent of a fast crypto pair is one candle. The volume gate also depends on the feed. Then, spot forex reports broker tick volume rather than exchange volume, so treat it as an activity proxy.
Limitations worth knowing
The engine finds and grades divergence. It does not trade one. There is no stop, no target, no trade management and no ranking against trend strength beyond the wide EMA band.
Pivots confirm 3 bars late by construction. Yet, that is not repainting, but it does mean every signal arrives after the swing. Raising Pivot Right Bars makes pivots cleaner and the delay longer.
The same bar rule for price and RSI pivots drops many divergences a trader would draw by hand. Truly, the 15 bar cooldown also hides a second divergence forming close behind the first. On symbols with no volume feed, the volume gate blocks every signal.
Get Momentum Divergence Engine on TradingView
Open Momentum Divergence Engine on TradingView
If you also trade MetaTrader, the MT4 and MT5 indicator library is available below.
Get the complete indicator library
One email unlocks the full MT4 and MT5 indicator library. Plainly, this TradingView script stays free on TradingView – the button above adds it to your chart.
Using it alongside MetaTrader
Adding a script on TradingView takes one click, so there is no install step here. Also, if you want the same idea on MetaTrader, the MT4 and MT5 indicator installation guide walks through copying files into the data folder and attaching them to a chart. You can also browse the full MetaTrader indicator library, the MT4 indicators section, or the other free TradingView scripts published on this profile. For related chart tools see the MT5 indicators section and the forex trading strategies guides.
External references
- Momentum (finance) on Wikipedia
- RSI at Investopedia
- Decisionpoint Intermediate Term Volume Momentum Oscillator Itvm at StockCharts ChartSchool
Frequently asked questions
Does the Momentum Divergence Engine repaint?
No. Indeed, every signal requires barstate.isconfirmed, and the triangles, labels, dashed lines and alerts all read the same gated variables. Pivots do confirm 3 bars after the swing, so signals arrive late by design rather than moving after the fact.
What is the difference between regular and hidden divergence here?
Regular compares a lower price low against a higher RSI low, or the mirror of that on highs. Still, hidden reverses the price side, so it wants a higher low in price with a lower low in RSI. Traders usually read regular as exhaustion and hidden as continuation. Thus, you can switch either type off in the Divergence Types group.
The dashboard names a divergence but no arrow appeared. Why?
One of the four filters stopped it. Hence, check the Volume row for PASS, the Cooldown row for READY, and price against the 50 EMA band. The dashboard reports each gate on its own line, so you can see which one blocked the signal.
Does it plot RSI in a separate pane?
No. Next, the script declares overlay=true, so everything draws on price. The dashboard prints the live RSI value and names its zone, marking overbought above 70 and oversold below 30. Then, add a standard RSI pane alongside if you want the full line.
How much should I rely on this indicator?
Treat it as one input, not a decision. Yet, it is a chart analysis tool, not trading advice. Test it on your own markets and timeframes before relying on it. Results are not guaranteed; past performance is not indicative of future results.

About the author
Written by Dominic Walsh, a Forex trader and MT4/MT5 indicator, Expert Advisor and script developer. Every tool on forexmt4systems.com is tested on live charts before release and ships with ready-to-use compiled MT4 (.ex4) and MT5 (.ex5) files. Learn more about the trader and developer behind this site.
How we build, test and correct every tool: Editorial & Testing Policy. Trading carries risk; see the disclaimer.