
The default ADX indicator settings are a 14-period length, the number Welles Wilder chose when he built the tool. Day traders often shorten that to 7 to 10 for faster reads on lower timeframes. ADX measures trend strength, not direction, so a reading above 25 flags a trend worth trading. This guide gives you the best ADX settings for day trading, scalping and swing trading on MT4, MT5 and TradingView. Real charts show each one, with the +DI and −DI lines, so you can see the difference before you commit.
What the ADX indicator actually measures
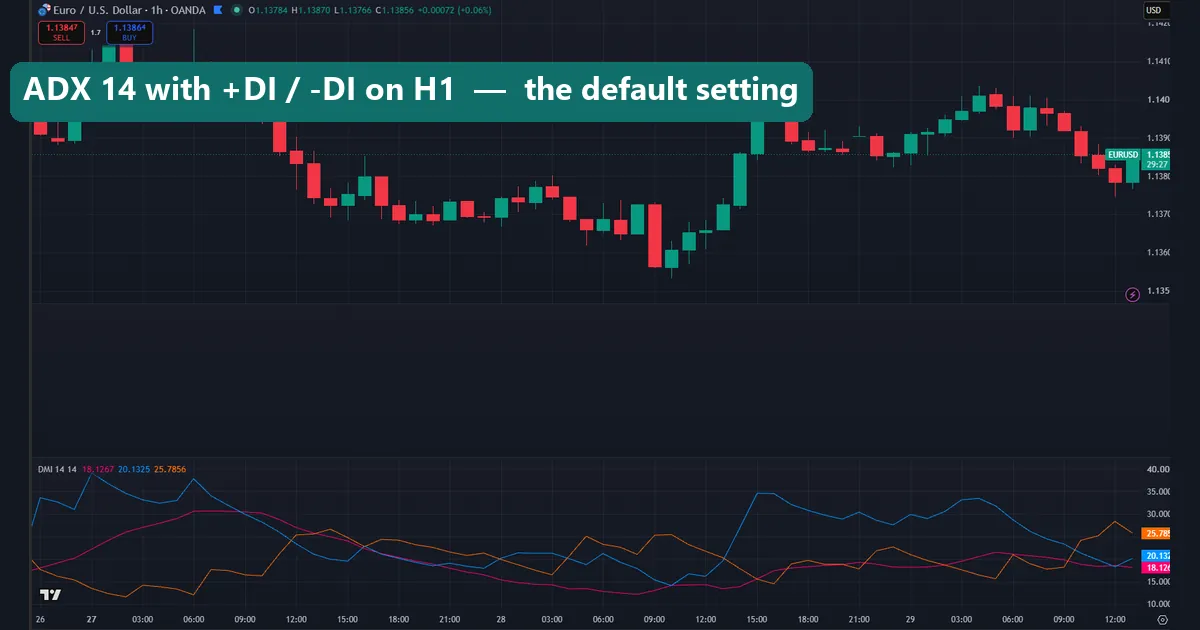
ADX stands for Average Directional Index. It answers one question: how strong is the current trend? It never tells you which way price is heading. That job belongs to two companion lines that ship with it, the +DI and the −DI. Wilder designed all three together as the Directional Movement System. The +DI rises when buyers control the range. When sellers take over, the −DI climbs instead. The ADX line then smooths the gap between those two into a single strength score from 0 to 100. In short, a high ADX means the trend is powerful, whether it points up or down.
Keep that split clear in your head. Use the ADX line for strength and the DI lines for direction. Most bad ADX trades come from asking one number to do both jobs at once.
The default ADX indicator settings: 14
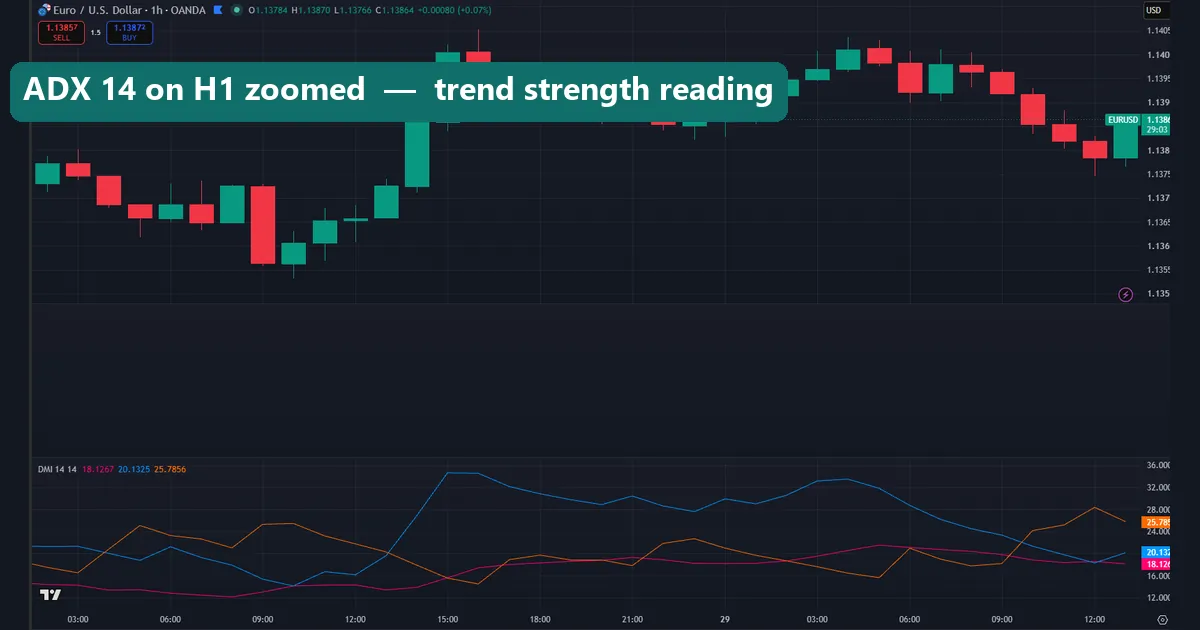
Wilder set the period to 14 on daily bars, and that default still earns its place. The 14-period length averages the last two weeks of directional movement, so it reacts to a real shift without jumping at every candle. On the chart above the ADX line stays calm through the chop, then climbs steadily once a genuine trend takes hold. The +DI and −DI cross cleanly around the turns.
Keep 14 when you trade H1 and above, or while you are still learning to read the tool. The value smooths noise well and matches how most trading books and screeners quote ADX. Change the number only once you know why the default no longer fits your timeframe.
Best ADX settings for day trading
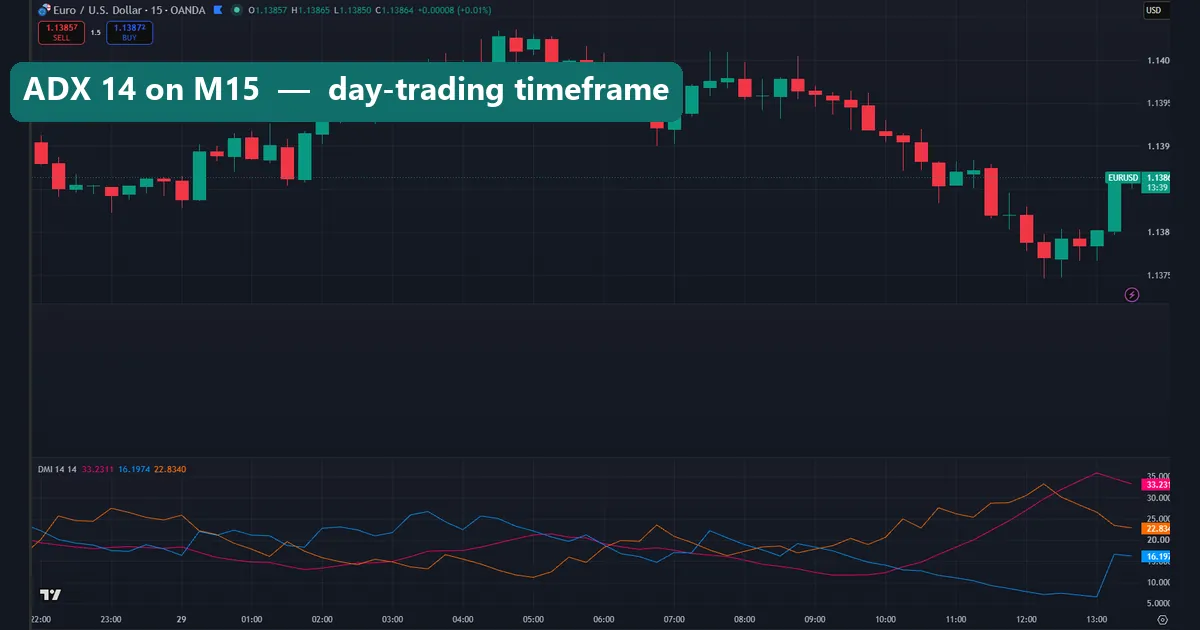
Day trading on M5 to M15 needs an ADX that reacts sooner than 14 candles. Shorten the length to 7 to 10 so the line turns up earlier when momentum builds. A shorter period tracks the current session more closely, which matters when a whole trade lasts an hour, not a week. On the chart above the length-9 ADX rises ahead of the standard setting, giving an earlier read on the intraday push.
Pair that faster line with a slightly lower threshold. Many day traders treat 20 rather than 25 as the “trend is on” level, because intraday moves rarely stretch ADX as high as daily ones do. So on lower timeframes, act when ADX clears 20 and the correct DI line sits on top. The trade-off is more false starts, so keep a higher-timeframe trend in view as a filter.
ADX settings for scalping and swing trading
Scalpers on M1 to M5 push the length shorter still, often to 5 to 7. That makes the line jumpy, so it should confirm a breakout rather than trigger one on its own. A scalper wants to know the burst has real force behind it before jumping in, and a fast-rising ADX gives that read in seconds.
Swing traders go the other way. On H4 and daily charts, keep the length at 14 or stretch it to 20 for even smoother signals. The longer basis ignores intraday wobble and only lifts on a sustained move. Fewer signals is the point here, because a swing trade needs a trend that lasts days, not minutes.
ADX indicator settings by style and timeframe
| Style | Timeframe | ADX length | Trend threshold | Use it for |
|---|---|---|---|---|
| Scalping | M1–M5 | 5–7 | 20 | Confirming fast breakouts |
| Day trading | M5–M15 | 7–10 | 20 | Early intraday trend reads |
| Intraday balanced | M30–H1 | 14 | 25 | Standard trend filter |
| Swing | H4–D1 | 14–20 | 25 | Sustained multi-day trends |
Treat these as starting points, not fixed rules. Backtest the length on the pair and timeframe you actually trade before you rely on it. A setting that shines on EURUSD H1 can behave differently on gold or an index.
Reading ADX levels: the 20 and 25 trend threshold
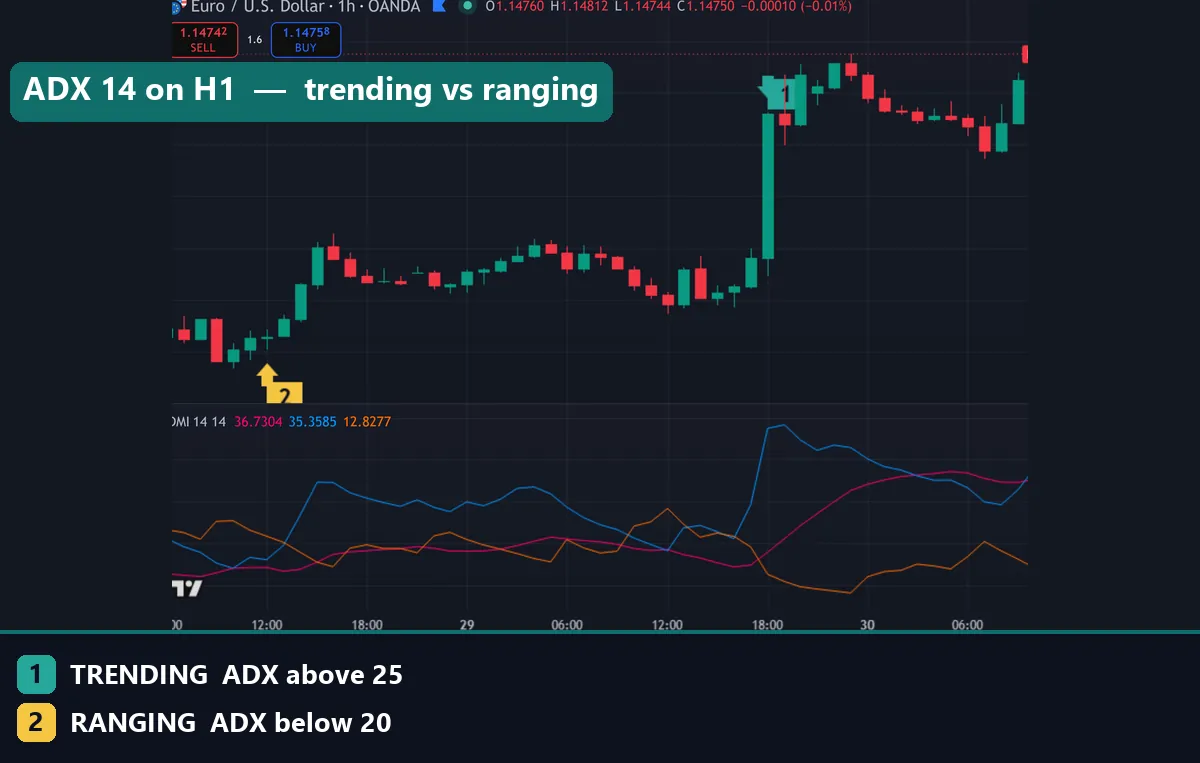
The ADX number only helps once you know the zones. Here is the simple map most traders use:
- 0–20: weak or absent trend. Range-trading conditions, where trend entries tend to fail.
- 20–25: a trend is starting to form. Day traders often act here; higher-timeframe traders wait.
- 25–40: a healthy, tradable trend. This is the sweet spot for trend-following entries.
- 40+: a strong trend, but a stretched one. Late entries risk buying near exhaustion.
The direction of the ADX line matters as much as its level. A rising ADX means the trend is gaining strength, so pullbacks are worth trading. A falling ADX means the trend is fading, even if the value still reads above 25. So watch the slope, not just the number on the chart.
Using DI crossovers with the ADX level for direction
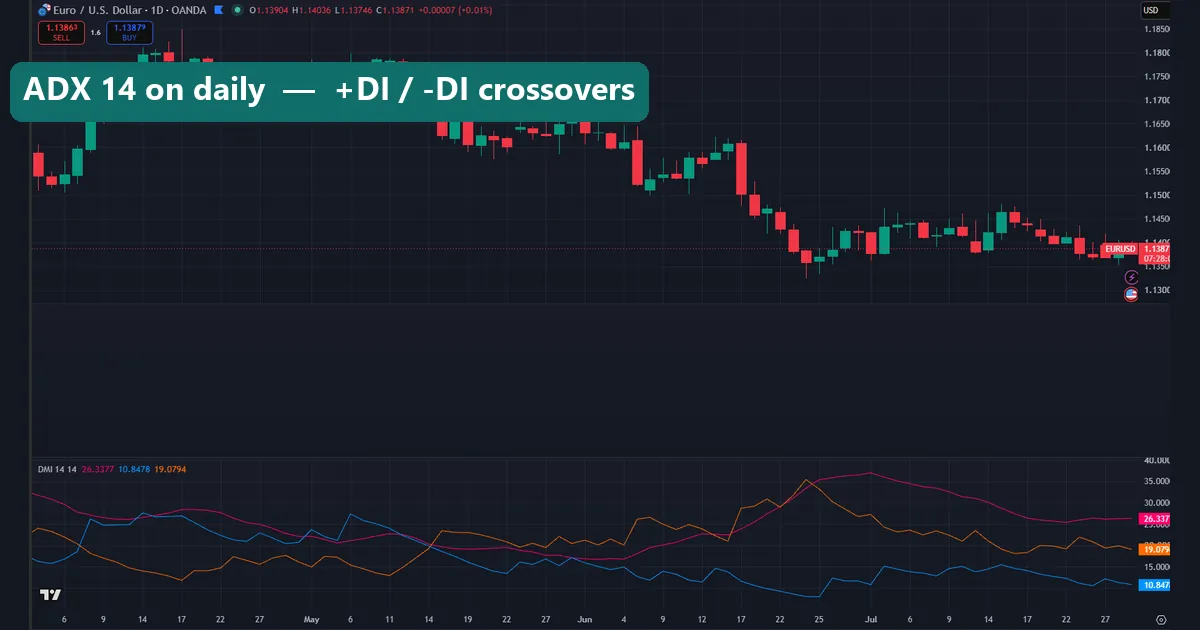
This is where the three lines work as a team. The ADX level confirms strength, while the DI crossover gives you the side. A classic long signal lines up two things: the +DI crosses above the −DI, and ADX sits above your threshold. The short signal mirrors it — the −DI crosses above the +DI while ADX holds above the threshold.
Skip the crossover when ADX is flat below 20. In that dead zone the DI lines whip back and forth, and most of those crosses lead nowhere. Wait for the ADX to confirm that a trend has real force, then take the DI crossover in that direction. On the chart above every clean signal shares one trait: a rising ADX behind the cross, not a falling one.
How to change ADX settings on MT4, MT5 and TradingView
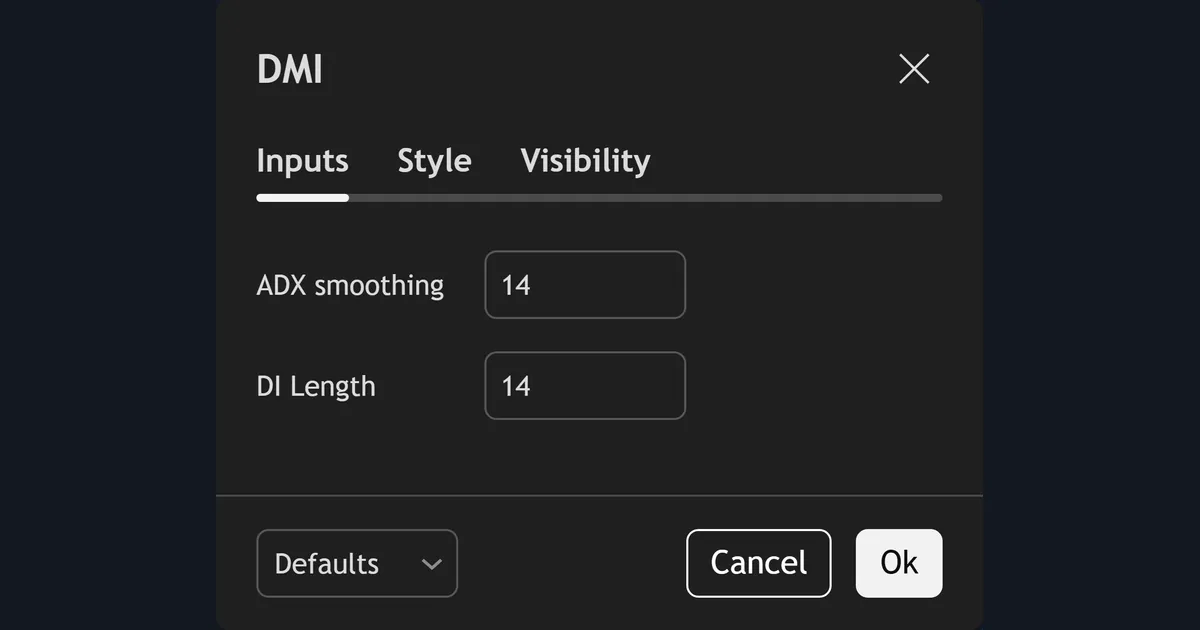
On MetaTrader the tool lives under Insert → Indicators → Trend → Average Directional Movement Index. In the dialog, Period is the length; set it to the value from the table and click OK. MT4 and MT5 use the same path and the same default of 14. On TradingView, add “Average Directional Index” from the indicators menu, open its settings gear, and edit the ADX Smoothing and DI Length fields. The full walkthrough with screenshots sits in the guide on how to install MT4 and MT5 indicators.
Download the complete indicator database
Put these concepts on your charts. One email unlocks the full library of 1,380+ indicators with compiled MT4 and MT5 files, plus my TradingView scripts. No paywall, no spam, unsubscribe any time.
Get free access to my indicator database
One email unlocks 1,380+ free MT4, MT5 and TradingView indicators — the complete library. No single-tool download; you get the whole database.
Common ADX settings mistakes
Three mistakes wreck most ADX setups. First, using ADX for direction. The line only measures strength, so a high reading during a downtrend is not a buy signal — check the DI lines for the side. Second, chasing a falling ADX. A value above 25 looks strong, but if the slope points down the trend is already losing steam, and fresh entries fade fast. Third, over-shortening the period. A length of 3 on any chart produces a frantic line that signals constantly and confirms nothing. Match the length to your timeframe first, keep the threshold near 20 to 25, and always read the slope before you act.
Where to go next
ADX works best alongside momentum and structure tools. See our roundup of the best forex indicators, the wider library of trend indicators, and the companion settings guides in our indicator settings hub. For the theory, Investopedia explains how the ADX works, and Wikipedia covers the underlying average directional movement index.
FAQ
What are the best ADX settings for day trading?
Shorten the length to 7 to 10 on M5 to M15 and treat 20 as your trend threshold. The faster line reacts in time for intraday moves, while a higher-timeframe trend keeps you filtering out the false starts.
What does an ADX reading above 25 mean?
It signals a trend with real strength behind it, up or down. Above 25 the odds favour trend-following entries. Below 20 the market is usually ranging, and trend signals tend to fail.
Does the ADX show trend direction?
No. ADX measures only trend strength. For direction you read the +DI and −DI lines that come with it: +DI on top means buyers lead, −DI on top means sellers lead.
What is the best ADX length for scalping?
Most scalpers drop to 5 to 7 on M1 to M5. That makes the line very responsive, so use it to confirm a breakout has force rather than to trigger the entry by itself.
Should I change the ADX period or the threshold?
Change the period first, since it controls how fast the line reacts to your timeframe. Leave the threshold near 20 to 25, and only adjust it if a backtest on your own pair clearly points to a better level.
Are these ADX settings guaranteed to work?
No. Settings only shape how the tool reads price; they do not predict it. Trading involves risk, results are not guaranteed, and past performance is not indicative of future results. Backtest any setting on a demo account before you trade it live.

About the author
Written by Dominic Walsh, a Forex trader and MT4/MT5 indicator, Expert Advisor and script developer. Every tool on forexmt4systems.com is tested on live charts before release and ships with ready-to-use compiled MT4 (.ex4) and MT5 (.ex5) files. Learn more about the trader and developer behind this site.
How we build, test and correct every tool: Editorial & Testing Policy. Trading carries risk; see the disclaimer.