
This one really does reach to a slower chart. The accumulation distribution mtf indicator builds its volume line on the chart its own input names, then maps each value down onto every bar you are watching. That is why the line draws as steps.
This build ships as a compiled .ex4 for MT4 and .ex5 for MT5; the screenshots below come from EURUSD H1.
| Platforms | MT4 (.ex4) + MT5 (.ex5) |
|---|---|
| Chart window | Separate window (levels 0) |
| Plots | 2: HTF A/D (step), HTF A/D signal |
| Alerts | popup, push notification, email, sound |
| Inputs | 18 |
What you get on the chart
Two plots, in a pane below price.
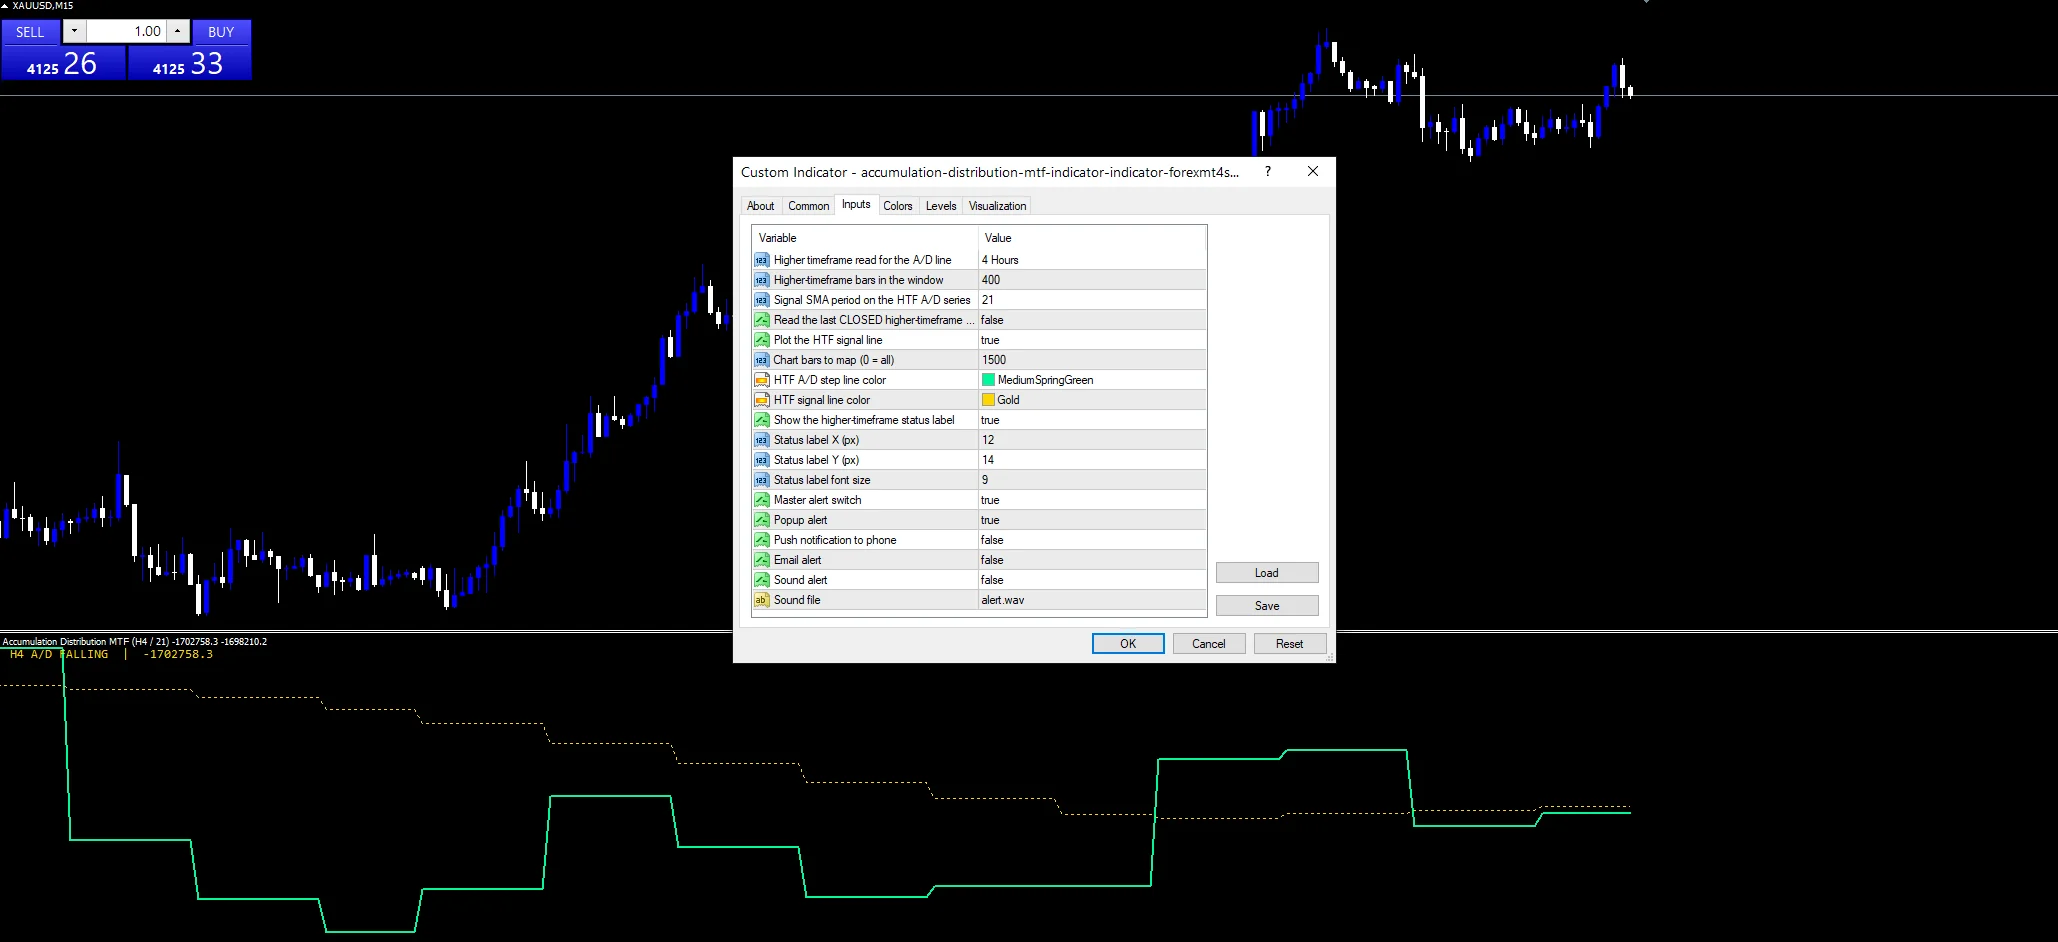
`HTF A/D (step)` traces medium spring green at width 2.
`HTF A/D signal` traces gold at width 1.
The main line steps rather than curving.
`ShowInfoLabel` prints a status line on the pane.
A reference sits at zero.
- HTF A/D (step): line, width 2
- HTF A/D signal: line, width 1

How the Accumulation Distribution Mtf Indicator calculates its values
Where each bar sits in its range
The close’s position between the high and the low sets a multiplier from minus one to plus one. Volume then gets weighted by it, and the results accumulate into one running total.
Reading the H4 chart
`SignalTimeframe` `PERIOD_H4` names the chart it reads. `HtfBars` `400` sets how many of those bars go into the window. Each value then carries across to the bars beneath it.
The signal line
`HtfSignalPeriod` `21` takes a mean of that total. Both series live on the slower chart, so a crossing you see there reflects H4 and not the chart in front of you.
What the states mean
Steps mark where a slower bar changed.
A rising total means closes near the highs.
Falling means closes near the lows.
Watch for the two lines crossing; that is the event.
`UseClosedHtfBar` `false` lets the newest step move.
`MaxBars` `1500` limits the mapping on your chart.
Alert channels in this build: popup, push notification, email and sound, one message per closed bar.
Here the slower total crossing its own mean is what speaks. `EnableAlerts` is the master switch and a popup is how it appears already. Phone, mail and the desktop clip behind `SoundFile` wait until you open them.
Every Accumulation Distribution Mtf Indicator input
Core settings
| Setting | What it does | Default |
|---|---|---|
SignalTimeframe |
Higher timeframe read for the A/D line. Chart the line is built on, `PERIOD_H4`. | PERIOD_H4 |
HtfBars |
Higher-timeframe bars in the window. Higher-timeframe bars in the window, `400`. | 400 |
HtfSignalPeriod |
Signal SMA period on the HTF A/D series. Average over that total, `21`. | 21 |
UseClosedHtfBar |
Read the last CLOSED higher-timeframe bar. Read only finished higher bars, `false`. | off |
Display settings
| Setting | What it does | Default |
|---|---|---|
ShowSignalLine |
Plot the HTF signal line. Draw the gold average, `true`. | on |
AdColor |
HTF A/D step line color. | medium spring green |
SignalColor |
HTF signal line color. | gold |
ShowInfoLabel |
Show the higher-timeframe status label. Print the status label, `true`. | on |
LabelX |
Status label X (px). | 12 |
LabelY |
Status label Y (px). | 14 |
LabelFontSize |
Status label font size. | 9 |
Alert settings
| Setting | What it does | Default |
|---|---|---|
MaxBars |
Chart bars to map (0 = all). Chart bars the mapping covers, `1500`. | 1500 |
EnableAlerts |
Master alert switch. Master switch on the higher-timeframe message, `true`. | on |
EnablePopup |
Popup alert. A popup is how it appears, `true`. | on |
EnablePushNotify |
Push notification to phone. | off |
EnableEmail |
Email alert. | off |
EnableSound |
Sound alert. | off |
SoundFile |
Sound file. Voiced from, `”alert.wav”`. | alert.wav |
Which timeframe to use
The pairing that makes sense is a fast chart under a slower reading. EURUSD H1 under the default H4 gives four chart bars per step. On M15 each step covers sixteen bars. Loading it on H4 itself removes the point entirely.
The honest limits
MetaTrader volume counts ticks, not contracts.
A running total drifts with how much history loaded.
Leaving the live slower bar on lets the last step move.
Steps can hide a turn that came mid-bar.
Copy the compiled Accumulation Distribution Mtf Indicator file into your MQL4/Indicators folder, and the MT5 build into MQL5/Indicators, then restart the terminal and drag it onto a chart. The step-by-step guide with screenshots is at how to install MT4 and MT5 indicators.
Download the Accumulation Distribution Mtf Indicator for MT4 and MT5
The zip holds the compiled Accumulation Distribution Mtf Indicator build for MT4 and MT5, plus a short README. Compiled files only, no source. Enter your email below and the download link arrives in your inbox.
Download this indicator free
Enter your email and the file is yours. You also get the full MT4 and MT5 library.
FAQ
Which chart does SignalTimeframe PERIOD_H4 pick?
The chart the whole sum runs on. Both the running total and its mean come from H4 bars, so a crossing reports an H4 event no matter which chart you happen to have open at the time.
Why does the HTF A/D (step) plot look like stairs?
Because one higher-timeframe value covers several bars of your chart. Every bar under the same H4 candle shows the same figure, and the line jumps only when a new H4 bar begins.
Should you switch UseClosedHtfBar on?
It depends on whether you mind the newest step moving. Left off, the live H4 bar updates and the last step can shift. Switch it on and you only ever see values from bars that finished.
What volume feeds the HTF A/D (step) line?
Tick volume, which counts price updates rather than contracts traded. On a spot forex chart that is the only volume available, so read the line as a measure of activity and not of size.
Are results guaranteed?
No. Trading involves risk. Results are not guaranteed; past performance is not indicative of future results. Use the Accumulation Distribution Mtf Indicator as one input. Always backtest before trading live.
Authoritative references
- Learn more about technical indicators.

About the author
Written by Dominic Walsh, a Forex trader and MT4/MT5 indicator, Expert Advisor and script developer. Every tool on forexmt4systems.com is tested on live charts before release and ships with ready-to-use compiled MT4 (.ex4) and MT5 (.ex5) files. Learn more about the trader and developer behind this site.
How we build, test and correct every tool: Editorial & Testing Policy. Trading carries risk; see the disclaimer.