
The chop zone indicator turns the slope of an average into a colour. It measures the angle of an EMA over InpEmaPeriod bars, in degrees, then sorts that angle into bands. The pane reads as a trend strength heat map rather than as a curve you follow.
This build ships as a compiled .ex4 for MT4 and .ex5 for MT5; the screenshots below come from EURUSD H1.
| Platforms | MT4 (.ex4) + MT5 (.ex5) |
|---|---|
| Chart window | Separate window (levels 0 / 5 / -5 / 18 / -18) |
| Plots | 8: Strong advance, Advance, Mild advance, Chop, Mild decline, Decline, Strong decline, EMA angle |
| Alerts | popup, push notification, email, sound |
| Inputs | 22 |
What you get on the chart
Seven zone buffers, from Strong advance through Chop to Strong decline, each covering its own angle band.
EMA angle carries the measured angle itself, so you can see the number behind the colour.
Levels cross the pane at 0, plus and minus 5.0 and plus and minus 18.0, matching the zone boundaries.
A corner panel reports the current reading when InpShowPanel stays on.
- Strong advance: histogram, turquoise, width 3
- Advance: histogram, forest green, width 3
- Mild advance: histogram, dark sea green, width 3
- Chop: histogram, gold, width 3
- Mild decline: histogram, sandy brown, width 3
- Decline: histogram, dark orange, width 3
- Strong decline: histogram, crimson, width 3
- EMA angle: line, white smoke, width 1
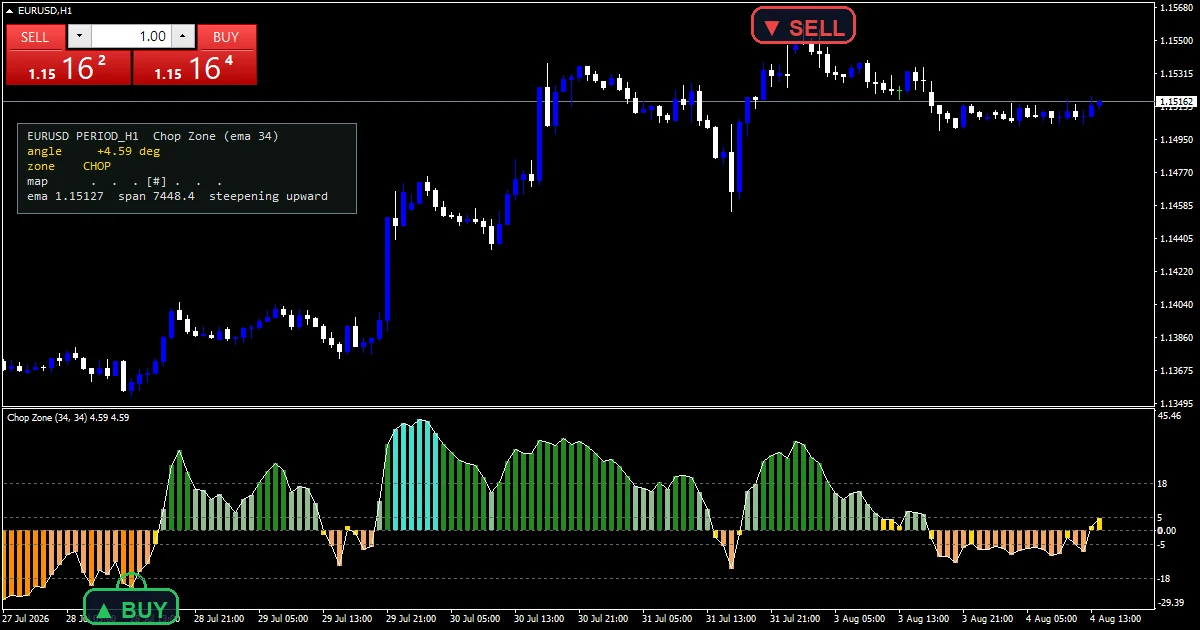
How a value appears
From slope to an angle
The code takes an EMA of the typical price on the current bar and on the bar before, giving a change per bar.
That change becomes an angle in degrees rather than a price difference. Working in degrees is what lets one set of zone boundaries apply to any instrument.
Scaling the vertical
An angle only means something once you fix how tall a bar is against how wide it is. The code uses the recent range over InpRangeBars together with InpSpanBox to set that scale.
Without it the same slope would read as a different angle on a volatile chart than on a quiet one, and the zones would stop being comparable.
Sorting into zones
InpZoneChop, InpZoneMid and InpZoneStrong set the three boundaries, at 5.0, 18.0 and 35.0 degrees. Each angle falls into exactly one band.
Only the buffer for the current band receives a value, which is what makes the pane a block of colour rather than overlapping lines.
What the states mean
Colour is the answer. A run of Chop means the average has been close to flat for those bars.
The boundaries are angles, so the same colour means the same steepness on any instrument.
The EMA angle line lets you see how close a reading sits to the next boundary.
This measures the slope of one average and nothing else, so it says nothing about direction beyond that slope.
Alert channels in this build: popup, push notification, email and sound, one message per closed bar.
Alerts cover popup, push, email and sound on a zone change. A bar time check keeps it to one alert per closed bar.
Every Chop Zone Indicator input
Core settings
| Setting | What it does | Default |
|---|---|---|
InpEmaPeriod |
EMA period on typical price. InpEmaPeriod is the average whose angle gets measured. It defaults to 34. | 34 |
InpRangeBars |
Bars used for the HH/LL span box. InpRangeBars is the window the vertical scale comes from, also 34. | 34 |
InpSpanBox |
Vertical box height the span maps onto. InpSpanBox sets how tall that range counts as, 25.0 by default, which fixes the aspect the angle is measured against. | 25.0 |
InpZoneChop |
|angle| below this is the yellow chop zone. InpZoneChop is the boundary below which the reading counts as flat, 5.0 degrees. | 5.0 |
InpZoneMid |
|angle| boundary between mild and full. InpZoneMid is the middle boundary at 18.0 degrees. | 18.0 |
InpZoneStrong |
|angle| above this is the strong zone. InpZoneStrong is the steep boundary at 35.0 degrees. | 35.0 |
InpMinBarDeg |
Minimum drawn bar height (degrees). InpMinBarDeg is the smallest angle change the reading responds to, 1.5 by default. | 1.5 |
InpX |
Panel X offset (px). | 14 |
InpY |
Panel Y offset (px) – clears one-click panel. | 120 |
Display settings
| Setting | What it does | Default |
|---|---|---|
InpShowPanel |
Show the zone panel. | on |
InpCorner |
Panel corner (0=UL 1=UR 2=LL 3=LR). | 0 |
InpFontSize |
Panel font size. | 9 |
InpFont |
Panel font. | Consolas |
InpPanelBg |
Panel background. | RGB 12,20,18 |
InpBorderColor |
Panel border. | slate gray |
InpTextColor |
Panel text. | gainsboro |
Alert settings
| Setting | What it does | Default |
|---|---|---|
EnableAlerts |
(see inputs panel) | on |
EnablePopup |
(see inputs panel) | on |
EnablePushNotify |
(see inputs panel) | off |
EnableEmail |
(see inputs panel) | off |
EnableSound |
(see inputs panel) | off |
SoundFile |
(see inputs panel) | alert.wav |
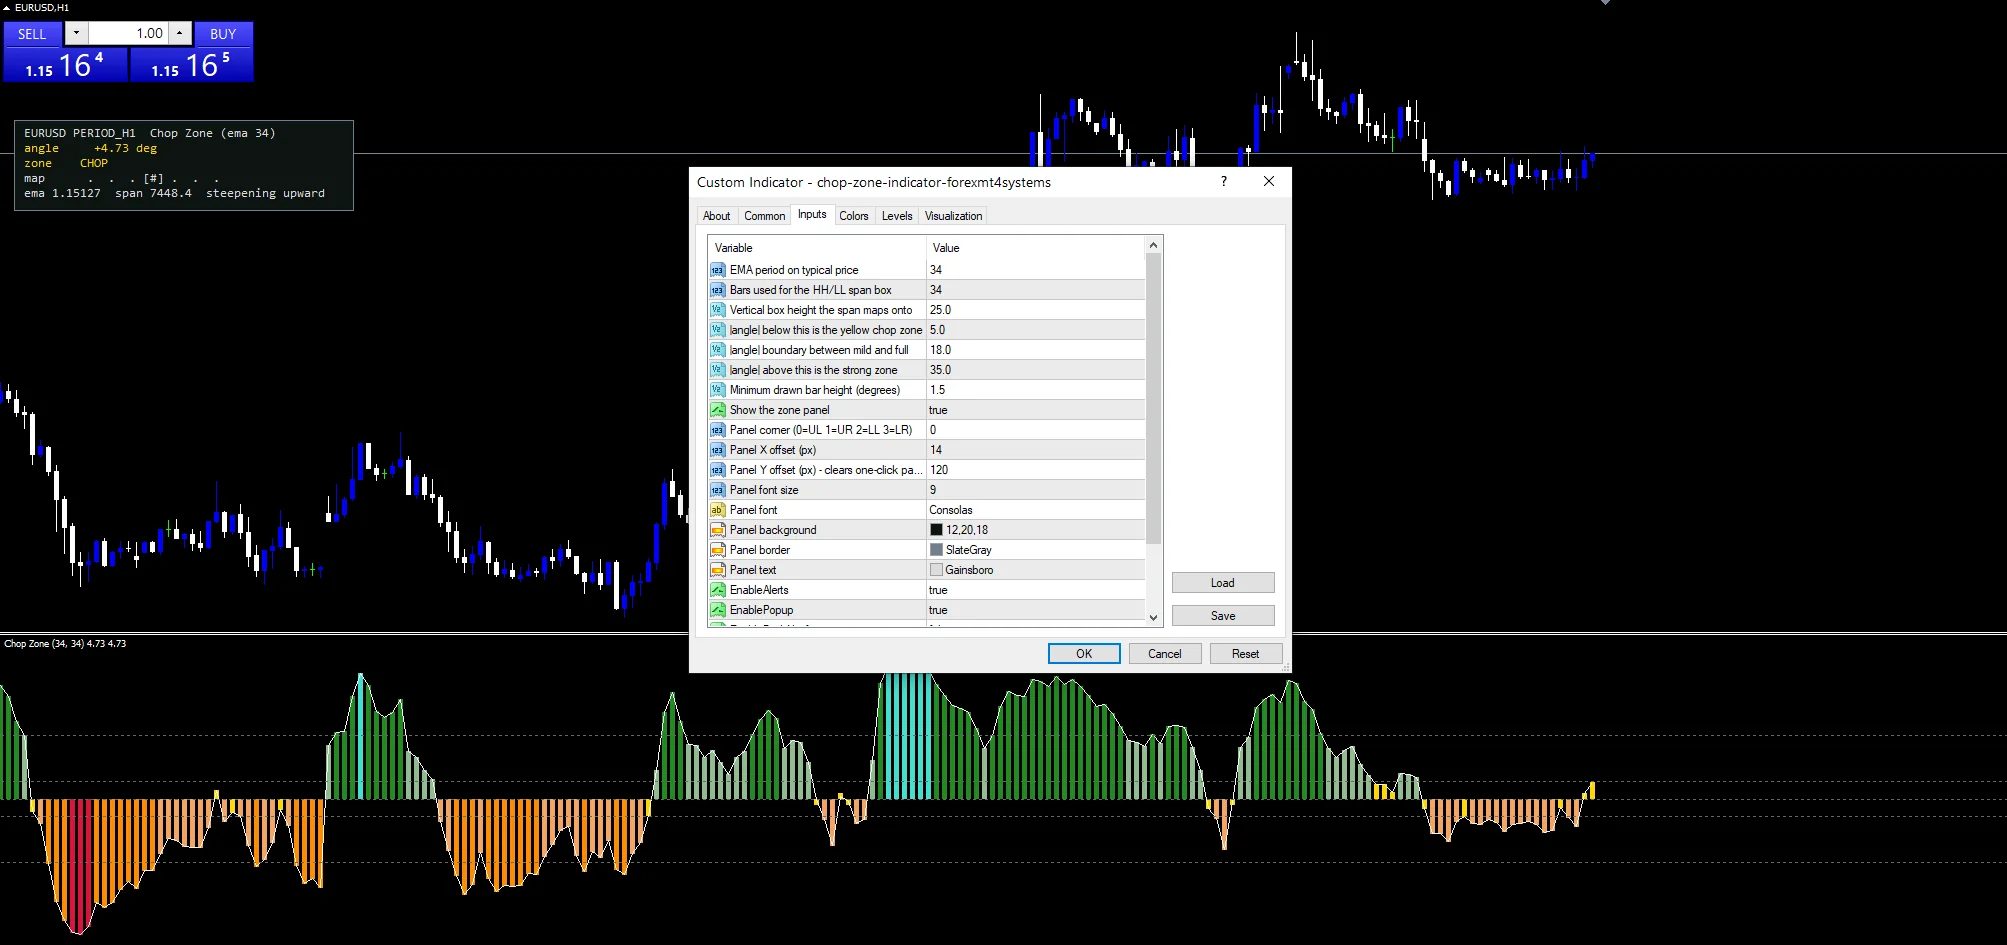
Choosing a timeframe
The screenshot uses EURUSD H1. Measuring an angle in degrees is what lets one set of boundaries cover different instruments, so the defaults travel. H1 and H4 give a reading that holds its zone for a stretch. On M1 the angle jumps between bands almost every bar.
Where the method fails
An angle depends on the vertical scale you choose. InpSpanBox is a convention rather than a market property, and changing it shifts every zone.
The reading describes one average slope. A market moving sideways in a wide range can still show a steep angle if the average happens to be travelling.
All seven zones come from one EMA, so this carries no more information than that average slope, only a clearer presentation of it.
Boundaries are fixed degrees, so a market that habitually trends steeply will sit in the strong zones far more than a quiet one.
Copy the compiled Chop Zone Indicator file into your MQL4/Indicators folder, and the MT5 build into MQL5/Indicators, then restart the terminal and drag it onto a chart. The step-by-step guide with screenshots is at how to install MT4 and MT5 indicators.
Background reading on the method behind the Chop Zone Indicator: Short-term European paper on Wikipedia, S And P 500 Sector And Industry Groups at StockCharts ChartSchool.
Download the Chop Zone Indicator for MT4 and MT5
The zip holds the compiled Chop Zone Indicator build for MT4 and MT5, plus a short README. Compiled files only, no source. Enter your email below and the download link arrives in your inbox.
Download this indicator free
Enter your email and the file is yours. You also get the full MT4 and MT5 library.
FAQ
Is this the same as the Choppiness Index?
No, and the two share only a word. The Choppiness Index measures path efficiency on a nought to one hundred scale. This measures the angle of an EMA in degrees and maps it onto colour zones. They answer different questions and their numbers are not comparable.
Why does InpSpanBox exist at all?
Because an angle needs a vertical scale. A slope only becomes an angle once you decide how tall a price move counts as against the bar width. InpSpanBox fixes that aspect at 25.0, which is what lets the same degree boundaries apply across instruments.
What separates Chop from Mild advance?
InpZoneChop, at 5.0 degrees. An angle below it in either direction falls into the flat band whatever its sign. Above it the reading moves into the mild band until it reaches InpZoneMid at 18.0 degrees. Each angle lands in exactly one zone.
Does the EMA angle line add anything over the colours?
It shows the number the colour came from. When a reading sits just under a boundary the colour tells you nothing about how close it is, and the line does. That matters most around InpZoneChop, where the difference between flat and trending gets decided.
Are results guaranteed?
No. Trading involves risk. Results are not guaranteed; past performance is not indicative of future results. Use the Chop Zone Indicator as one input. Always backtest before trading live.
External references
- Learn more about the underlying method in Short-term European paper on Wikipedia.
- For wider market background, see S And P 500 Sector And Industry Groups at StockCharts ChartSchool.

About the author
Written by Dominic Walsh, a Forex trader and MT4/MT5 indicator, Expert Advisor and script developer. Every tool on forexmt4systems.com is tested on live charts before release and ships with ready-to-use compiled MT4 (.ex4) and MT5 (.ex5) files. Learn more about the trader and developer behind this site.
How we build, test and correct every tool: Editorial & Testing Policy. Trading carries risk; see the disclaimer.