
The coral trend indicator is a T3 filter, not a moving average with a colour on it. Price passes through six identical single pole stages, and the last four get recombined with a fixed polynomial. Coral rising and Coral falling colour the result, with flip markers at each turn.
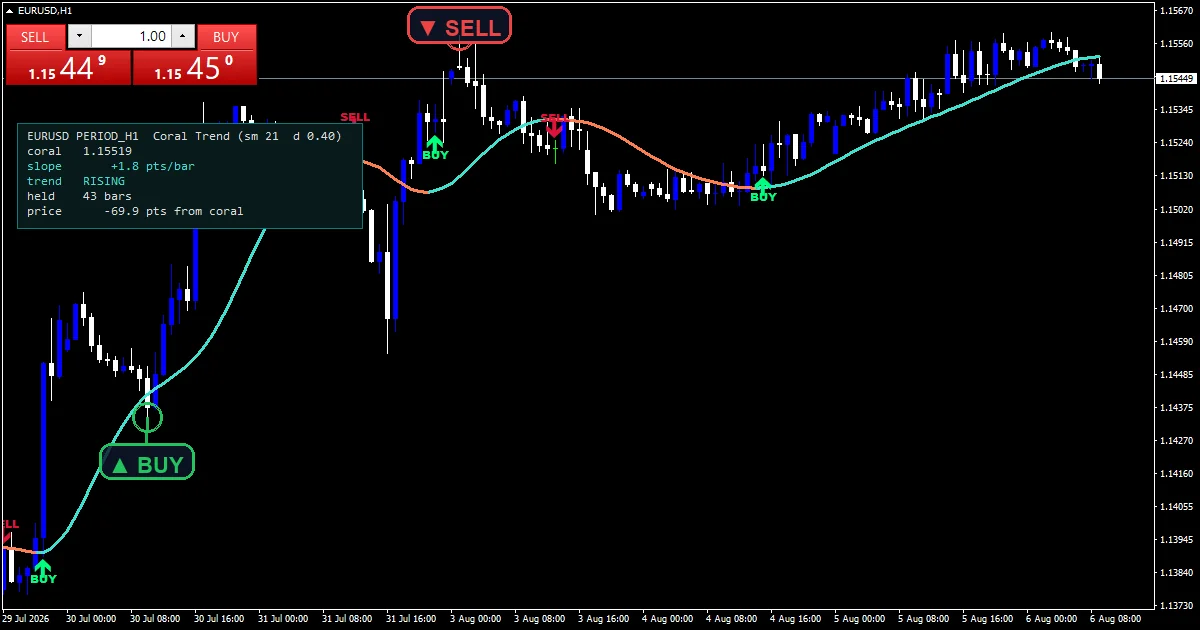
This build ships as a compiled .ex4 for MT4 and .ex5 for MT5; the screenshots below come from EURUSD H1.
| Platforms | MT4 (.ex4) + MT5 (.ex5) |
|---|---|
| Chart window | Main price chart |
| Plots | 4: Coral rising, Coral falling, Coral flip up, Coral flip down |
| Alerts | popup, push notification, email, sound |
| Inputs | 33 |
On the chart: plots and colours
Coral rising carries the line while it climbs against the previous bar.
The falling state hands the line to Coral falling instead.
Coral flip up marks the bar where the state changes upward.
A Coral flip down marker records the opposite turn.
Text and label objects tag recent flips when InpShowTags stays on.
- Coral rising: line, turquoise, width 3
- Coral falling: line, coral, width 3
- Coral flip up: arrow, spring green, width 2, arrow code 233
- Coral flip down: arrow, crimson, width 2, arrow code 234
The method
Six single pole stages
InpSmoothing converts into a smoothing constant, and each of the six stages applies that same constant to the output of the stage before it.
Stage one smooths price, stage two smooths stage one, and so on down the cascade. Six passes is what gives the filter its characteristic shape.
Recombining with the constant
Stages three through six get combined using a fixed polynomial in InpConstantD. The coefficients come from the published set and are implemented as written rather than approximated.
That recombination is the whole trick. It subtracts some of the lag the six stages introduced, which is why the result reacts faster than six plain averages would.
The colour state
Direction comes from comparing the value against the previous bar, with InpFlatPoints available as a dead band for markets that jitter.
Only the buffer matching the current state receives a value, so the line appears to change colour exactly where the state turns.
Reading it correctly
Colour is the state and a flip marker is the change.
This tracks price more closely than a plain average of the same length, because the recombination removes part of the cascade lag.
InpConstantD controls how aggressive that removal is, so it changes the character of the line rather than just its speed.
Six stages need history, so the left edge of a fresh chart carries nothing useful.
Alert channels in this build: popup, push notification, email and sound, one message per closed bar.
Alerts cover popup, push, email and sound on each flip. A bar time check keeps it to one alert per closed bar.
Every Coral Trend Indicator input
Core settings
| Setting | What it does | Default |
|---|---|---|
InpSmoothing |
Smoothing period sm (published default 21). InpSmoothing sets the period every stage of the cascade uses. It defaults to 21. | 21 |
InpConstantD |
Constant d (0.0 – 1.0, published default 0.4). InpConstantD is the constant in the recombination polynomial, on a scale from 0 to 1. It defaults to 0.4, and raising it makes the line more responsive and more prone to overshoot. | 0.4 |
InpAppliedPr |
Price: 0=close 1=open 2=high 3=low 4=median 5=typical 6=weighted. InpAppliedPr picks the price the cascade runs on, 0 by default for the close. | 0 |
InpFlatPoints |
Slope dead band (points per bar, 0 = published behaviour). InpFlatPoints is a dead band on the direction test, 0.0 by default so any change counts. | 0.0 |
InpTagBars |
Draw text tags over the last N bars. InpTagBars is how far back flip tags get written, 300 bars by default. | 300 |
InpTagGapPx |
Caption gap from the arrow, in PIXELS. | 38 |
InpMaxTags |
Hard cap on captions drawn at once. | 12 |
InpPriceScalePx |
Right margin owned by the price scale, in pixels. | 62 |
InpOneClickWpx |
Width of the one-click trade panel zone, top-left. | 260 |
InpOneClickHpx |
Height of the one-click trade panel zone, top-left. | 100 |
InpX |
Panel X offset (px). | 14 |
InpY |
Panel Y offset (px) – clears one-click panel. | 120 |
Display settings
| Setting | What it does | Default |
|---|---|---|
InpShowArrows |
Show trend-flip arrows. InpShowArrows draws the flip markers and defaults to true. | on |
InpArrowPad |
Arrow distance from the bar (points). InpArrowPad is the cosmetic gap between a flip marker and its candle, 30 points by default. | 30 |
InpShowTags |
Show BUY / SELL text next to the arrows. | on |
InpBuyColor |
BUY tag colour. | spring green |
InpSellColor |
SELL tag colour. | crimson |
InpCapFontSize |
Caption font size. | 9 |
InpLabelEdgePadPx |
Padding kept clear at the chart edges, in pixels. | 10 |
InpAvoidPanel |
Keep arrows and captions clear of the info panel. | on |
InpShowPanel |
Show the Coral readout panel. | on |
InpCorner |
Panel corner (0=UL 1=UR 2=LL 3=LR). | 0 |
InpFontSize |
Panel font size. | 9 |
InpFont |
Panel font. | Consolas |
InpPanelBg |
Panel background. | RGB 8,26,26 |
InpBorderColor |
Panel border. | teal |
InpTextColor |
Panel text. | gainsboro |
Alert settings
| Setting | What it does | Default |
|---|---|---|
EnableAlerts |
Master alert switch. | on |
EnablePopup |
Popup alert. | on |
EnablePushNotify |
Push notification to the mobile terminal. | off |
EnableEmail |
Email alert. | off |
EnableSound |
Play a sound file. | off |
SoundFile |
Sound file name. | alert.wav |
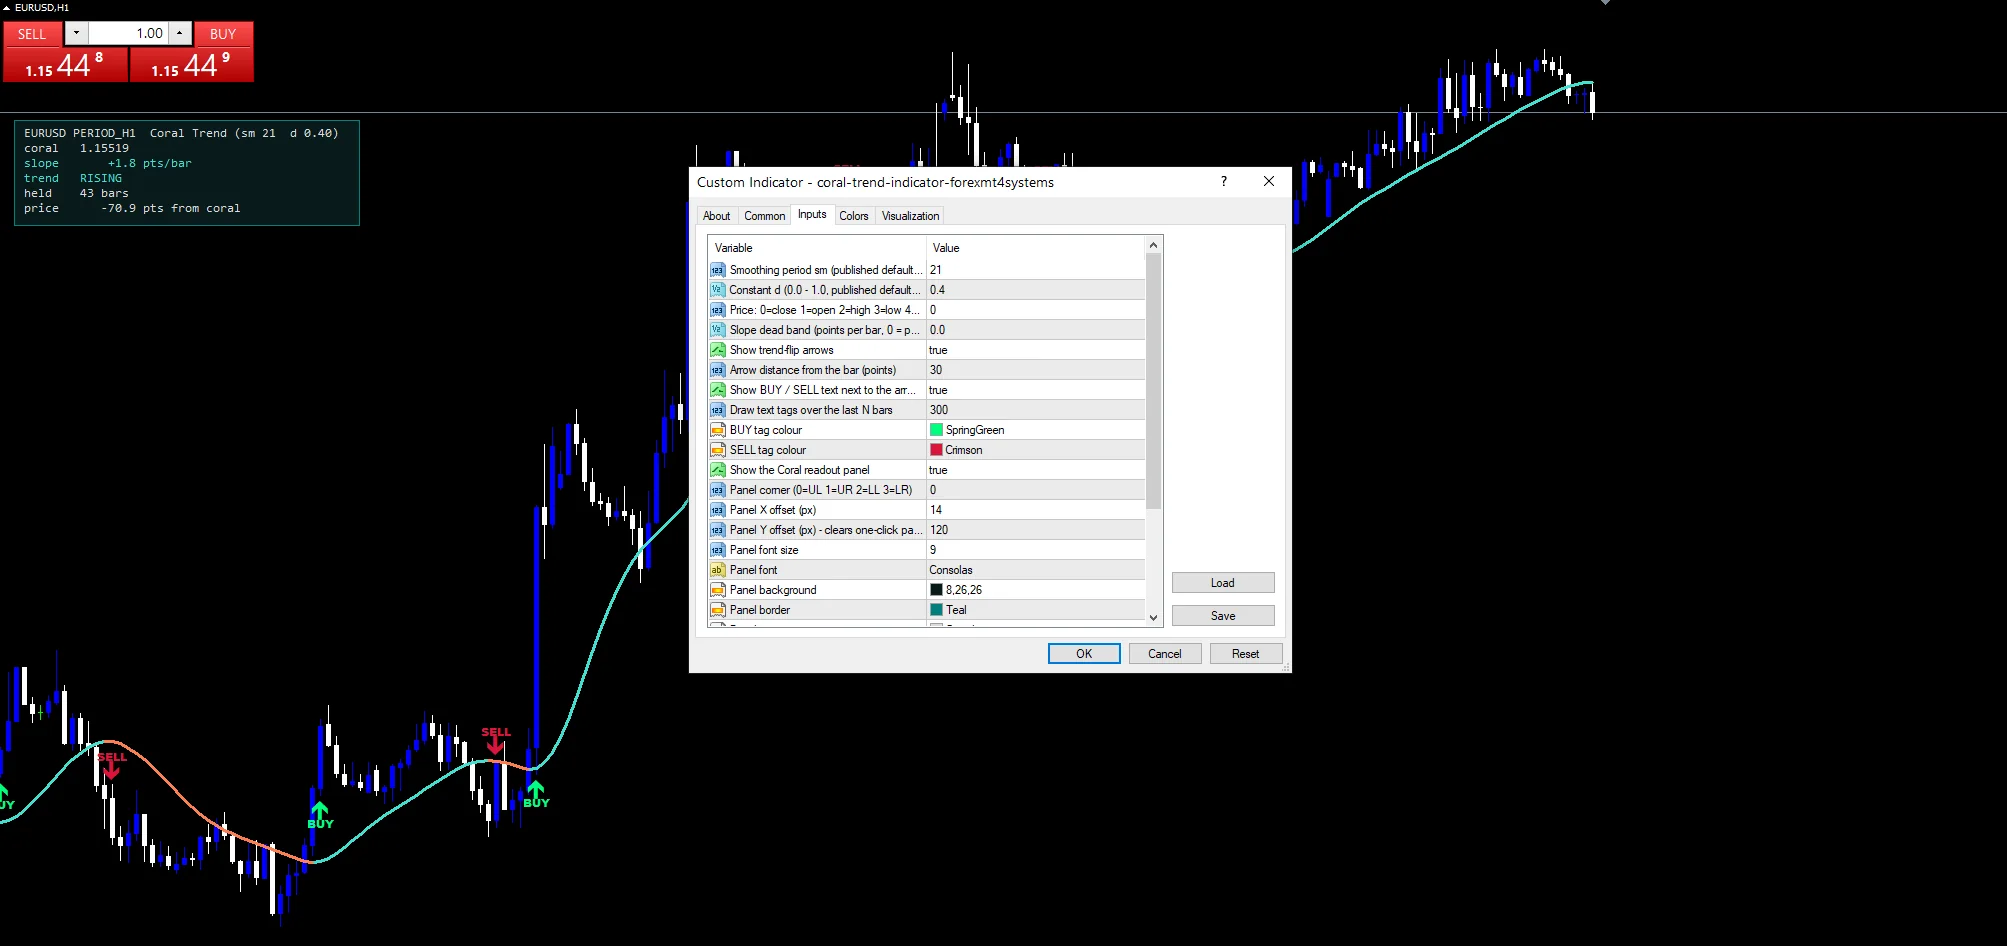
Chart and timeframe notes
The screenshot uses EURUSD H1. A 21 bar cascade on H1 gives a line that holds its state through ordinary pullbacks. On H4 and daily the flips become rare and each one covers a lot of ground. Below M15 the responsiveness that makes this filter attractive turns into frequent state changes.
Where it disappoints
Removing lag also amplifies overshoot. At a high InpConstantD the line can extend past a turn before settling back.
The direction test compares two bars with no threshold unless you set InpFlatPoints, so a one point change flips the state.
Six stages plus the recombination means a long warm up, and the earliest values on a fresh chart are unreliable.
A smoother line still lags. Faster than six plain averages is not the same as leading price.
Copy the compiled Coral Trend Indicator file into your MQL4/Indicators folder, and the MT5 build into MQL5/Indicators, then restart the terminal and drag it onto a chart. The step-by-step guide with screenshots is at how to install MT4 and MT5 indicators.
Related on forexmt4systems.com: Ichimoku Trend Strategy.
Download the Coral Trend Indicator for MT4 and MT5
The zip holds the compiled Coral Trend Indicator build for MT4 and MT5, plus a short README. Compiled files only, no source. Enter your email below and the download link arrives in your inbox.
Download this indicator free
Enter your email and the file is yours. You also get the full MT4 and MT5 library.
FAQ
Is the coral trend line just a triple EMA?
No. A triple EMA is three passes; this is six identical single pole stages, and the last four get recombined with a fixed polynomial in InpConstantD. That recombination step is what separates a T3 filter from any stack of plain averages, and it changes both the shape and the lag.
What does InpConstantD 0.4 actually control?
How much of the cascade lag the recombination subtracts back out. Near zero the result behaves much like the plain six stage cascade, slow and smooth. Raising it towards one makes the line far more responsive and more likely to overshoot a turn before settling.
When should I set InpFlatPoints above 0.0?
On a market that jitters enough to flip the state on meaningless changes. The direction test compares the current value against the previous bar with no threshold by default, so a single point of movement counts. A small dead band filters those out.
Why does Coral rising need so much history before it appears?
Every stage of the cascade feeds the next, so stage six cannot produce a trustworthy value until all the earlier stages have settled. With InpSmoothing at 21 across six stages, that takes a considerable stretch of bars before the line means anything.
Are results guaranteed?
No. Trading involves risk. Results are not guaranteed; past performance is not indicative of future results. Use the Coral Trend Indicator as one input. Always backtest before trading live.
External references
- The core method is documented in Swap rate on Wikipedia.
- Additional market context is at Advance Decline Line at StockCharts ChartSchool.

About the author
Written by Dominic Walsh, a Forex trader and MT4/MT5 indicator, Expert Advisor and script developer. Every tool on forexmt4systems.com is tested on live charts before release and ships with ready-to-use compiled MT4 (.ex4) and MT5 (.ex5) files. Learn more about the trader and developer behind this site.
How we build, test and correct every tool: Editorial & Testing Policy. Trading carries risk; see the disclaimer.