
The ICT fibonacci settings question comes up because the levels ICT traders use are not the ones your platform ships with by default. The standard tool draws 23.6, 38.2, 50, 61.8 and 78.6. The ICT version drops some, adds others, and treats one band as the only zone that matters. This guide covers the exact levels, how to configure them in MetaTrader and TradingView, and what the settings do and do not change.

The levels ICT traders use
The core idea is that a retracement into the upper half of a move is where institutional entries cluster. Everything else on the default tool is noise for this purpose.
| Level | Name in the method | Role |
|---|---|---|
| 0.0 | Swing start | Anchor of the measured move |
| 0.5 | Equilibrium | Upper edge of the entry band |
| 0.618 | Optimal trade entry | The level most quoted |
| 0.705 | Mean threshold | Midpoint of the entry band |
| 0.79 | Deep entry | Lower edge of the entry band |
| 1.0 | Swing end | Where the retracement invalidates |
| -0.5 / -1.0 | Projections | Targets beyond the swing |
The band between 0.5 and 0.79 is the zone. Practitioners call it the optimal trade entry, and it is simply the deeper half of any pullback rather than a precise price.
Note the two additions to the standard set. 0.705 sits between 0.618 and 0.79 as the middle of the band. 0.79 replaces the conventional 0.786 for no reason more principled than convention within the method.
Configuring the ICT fibonacci settings in MetaTrader
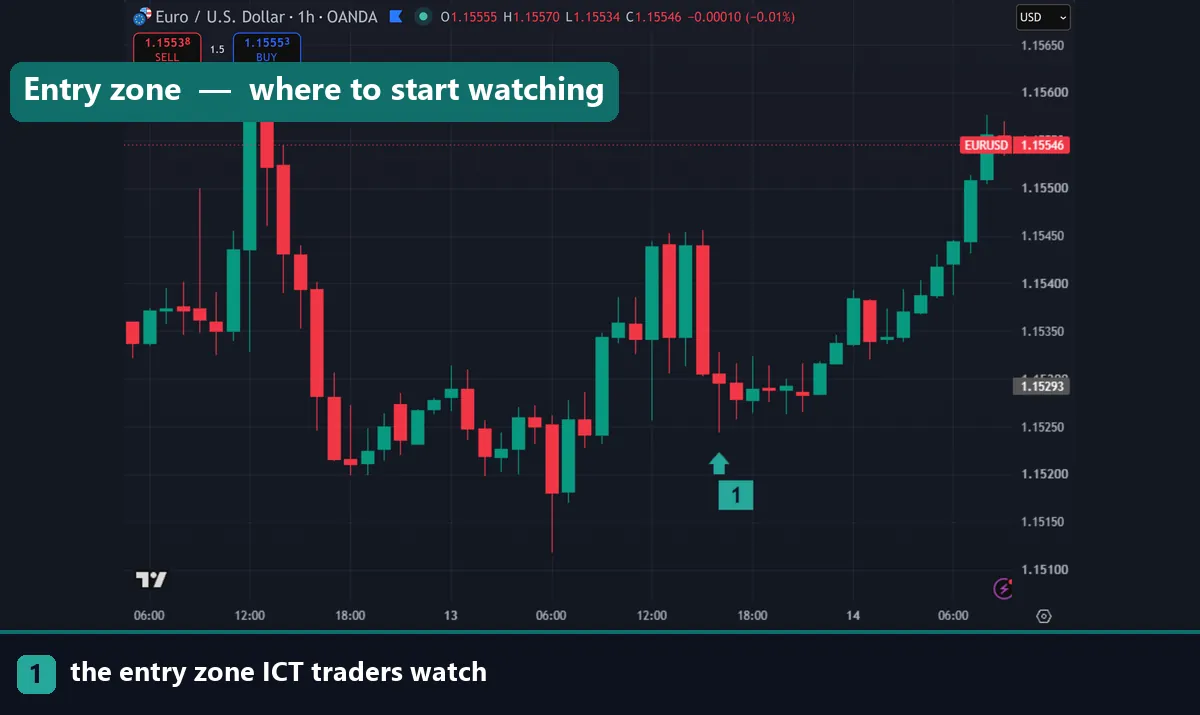
MT4 and MT5 both let you edit the level list, and the process is the same on either.
Draw a retracement from any swing, then double-click the tool and open its properties. The Fibo Levels tab lists each level with a description field.
Delete the levels you do not want, then add 0.5, 0.618, 0.705, 0.79 and 1.0. Use the description field for labels, since %$ prints the price at each level next to its name.
Before closing, open the Common tab and tick “Draw object as background” so the levels sit behind the candles. Then save the whole configuration as a template, or you will be repeating this every time.
Our fib retracement tool guide covers the mechanics of drawing the tool itself.
Configuring it in TradingView
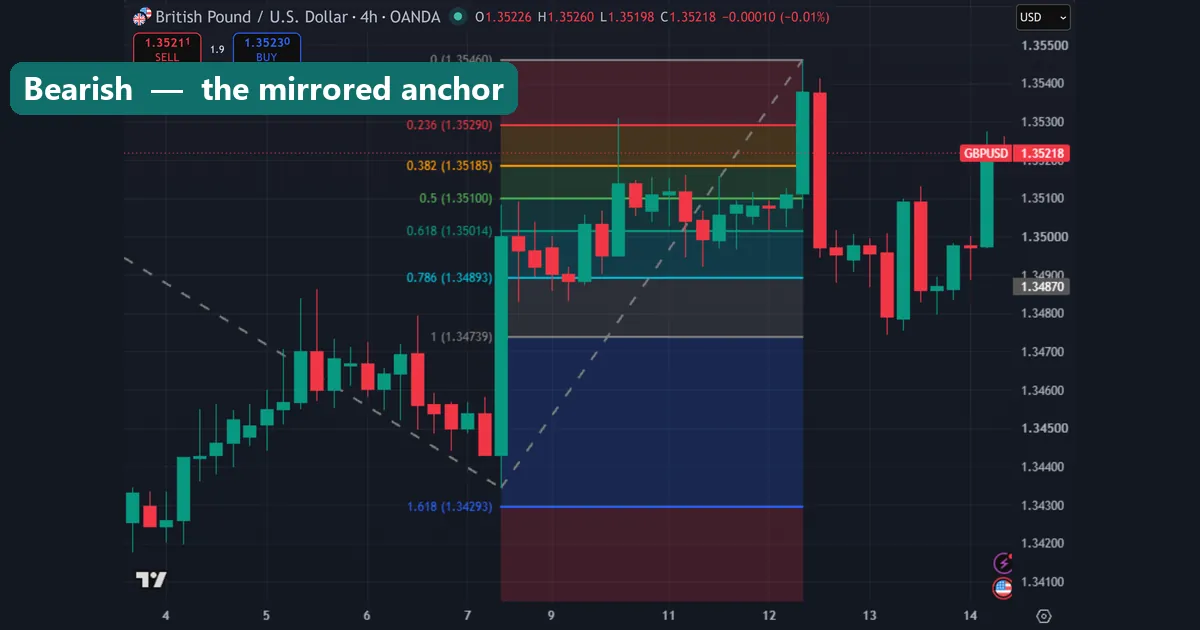
TradingView makes this easier and lets you keep the result as a default.
Add a Fib Retracement, open its settings, and use the Levels tab. Untick the levels you do not need, then edit the remaining values directly and add rows for 0.705 and 0.79.
Two extras are worth setting. Extend lines right keeps the levels visible as price moves away, and shading between 0.5 and 0.79 makes the band read as a zone rather than three separate lines.
Save it with the “Default” option in the settings menu, and every future retracement uses your configuration.
Where you anchor it

This matters far more than the level list, and it is where most of the disagreement between traders actually lives.
The method anchors from a displacement leg: a strong directional move that breaks structure, ideally one that left a gap in the candles behind it. Not any swing high to any swing low.
On a bullish setup, anchor 0 at the low of the leg and 1 at the high. Price retracing into 0.5 to 0.79 is the setup. On a bearish one, reverse it.
Two anchoring errors account for most bad results. Using a weak swing that never broke structure produces levels with no meaning. Redrawing the tool after price moves so it fits the outcome produces a chart that always looks correct in hindsight and never helped in advance.
Our ICT trading strategy guide covers identifying displacement.
Download the complete indicator database
Put these concepts on your charts. One email unlocks the full library of 1,380+ indicators with compiled MT4 and MT5 files, plus my TradingView scripts. No paywall, no spam, unsubscribe any time.
Get free access to my indicator database
One email unlocks 1,380+ free MT4, MT5 and TradingView indicators — the complete library. No single-tool download; you get the whole database.
What the settings do not fix

Worth stating plainly, because configuration is the easy part.
The levels are arithmetic. Half of a move is half of a move whatever you call it, and 0.618 has no special property beyond the fact that many traders watch it. Self-fulfilling behaviour around a widely-watched level is real, and it is not the same as a mathematical law.
Adding 0.705 does not add precision. It names the middle of a band you had already drawn, which is a labelling choice rather than new information.
A retracement tool also has no opinion on whether the trend continues. Price reaching your zone is not a signal, and practitioners wait for a reaction there — a rejection candle, a lower-timeframe structure break — before acting.
Treat the zone as a place to start paying attention. Our fib golden zone guide covers the same band from the conventional angle.
Common mistakes
Four repeat. Anchoring to a weak swing rather than a displacement leg tops the list. Redrawing the tool until it fits what price already did comes second, which produces a flattering chart and no edge. Third, traders enter at 0.618 automatically with no reaction to confirm it. Fourth, they configure the levels and skip the template, then rebuild the same settings every session.
Where to go next
Settings are the smallest part of this. Read our ICT trading strategy guide for the framework, then how to use the fib retracement tool for anchoring. For the same band without the ICT vocabulary, see the fib golden zone, and Fibonacci indicators for MT4 plots the levels automatically. For further reading, the golden ratio article on Wikipedia covers where 0.618 comes from, and Investopedia explains Fibonacci retracement at Investopedia.
FAQ
What Fibonacci levels does the ICT method use?
0.5, 0.618, 0.705 and 0.79, plus 0 and 1 as anchors and negative projections for targets. The band from 0.5 to 0.79 is treated as the entry zone.
What is the 0.705 level?
The midpoint between 0.618 and 0.79, sitting in the middle of the entry band. It is a labelling convention within the method rather than a standard Fibonacci ratio.
How do I set these levels in MT4?
Draw a retracement, double-click it, then edit the list on the Fibo Levels tab. Save the result as a template so the configuration carries across charts.
Where should I anchor the tool?
On a displacement leg that broke market structure, from the start of the move to its end. Anchoring to a weak swing produces levels with nothing behind them.
Is 0.79 the same as 0.786?
Effectively yes. The conventional level is 0.786, the square root of 0.618, and the method rounds it. On most charts the difference is invisible.
Do these settings improve results?
They change what you see, not what price does, and the zone marks where to look rather than when to enter. Trading involves risk, results are not guaranteed, and past performance is not indicative of future results.

About the author
Written by Dominic Walsh, a Forex trader and MT4/MT5 indicator, Expert Advisor and script developer. Every tool on forexmt4systems.com is tested on live charts before release and ships with ready-to-use compiled MT4 (.ex4) and MT5 (.ex5) files. Learn more about the trader and developer behind this site.
How we build, test and correct every tool: Editorial & Testing Policy. Trading carries risk; see the disclaimer.