
Heavy volume with almost no price movement is a message. Also, someone large sat on the other side. Absorption Detector, a free volume absorption indicator TradingView traders can apply to any chart, hunts exactly those bars. Indeed, it demands volume at twice its 20-bar average, a contained range, and a candle shape that shows rejection. It then sorts each hit into passive, aggressive or exhaustion absorption and scores it from one to five.
It is free and open source. Still, you can add it to any chart from the Absorption Detector script page on TradingView, and the full Pine source is published there for you to read.
What Absorption Detector plots on the price chart
Every detected bar gets a label reading the type code and its intensity, such as EXH Bull 5/5. Thus, blue marks passive absorption, orange marks aggressive, purple marks exhaustion. A dotted zone box wraps the bar high to low and extends 20 bars right, fading with lower intensity. Qualifying bars recolor. BUY and SELL tags print when intensity clears your minimum. Hence, grey dots flag volume spikes that failed the shape tests. A ten-row dashboard tracks type counts, direction counts, live body and wick percentages and the last detection.
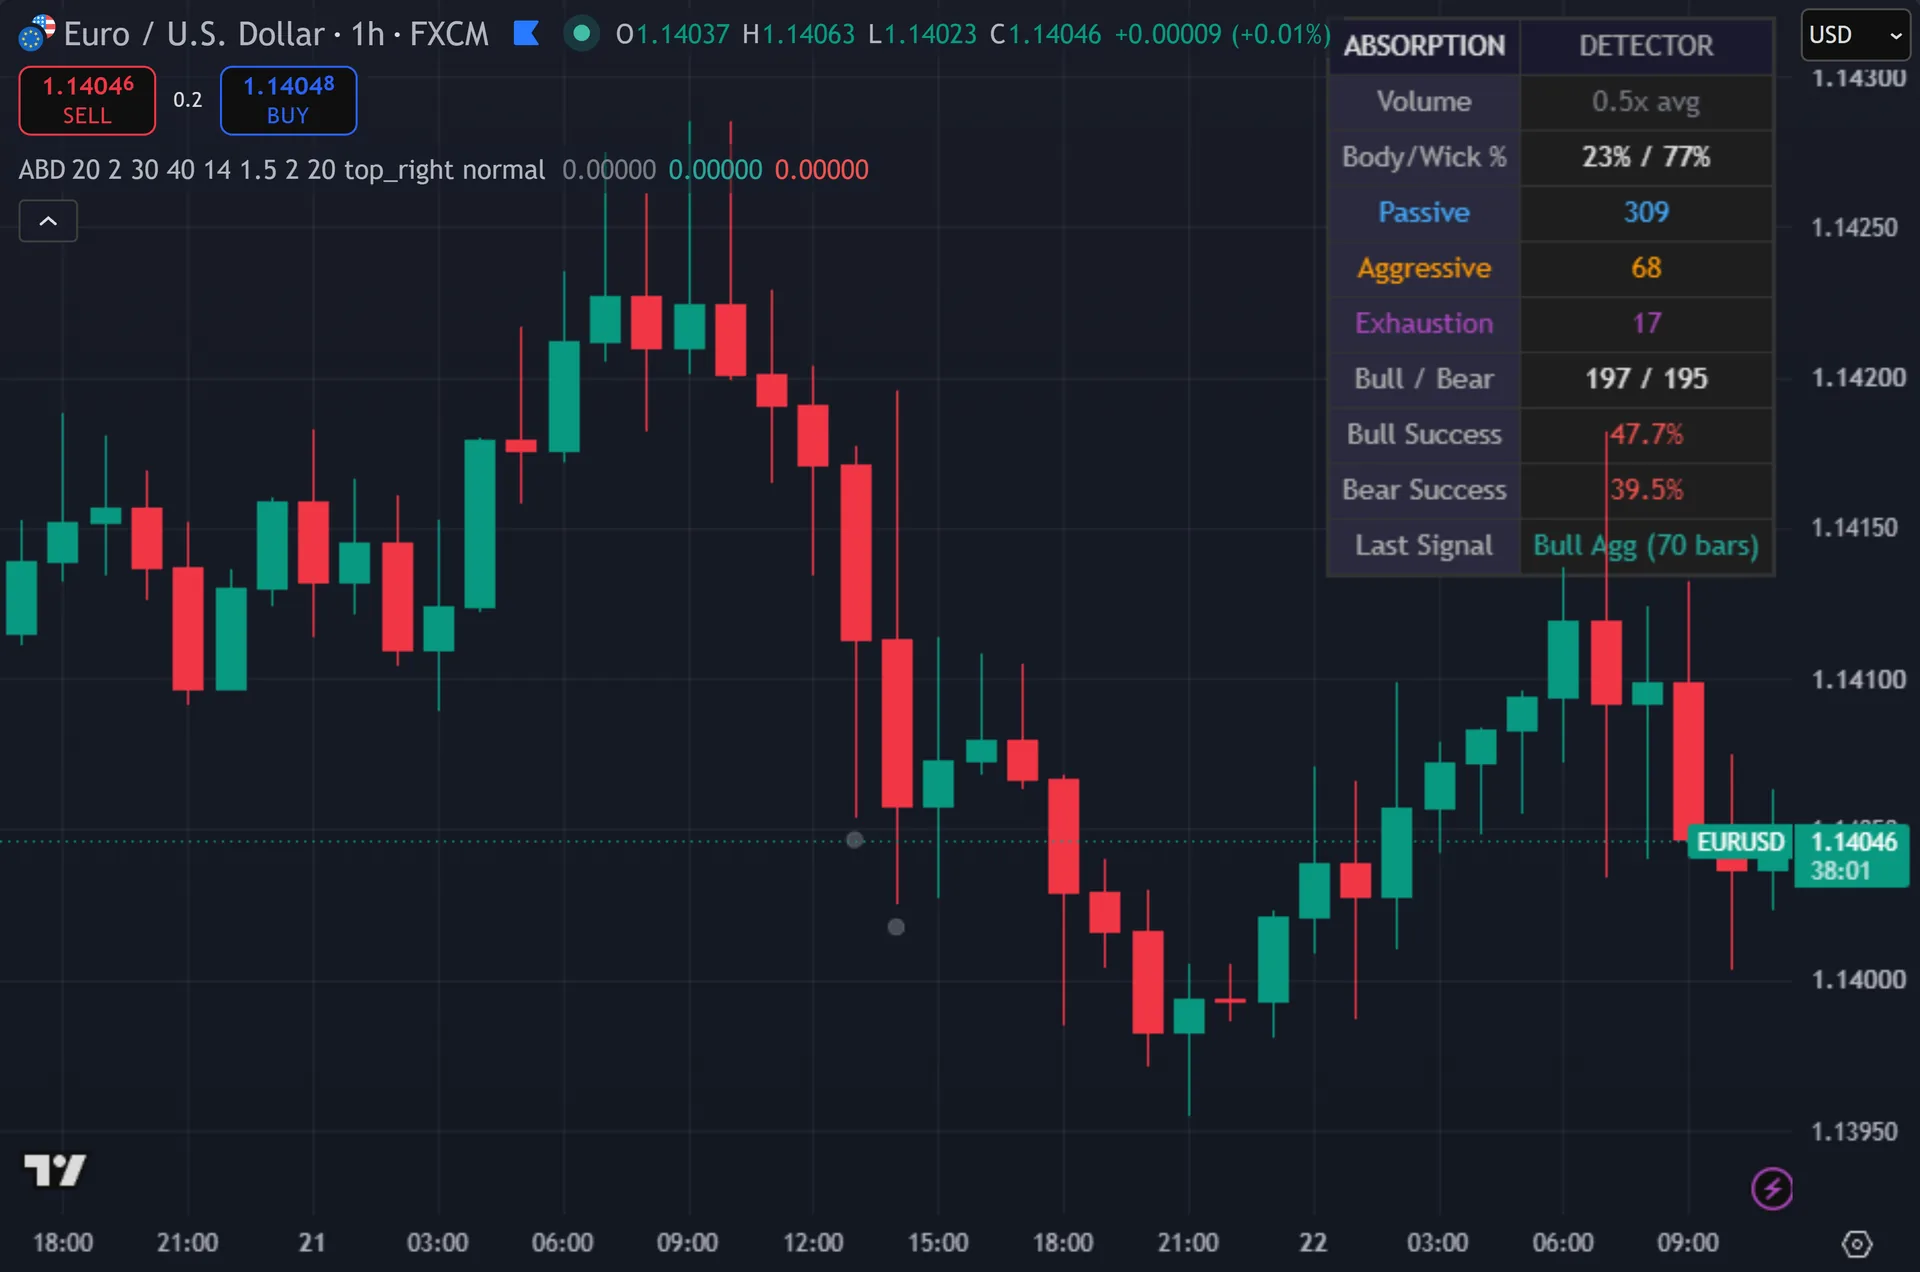
How Absorption Detector is built
Two gates, then three types
Every candidate bar passes two gates first. Next, volume must exceed its 20-bar average multiplied by 2.0. The bar range must stay at or under 1.5 times ATR(14). Then, that pairing is the whole idea: unusual participation, ordinary movement. A wide-range bar on huge volume is a breakout, not absorption, and the range gate rejects it.
Passive absorption then needs shape. Yet, the body must sit at or under 30 percent of the range, and the wicks must make up at least 40 percent. Price probed, then came back. Truly, aggressive absorption takes a different route. It needs a full engulfing bar over the previous candle on that same high volume, which reads as one side defending a level in the open.
Exhaustion absorption sets a higher bar. Plainly, volume must beat 3.0 times average, since the script multiplies your spike setting by 1.5. One wick must also dominate, taking more than 60 percent of total wick, with wicks at 50 percent of range or more. Also, when several types match, exhaustion wins, then aggressive, then passive.
Scoring and direction
Intensity starts from raw volume. Indeed, four times average or more scores three. Three times scores two. Anything else scores one. Wick dominance above 75 percent adds a point. The exhaustion type adds another. The total caps at five, and the label prints it as a fraction.
Direction comes from the wicks. Still, a lower wick larger than the upper wick means buyers absorbed the selling, so the bar reads bullish. The reverse reads bearish. Engulfing direction counts too. BUY and SELL tags then require intensity at or above your Min Intensity setting, which starts at two.
The dashboard tracks outcomes in a simple way. Thus, when a bullish absorption prints, the script stores the close and checks it exactly ten bars later. A higher close counts as a hit, and the panel reports those hits as a percentage. Hence, treat that figure as rough context only, never as a performance record. The limitations below explain why it reads low.
How to read the signals
Start with the type. Next, passive absorption is quiet defence, often at a level price has respected before. Aggressive absorption is a fight in the open, and the engulfing shape shows who took control. Then, exhaustion is the rarest and needs the heaviest volume, so it carries the most weight of the three.
Then read intensity. Yet, a 2 out of 5 means the bar barely cleared the thresholds. A 5 means huge volume, a dominant rejection wick and exhaustion conditions all at once. Truly, raise Min Intensity to 3 or 4 and the chart quiets down fast.
Location decides everything. Plainly, an absorption bar at a prior swing low, a range edge or a session high says something. The same bar mid-range says very little. Also, the zone box helps here, since it holds the bar high and low on screen for 20 bars so you can watch whether price respects it.
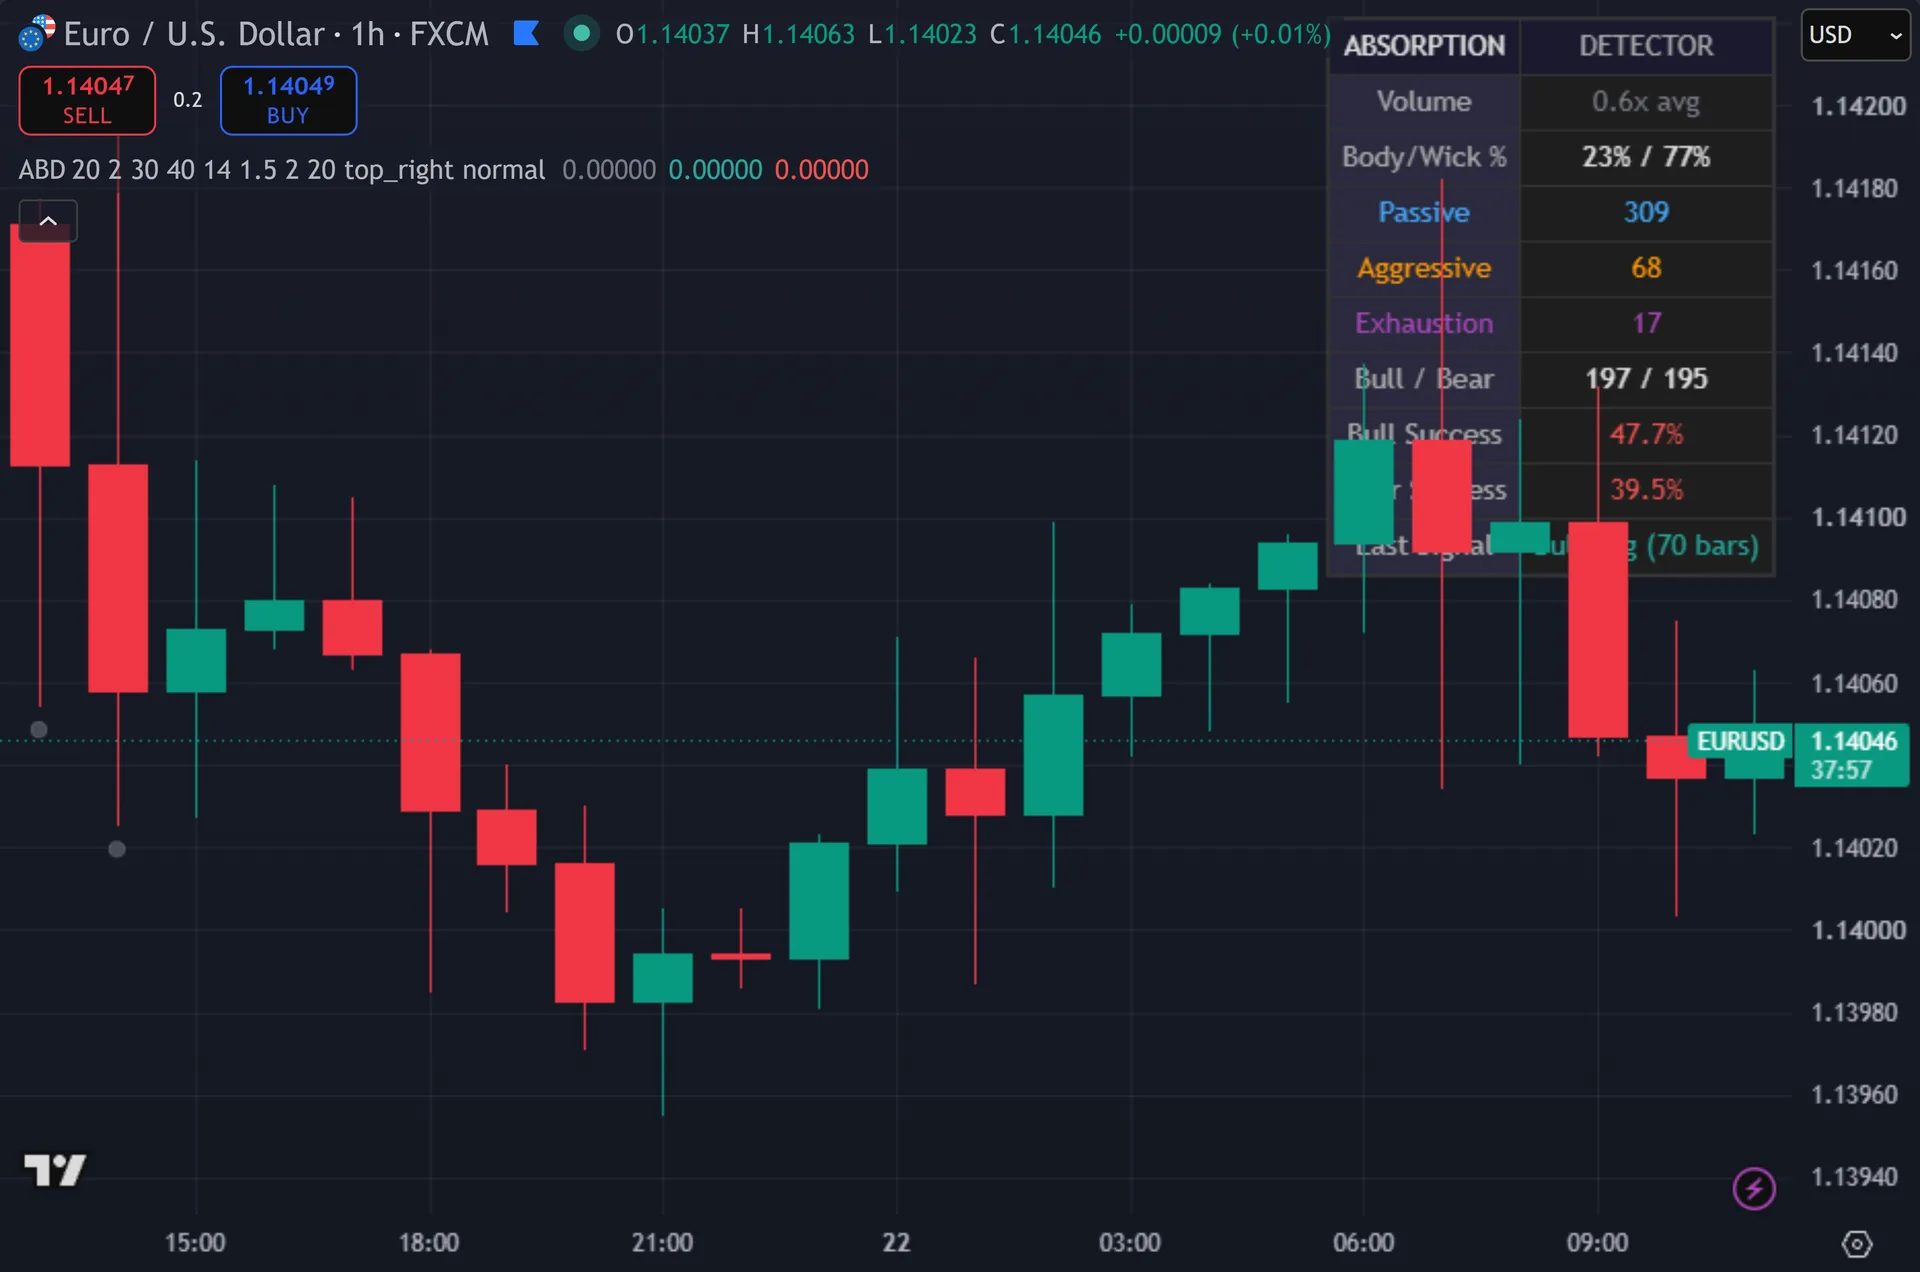
Every Absorption Detector setting explained
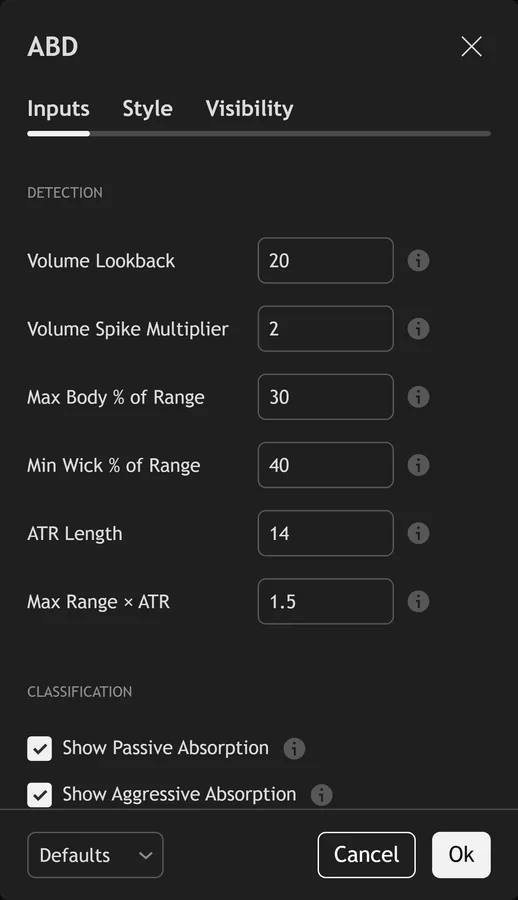
The script exposes 22 inputs, grouped in the settings panel exactly as shown below. Defaults are the published values.
Detection
| Setting | What it does | Default | Range |
|---|---|---|---|
| Volume Lookback | Period for calculating average volume | 20 | 5 to 100 |
| Volume Spike Multiplier | Volume must exceed average × this to qualify as a spike | 2.0 | 1.0 to 5.0 |
| Max Body % of Range | Maximum body-to-range ratio — absorption bars have small bodies relative to range | 30.0 | 5.0 to 60.0 |
| Min Wick % of Range | Minimum total wick percentage — absorption bars have large wicks showing rejection | 40.0 | 10.0 to 80.0 |
| ATR Length | ATR period for range normalization | 14 | 5 to 50 |
| Max Range × ATR | Bar range must not exceed ATR × this — absorption = contained range despite volume | 1.5 | 0.5 to 3.0 |
Classification
| Setting | What it does | Default | Range |
|---|---|---|---|
| Show Passive Absorption | Small body, big wicks — orders quietly absorbed | on | on / off |
| Show Aggressive Absorption | Engulfing pattern with high volume — aggressive defense of level | on | on / off |
| Show Exhaustion Absorption | Volume climax with reversal wick — final push absorbed | on | on / off |
Signals
| Setting | What it does | Default | Range |
|---|---|---|---|
| Show BUY/SELL Signals | Directional signals based on absorption type and wick direction | on | on / off |
| Min Intensity for Signals | Minimum intensity score (1-5) to trigger BUY/SELL | 2 | 1 to 5 |
| Show Absorption Zones | Draw zones around absorption bars | on | on / off |
| Zone Extension (bars) | How far right absorption zones extend | 20 | 5 to 100 |
Display
| Setting | What it does | Default | Range |
|---|---|---|---|
| Show Dashboard | Toggles show dashboard on the chart. | on | on / off |
| Show Volume Dots | Small dots marking high-volume bars | on | on / off |
| Dashboard Position | Choose the dashboard position from the listed options. | top_right | top_left, top_center, top_right, bottom_left, bottom_center, bottom_right |
| Text Size | Choose the text size from the listed options. | normal | tiny, small, normal, large |
Colors
| Setting | What it does | Default | Range |
|---|---|---|---|
| Bullish Absorption | Colour used for bullish absorption. | #26A69A | |
| Bearish Absorption | Colour used for bearish absorption. | #EF5350 | |
| Passive | Colour used for passive. | #42A5F5 | |
| Aggressive | Colour used for aggressive. | #FF9800 | |
| Exhaustion | Colour used for exhaustion. | #AB47BC |
Alerts built into Absorption Detector
The script ships 7 alert conditions. Indeed, open the alert dialog on the chart, pick the indicator as the condition source, then choose the event you want. Alerts fire on the close of the bar, so they follow the same confirmed-bar rule the on-chart signals use.
- Bullish Passive Absorption
- Bearish Passive Absorption
- Bullish Aggressive Absorption
- Bearish Aggressive Absorption
- Exhaustion Absorption
- Buy Signal
- Sell Signal
Other markets and timeframes
Every threshold stays relative, so the defaults travel between markets without changes. Still, volume runs against its own average, range runs against ATR, and body and wick both run as a percentage of range. The volume source is the honest caveat. Thus, spot forex charts show broker tick volume, which counts price updates rather than contracts. Absorption reads best where volume reflects real traded size, so futures, stocks and crypto suit it best. Hence, Forex still works as a relative activity measure.
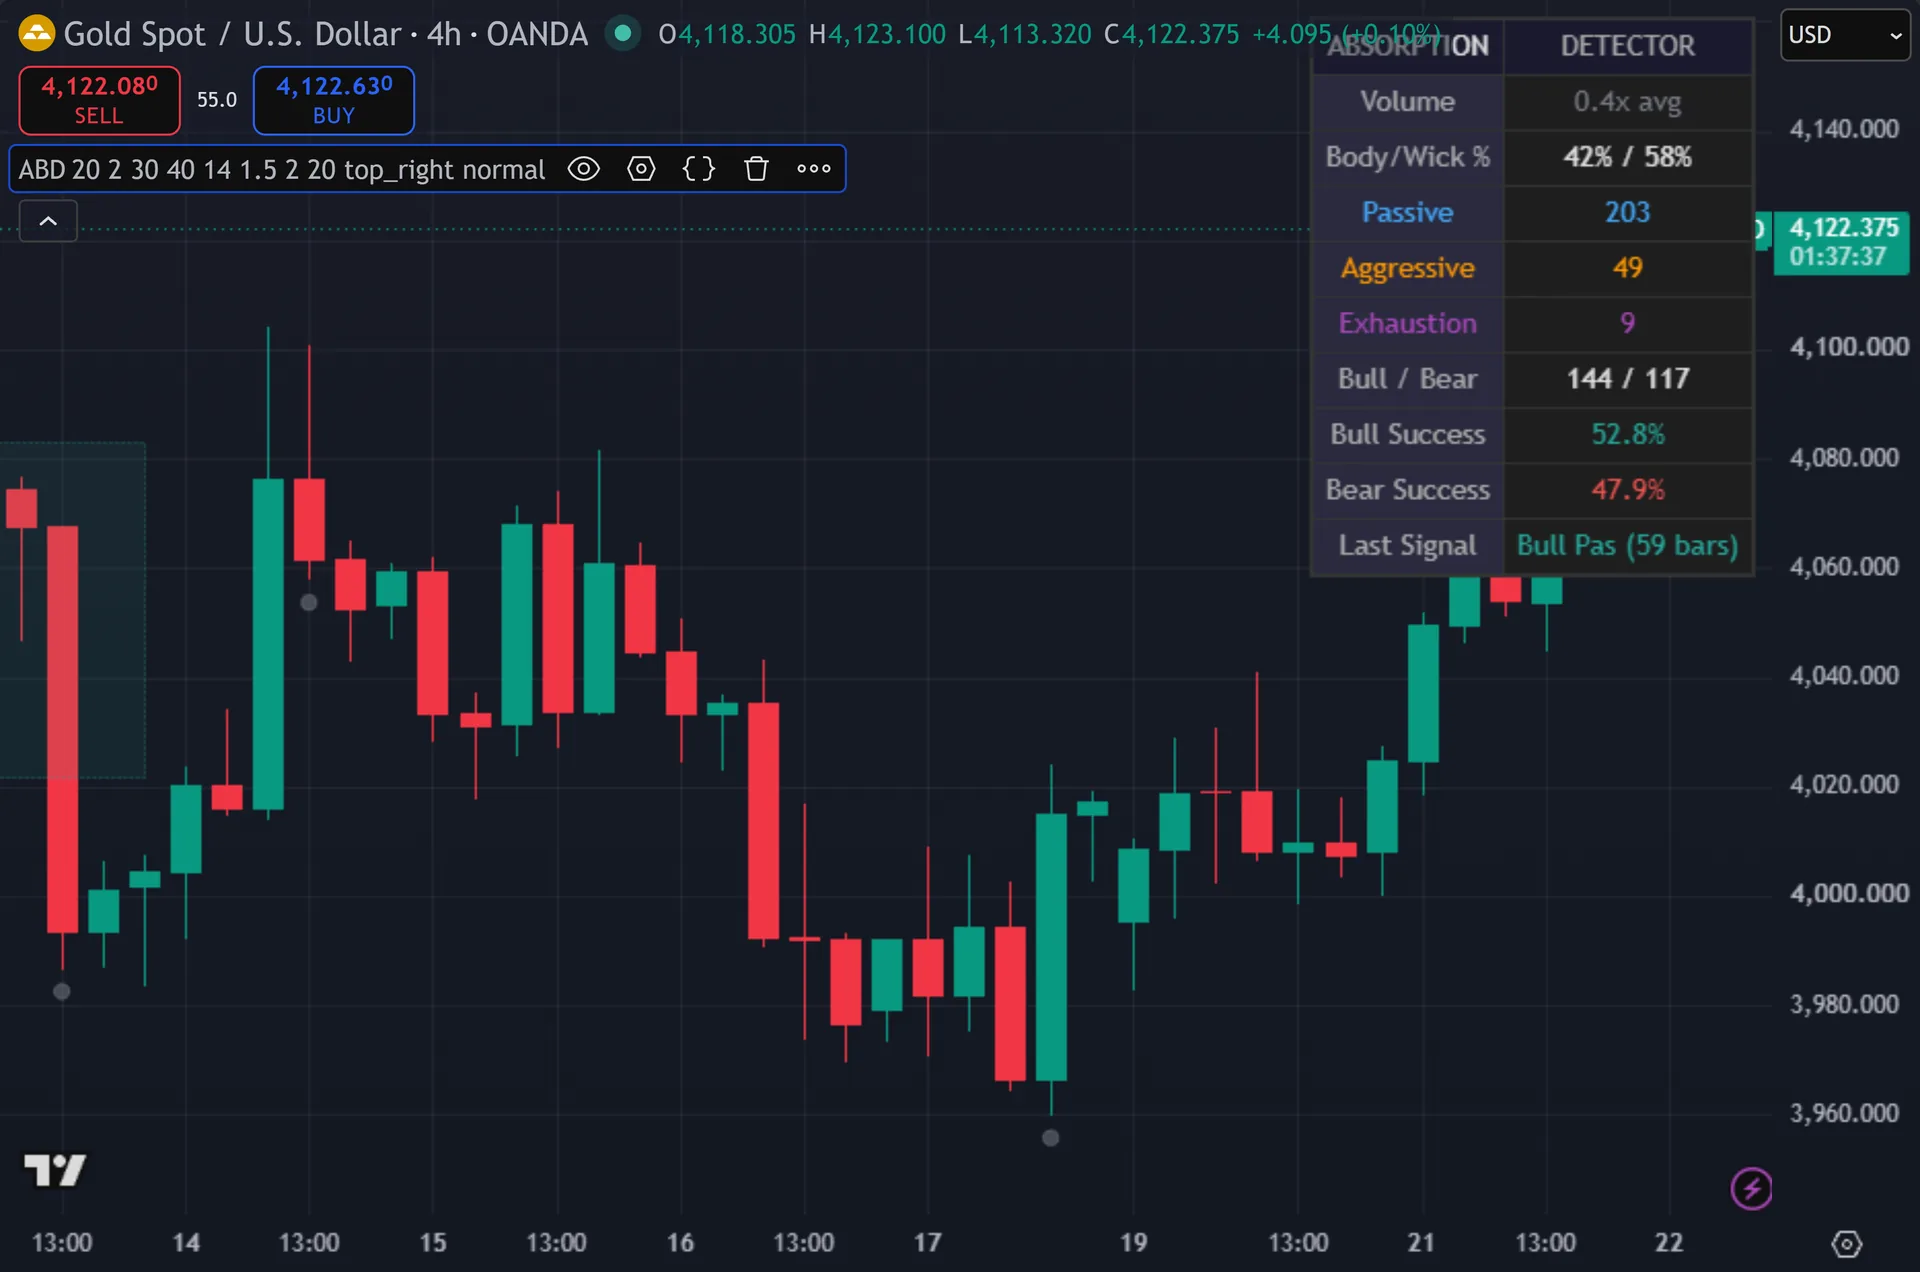
Limitations worth knowing
The BUY and SELL tags do not gate on barstate.isconfirmed. Next, they can appear and disappear on the live candle as volume and shape change. The labels, zones, bar coloring and dashboard counters do gate on the bar close, so history stays fixed. Then, wait for the close before you act on a tag.
The success percentages on the dashboard stay rough. Yet, the script holds one pending check per direction. A new absorption bar overwrites the previous pending check before its ten bars elapse, so those earlier cases count in the total yet can never count as hits. Truly, the figure therefore reads lower than reality, and a fixed ten-bar horizon suits no particular trade plan.
There is no cooldown and no trend context. Plainly, clusters of absorption bars can print through a volatile session. The tool also says nothing about stops, targets or direction beyond wick bias, and it never calls request.security, so it sees only the chart timeframe.
Get Absorption Detector on TradingView
Open Absorption Detector on TradingView
If you also trade MetaTrader, the MT4 and MT5 indicator library is available below.
Get the complete indicator library
One email unlocks the full MT4 and MT5 indicator library. Also, this TradingView script stays free on TradingView – the button above adds it to your chart.
Using it alongside MetaTrader
Adding a script on TradingView takes one click, so there is no install step here. Indeed, if you want the same idea on MetaTrader, the MT4 and MT5 indicator installation guide walks through copying files into the data folder and attaching them to a chart. You can also browse the full MetaTrader indicator library, the MT4 indicators section, or the other free TradingView scripts published on this profile. For related chart tools see the MT5 indicators section and the forex trading strategies guides.
External references
- Negative volume index on Wikipedia
- On-Balance Volume at Investopedia
- CandleVolume at StockCharts ChartSchool
Frequently asked questions
What is volume absorption?
It describes heavy trading with little price result. Still, a large resting order fills against incoming market orders and holds the level. On the chart that looks like a high-volume bar with a small body, long wicks and a contained range. Thus, the script defines that in measurable terms and marks it.
Does the Absorption Detector repaint?
Partly, and it pays to know which parts. Hence, labels, zones, bar coloring and every dashboard counter require the bar to close. The BUY and SELL plotshapes do not, so they can flicker on the forming candle. Confirmed history never changes.
What separates the three absorption types?
Passive needs a small body under 30 percent of range with wicks over 40 percent. Next, aggressive needs a full engulfing bar on the same high volume. Exhaustion needs 3.0 times average volume plus one dominant wick above 60 percent of total wick. Then, exhaustion takes priority when more than one matches.
How do I get fewer signals?
Raise Min Intensity from 2 to 3 or 4, which demands stronger volume and wick dominance. Yet, you can also raise the Volume Spike Multiplier above 2.0, or lower Max Range x ATR below 1.5 to demand a tighter bar. Switching off the passive class alone cuts the count sharply.
How much should I rely on this indicator?
Treat it as one input, not a decision. Truly, it is a chart analysis tool, not trading advice. Test it on your own markets and timeframes before relying on it. Results are not guaranteed; past performance is not indicative of future results.

About the author
Written by Dominic Walsh, a Forex trader and MT4/MT5 indicator, Expert Advisor and script developer. Every tool on forexmt4systems.com is tested on live charts before release and ships with ready-to-use compiled MT4 (.ex4) and MT5 (.ex5) files. Learn more about the trader and developer behind this site.
How we build, test and correct every tool: Editorial & Testing Policy. Trading carries risk; see the disclaimer.