
Allan Variance Stability Index borrows a tool from atomic clock engineering. As a volatility stability indicator TradingView traders can run in a lower pane, it asks one question: does this market behave the same way at every timescale? The script averages log returns in blocks of 1, 2, 4, 8, 16 and 32 bars, measures the dispersion of each set, then tracks how far apart those six measurements drift.
It is free and open source. Also, you can add it to any chart from the Allan Variance Stability Index script page on TradingView, and the full Pine source is published there for you to read.
What Allan Variance Stability Index plots in a separate pane below price
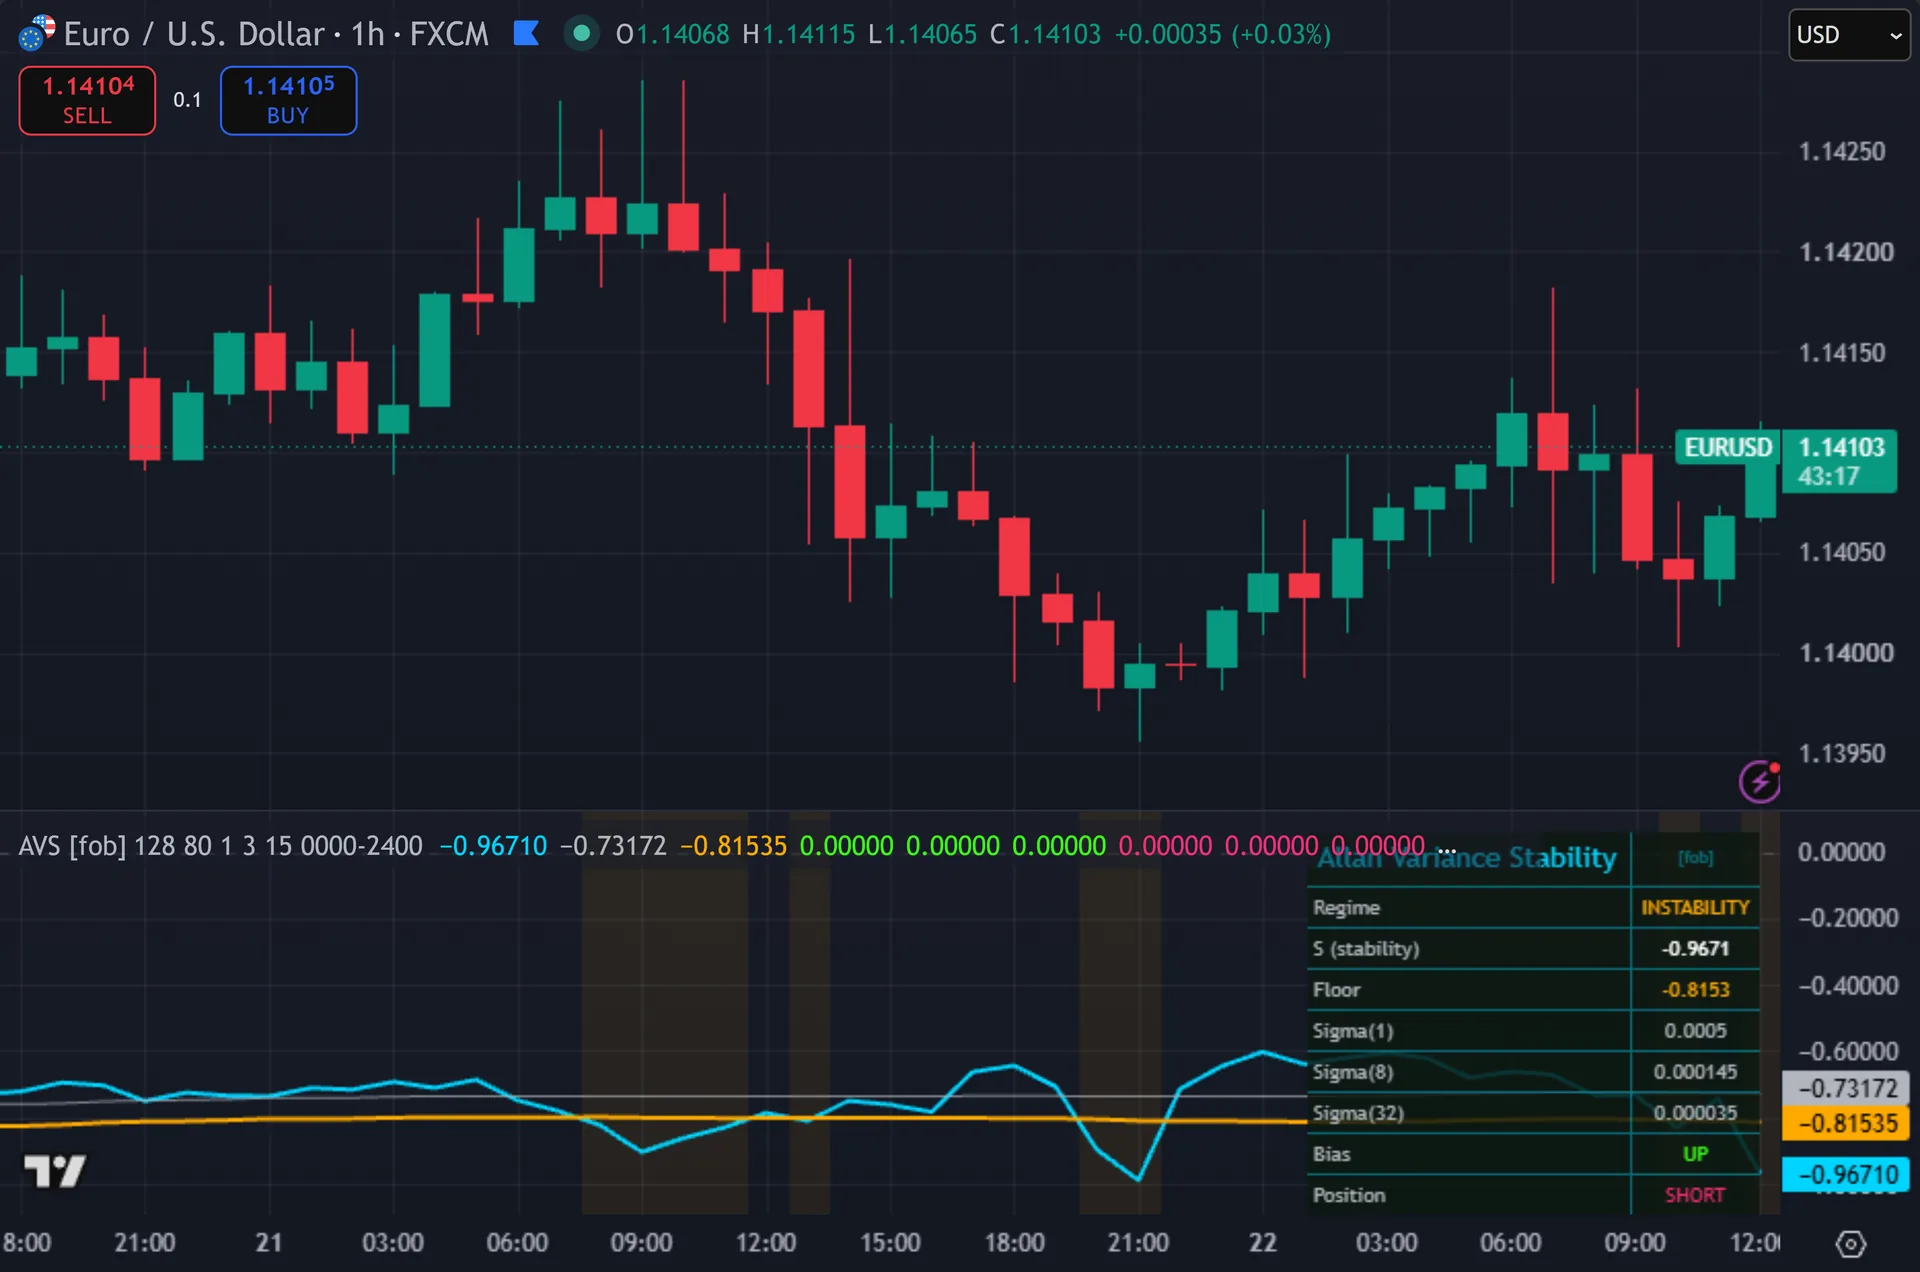
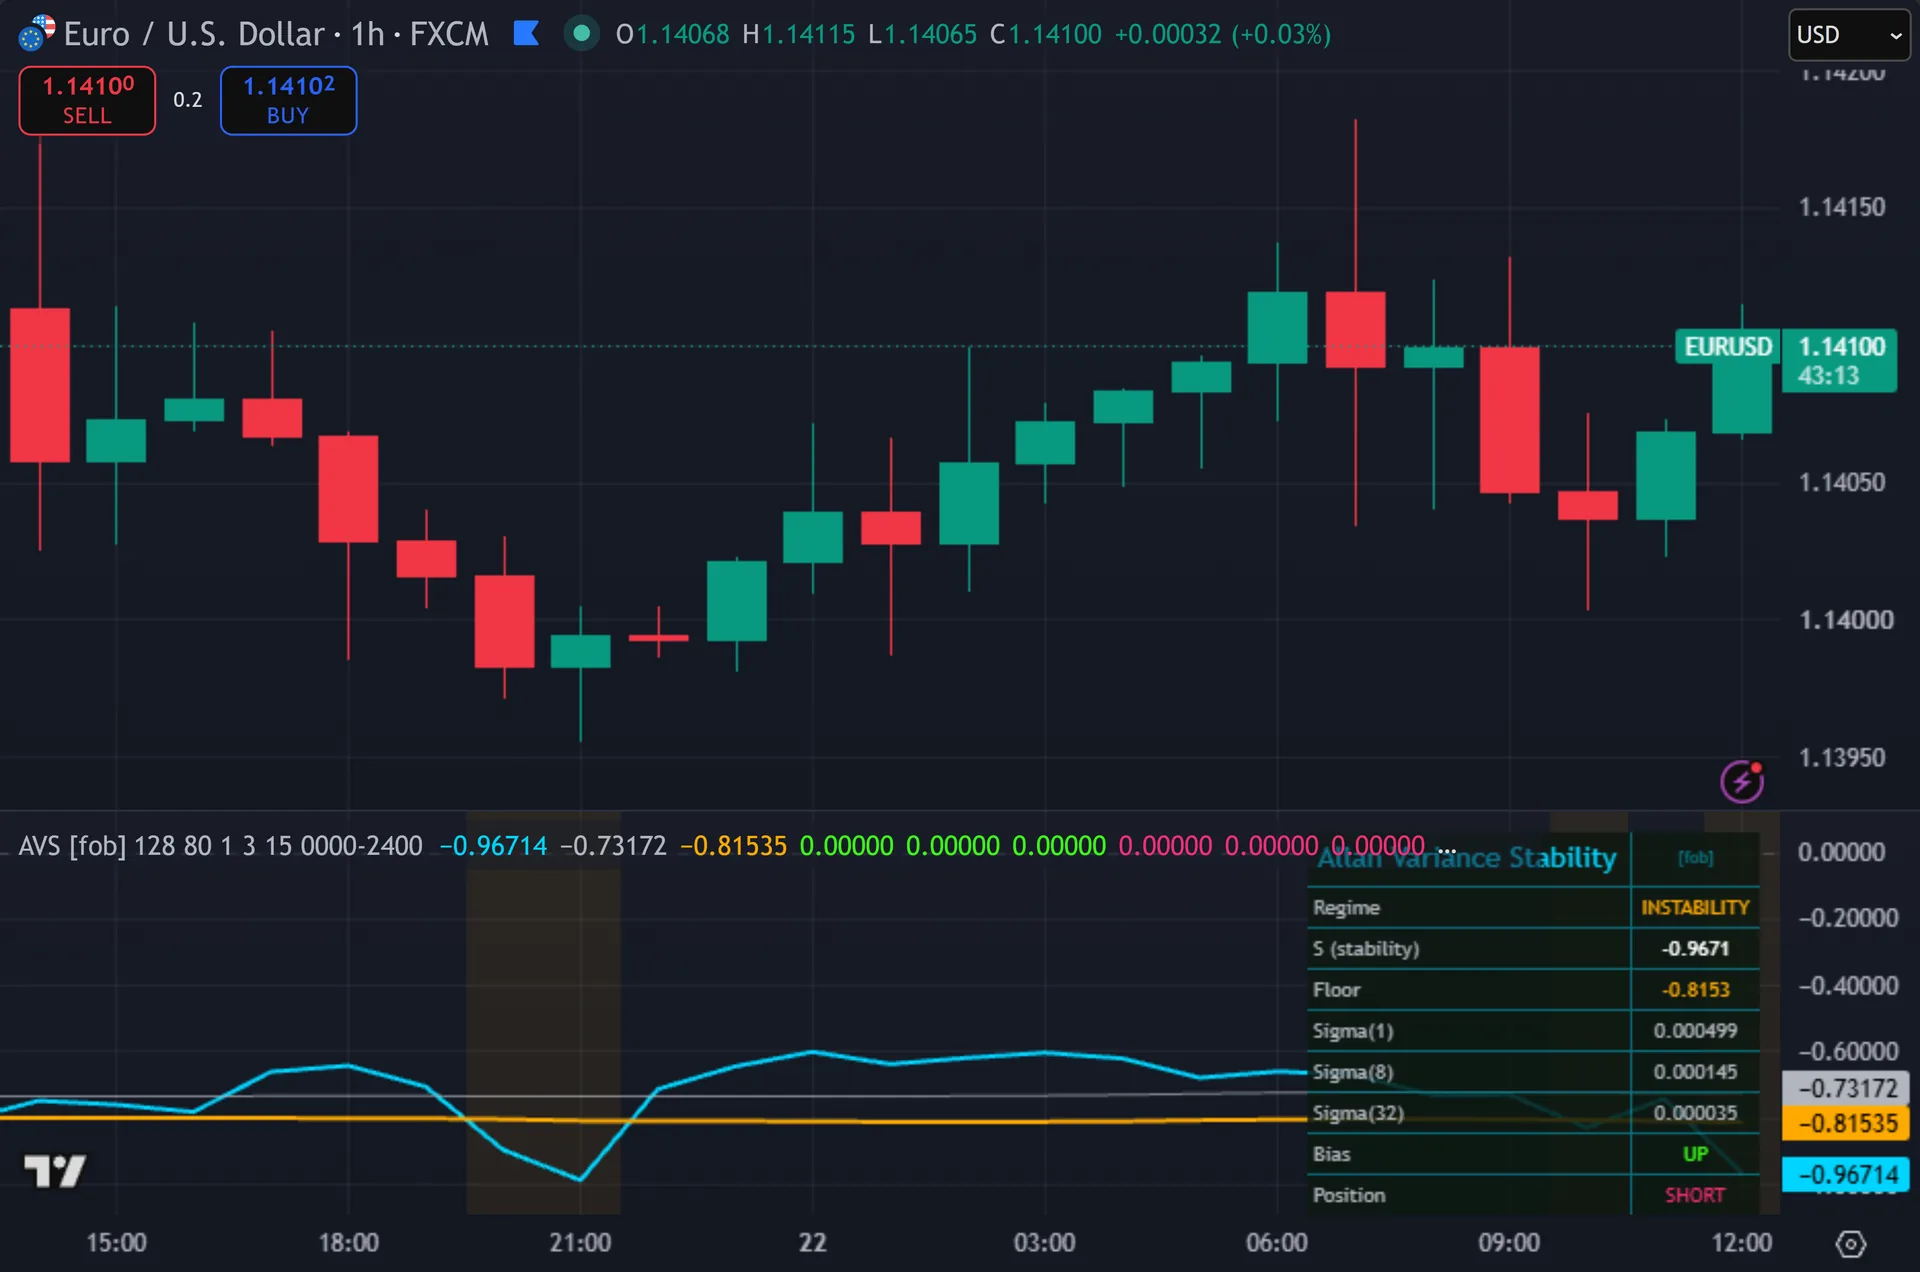
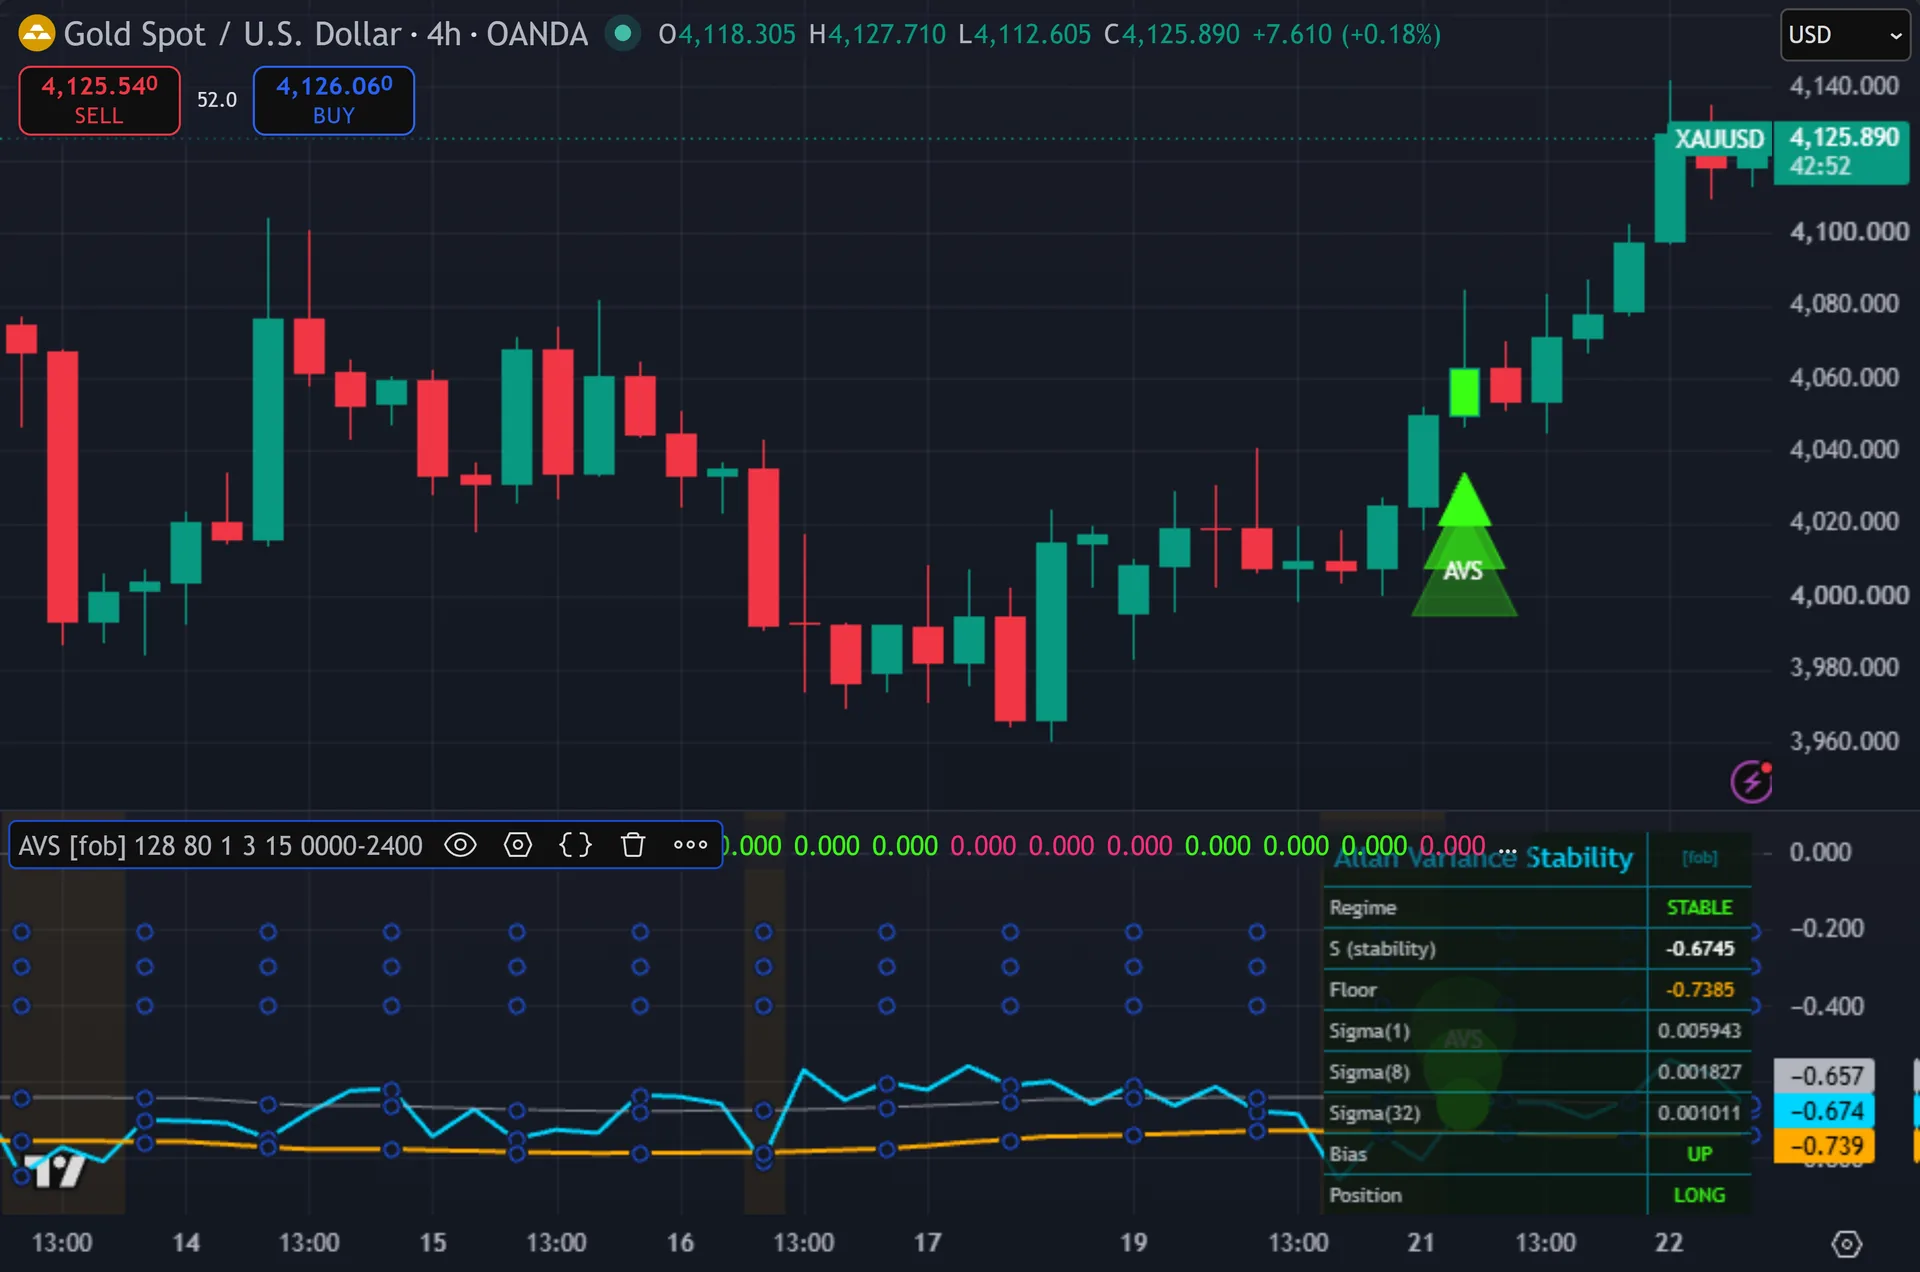
A cyan line carries the stability score S. Indeed, a silver line shows its 80-bar median, and an orange line marks the adaptive floor beneath it. The pane background turns amber whenever S sits under that floor. Still, signals print as three-layer glowing circles at the pane edge, tagged AVS, and the same entries mirror onto the price chart as triangles through force_overlay. Signal bars change colour. Thus, a ten-row dashboard in the top-right reports regime, S, floor, sigma at lags 1, 8 and 32, bias, position and signal age.
How Allan Variance Stability Index is built
Measuring dispersion at six timescales
The script starts with log returns – the natural log of close divided by the prior close. Hence, it then averages those returns in non-overlapping blocks. At lag 1 each block holds one return. Next, at lag 32 each block holds 32. With the default 128-bar window that gives 128 blocks at the short end and only 4 at the long end.
For each lag it takes the standard deviation of those block averages. Then, that produces six numbers: sigma at 1, 2, 4, 8, 16 and 32. A note on the name matters here. Yet, the original Allan work uses successive differences between neighbouring blocks. This script uses the plain sample deviation of the whole block set instead – a variance-time estimator with the same purpose, not the textbook two-sample formula.
The stability score follows. Truly, the script takes the natural log of each sigma, measures how much those six logs scatter around their own mean, and negates the result. So S sits at or below zero. Plainly, tight scatter means dispersion scales predictably across timescales and S rises toward zero. Wide scatter drags S down.
Turning stability into a trade signal
S never sits still, so a fixed level would be useless. Also, the script builds an adaptive floor instead: the 80-bar median of S minus one standard deviation. You can move that multiplier between 0.25 and 3.0. Indeed, a wider setting demands a bigger disturbance before anything arms.
When S drops below the floor, the script arms a bias. Still, it compares close with close three bars back. Higher arms long. Lower arms short. That bias latches and waits. Thus, nothing fires while S stays under the floor.
The entry comes on the reclaim. Hence, when S crosses back above the floor, the script fires in the direction of the latched bias. Three further gates apply. Next, the bar must close, the previous position state must differ, and the 15-bar cooldown must have elapsed. So the tool trades the return of order after a disruption, rather than the disruption itself.
How to read the signals
Watch the amber background first. Then, it marks every stretch where returns stopped scaling consistently – news, a session handover, a liquidity gap. That is the setup phase, not the entry. Yet, the dashboard shows Bias UP or DOWN during it, so you know which way the tool leans before anything prints.
The circle prints when S crosses back above the orange floor. Truly, read the sigma rows at that moment. Sigma(1) far above Sigma(32) says short-horizon noise did the work. Plainly, all three moving together says the whole curve shifted, which is the cleaner version of the setup.
Expect long quiet stretches. Also, the 15-bar cooldown plus the alternating position state means the tool will not stack entries. On a 1-hour chart you may see a handful of circles in a month. Indeed, that is the design, not a fault.
Every Allan Variance Stability Index setting explained
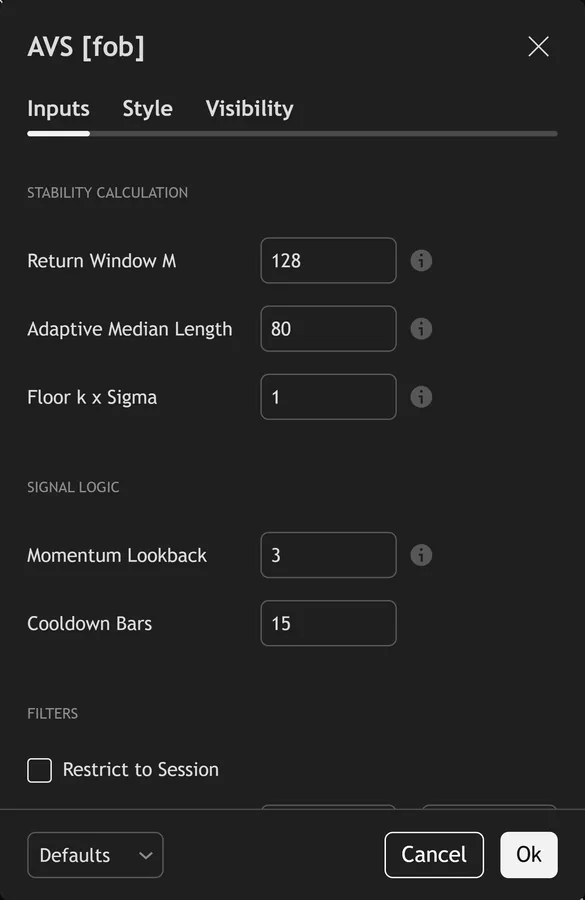
The script exposes 14 inputs, grouped in the settings panel exactly as shown below. Defaults are the published values.
Stability Calculation
| Setting | What it does | Default | Range |
|---|---|---|---|
| Return Window M | Number of log-returns used to estimate sigma(tau). | 128 | 64 to 500 |
| Adaptive Median Length | Window used to compute the median and stdev floor of S. | 80 | 20 to 300 |
| Floor k x Sigma | Floor = median(S) – k * stdev(S). Falling through arms a pullback, rising back through fires it. | 1.0 | 0.25 to 3.0 |
Signal Logic
| Setting | What it does | Default | Range |
|---|---|---|---|
| Momentum Lookback | Sign of close – close[n] sets the directional bias once instability is arming. | 3 | 1 to 20 |
| Cooldown Bars | Sets the cooldown bars used in the calculation. | 15 | 1 to 60 |
Filters
| Setting | What it does | Default | Range |
|---|---|---|---|
| Restrict to Session | Toggles restrict to session on the chart. | off | on / off |
| Session Window | Controls session window. | 0000-2400 |
Visual
| Setting | What it does | Default | Range |
|---|---|---|---|
| Show Dashboard | Toggles show dashboard on the chart. | on | on / off |
| Show 3-Layer Glow | Toggles show 3-layer glow on the chart. | on | on / off |
| Buy Color | Colour used for buy color. | #39ff14 | |
| Sell Color | Colour used for sell color. | #ff2d78 | |
| Stability Line | Colour used for stability line. | #00d4ff | |
| Floor Line | Colour used for floor line. | #ffaa00 | |
| Dashboard BG | Colour used for dashboard bg. | color.new(#0c1810, 16) |
Alerts built into Allan Variance Stability Index
The script ships 13 alert conditions. Still, open the alert dialog on the chart, pick the indicator as the condition source, then choose the event you want. Alerts fire on the close of the bar, so they follow the same confirmed-bar rule the on-chart signals use.
- AVS Buy
- AVS Sell
- AVS Any Signal
- AVS Floor Break
- AVS Floor Reclaim
- AVS Arm Up
- AVS Arm Down
- AVS Vol Expanding
- AVS Vol Contracting
- AVS Bias Flip
- AVS Webhook JSON
Other markets and timeframes
Nothing here is priced in pips. Thus, the script works on log returns, and every threshold is relative – a rolling median of S and its own standard deviation. Gold, indices, crypto and equities all run on the defaults. Two practical notes. The tool needs roughly 208 bars of history before the floor settles, so a short chart history leaves the pane blank. Hence, and on illiquid symbols with frequent flat bars, zero returns flatten sigma at the short lags.
Limitations worth knowing
This reads regime, not direction. Next, direction comes from one crude check – close against close three bars back. The stability maths gets no say in it. Then, if you want a considered trend view, pair the tool with something built for that job.
It offers no stop, no target and no sizing. Yet, it also skips volume entirely, which cuts both ways. Nothing breaks on spot forex, where volume is broker tick data rather than exchange data, but genuine order flow context is missing too.
The floor is adaptive, so it drifts. In a market that stays disturbed for weeks, the median falls with it and the floor follows. The tool then treats a merely less-disturbed reading as a reclaim. Truly, six nested loops also run on every bar, so a very long chart history feels slow to load.
Get Allan Variance Stability Index on TradingView
Open Allan Variance Stability Index on TradingView
If you also trade MetaTrader, the MT4 and MT5 indicator library is available below.
Get the complete indicator library
One email unlocks the full MT4 and MT5 indicator library. Plainly, this TradingView script stays free on TradingView – the button above adds it to your chart.
Using it alongside MetaTrader
Adding a script on TradingView takes one click, so there is no install step here. Also, if you want the same idea on MetaTrader, the MT4 and MT5 indicator installation guide walks through copying files into the data folder and attaching them to a chart. You can also browse the full MetaTrader indicator library, the MT4 indicators section, or the other free TradingView scripts published on this profile. For related chart tools see the MT5 indicators section and the forex trading strategies guides.
External references
- Stochastic oscillator on Wikipedia
- Stochastic Oscillator at Investopedia
- Raff Regression Channel at StockCharts ChartSchool
Frequently asked questions
Does the Allan Variance Stability Index repaint?
No. Indeed, both signal flags carry barstate.isconfirmed, and every plotshape draws from those flags rather than from the raw crossover. Circles appear only after the bar closes. Still, the dashboard reads live, so S and the sigma rows do move during the bar, but the marks already on the chart do not.
Why is the stability score always negative?
By construction. Thus, s is the negative standard deviation of six log-sigma values, so zero is the ceiling and it arrives only if all six lags agree perfectly. That never happens in practice, since dispersion grows with the averaging window in any market. Hence, judge S against the orange floor and the silver median, not against the zero line.
Is this the real Allan variance from clock engineering?
It is the same idea, applied loosely. Next, the original computes the mean squared difference between neighbouring block averages. This script computes the plain standard deviation of the whole block set at each lag. Then, both describe how dispersion scales with averaging time. The script’s version is simpler and behaves closely enough for chart use.
What do the Return Window and Median Length inputs do?
Return Window M sets how many log returns feed each sigma estimate – 128 by default, with a range of 64 to 500. Yet, larger values steady the estimate and slow it down. Adaptive Median Length sets the lookback for the median and standard deviation that build the floor, 80 by default. Truly, raise it for a calmer floor on higher timeframes.
How much should I rely on this indicator?
Treat it as one input, not a decision. Plainly, it is a chart analysis tool, not trading advice. Test it on your own markets and timeframes before relying on it. Results are not guaranteed; past performance is not indicative of future results.

About the author
Written by Dominic Walsh, a Forex trader and MT4/MT5 indicator, Expert Advisor and script developer. Every tool on forexmt4systems.com is tested on live charts before release and ships with ready-to-use compiled MT4 (.ex4) and MT5 (.ex5) files. Learn more about the trader and developer behind this site.
How we build, test and correct every tool: Editorial & Testing Policy. Trading carries risk; see the disclaimer.