
Volume alone tells you how much traded. Also, it never tells you how hard price had to move to absorb it. Amihud Illiquidity Surge is an illiquidity indicator TradingView traders can use to watch that ratio directly. Indeed, it divides the size of each bar’s move by that bar’s volume, z-scores the result over 50 bars, then marks the bars where price impact per unit of volume runs unusually high.
It is free and open source. Still, you can add it to any chart from the Amihud Illiquidity Surge script page on TradingView, and the full Pine source is published there for you to read.
What Amihud Illiquidity Surge plots on the price chart
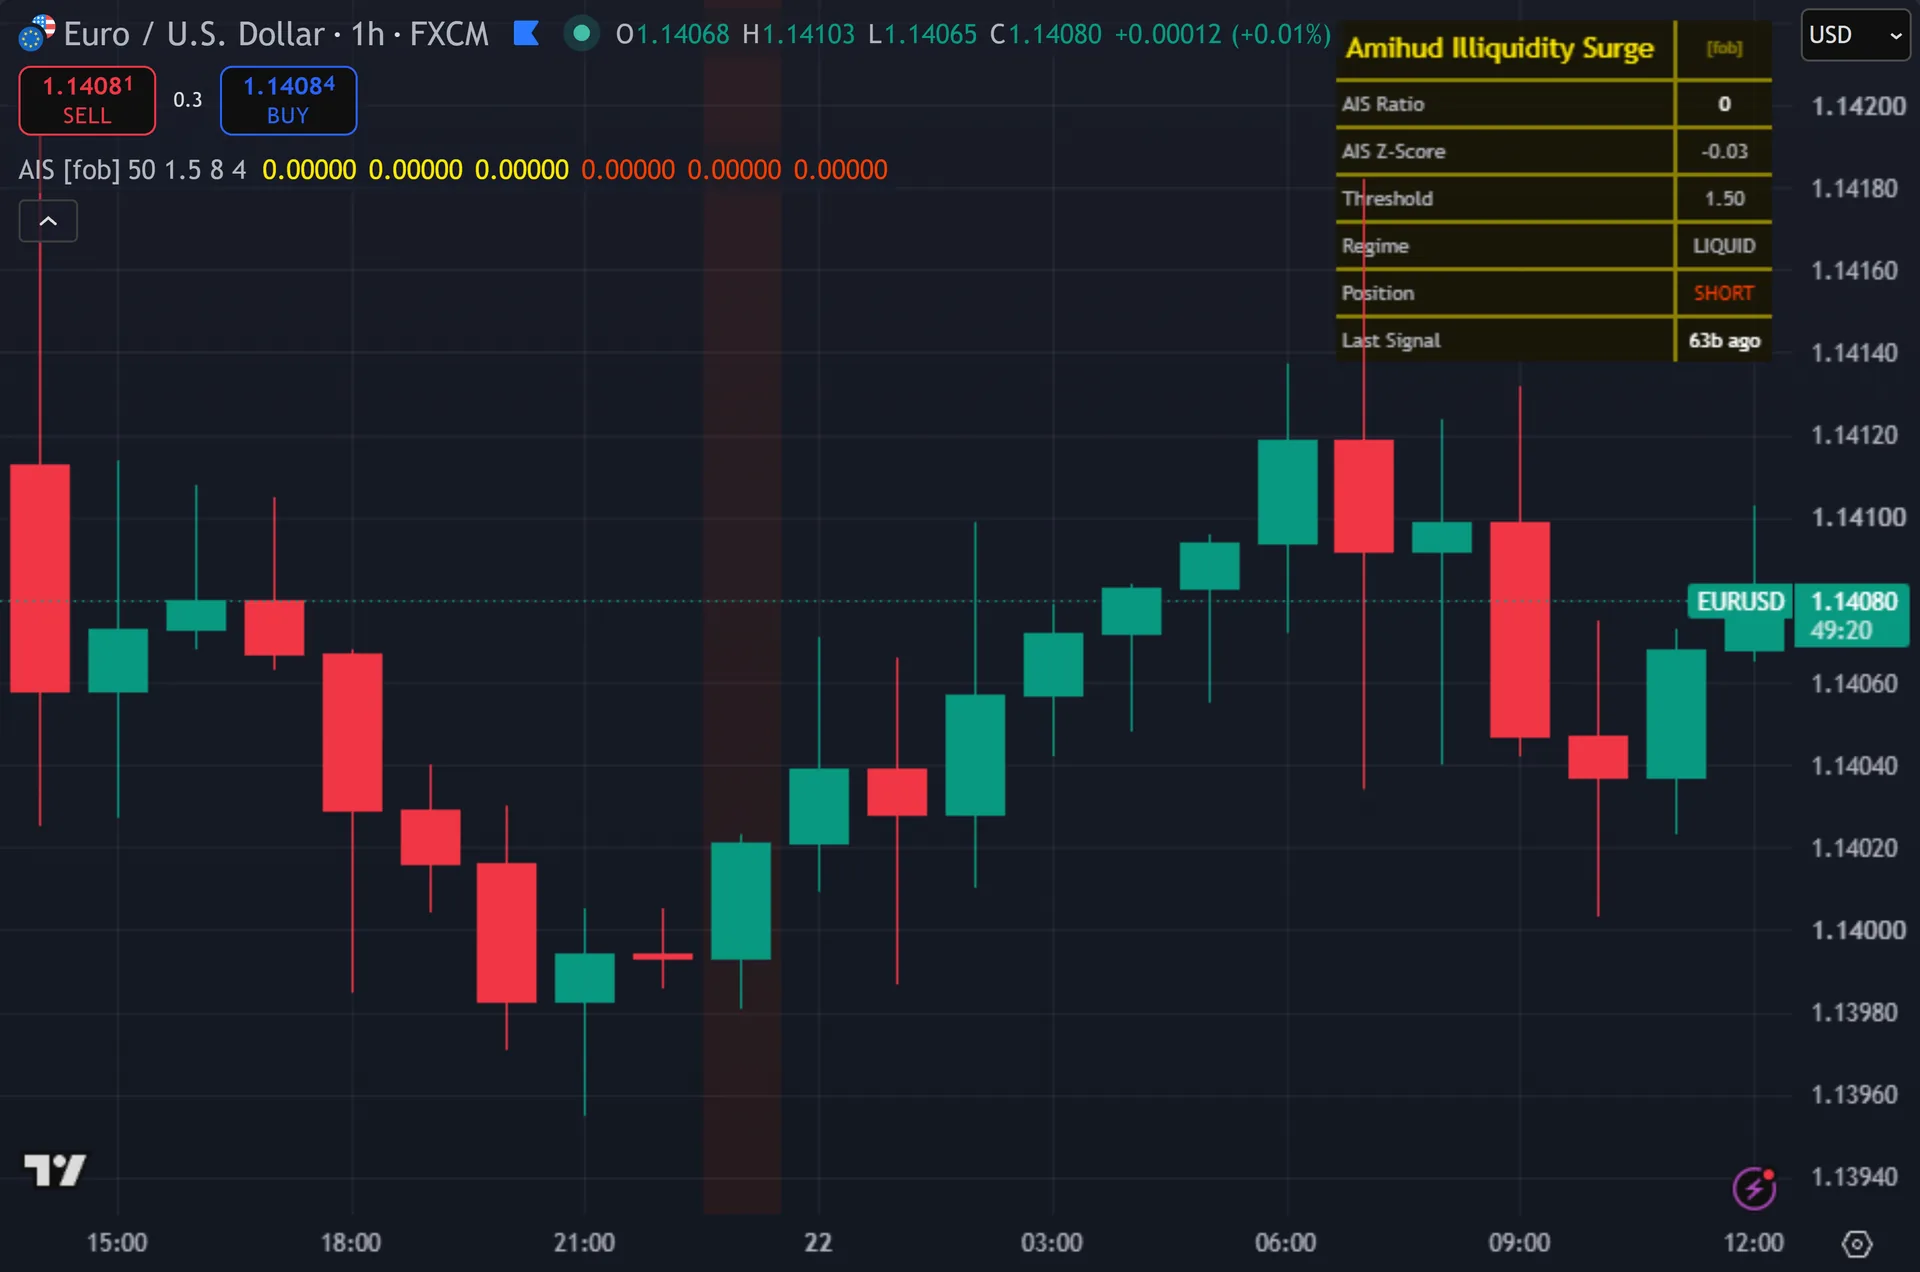
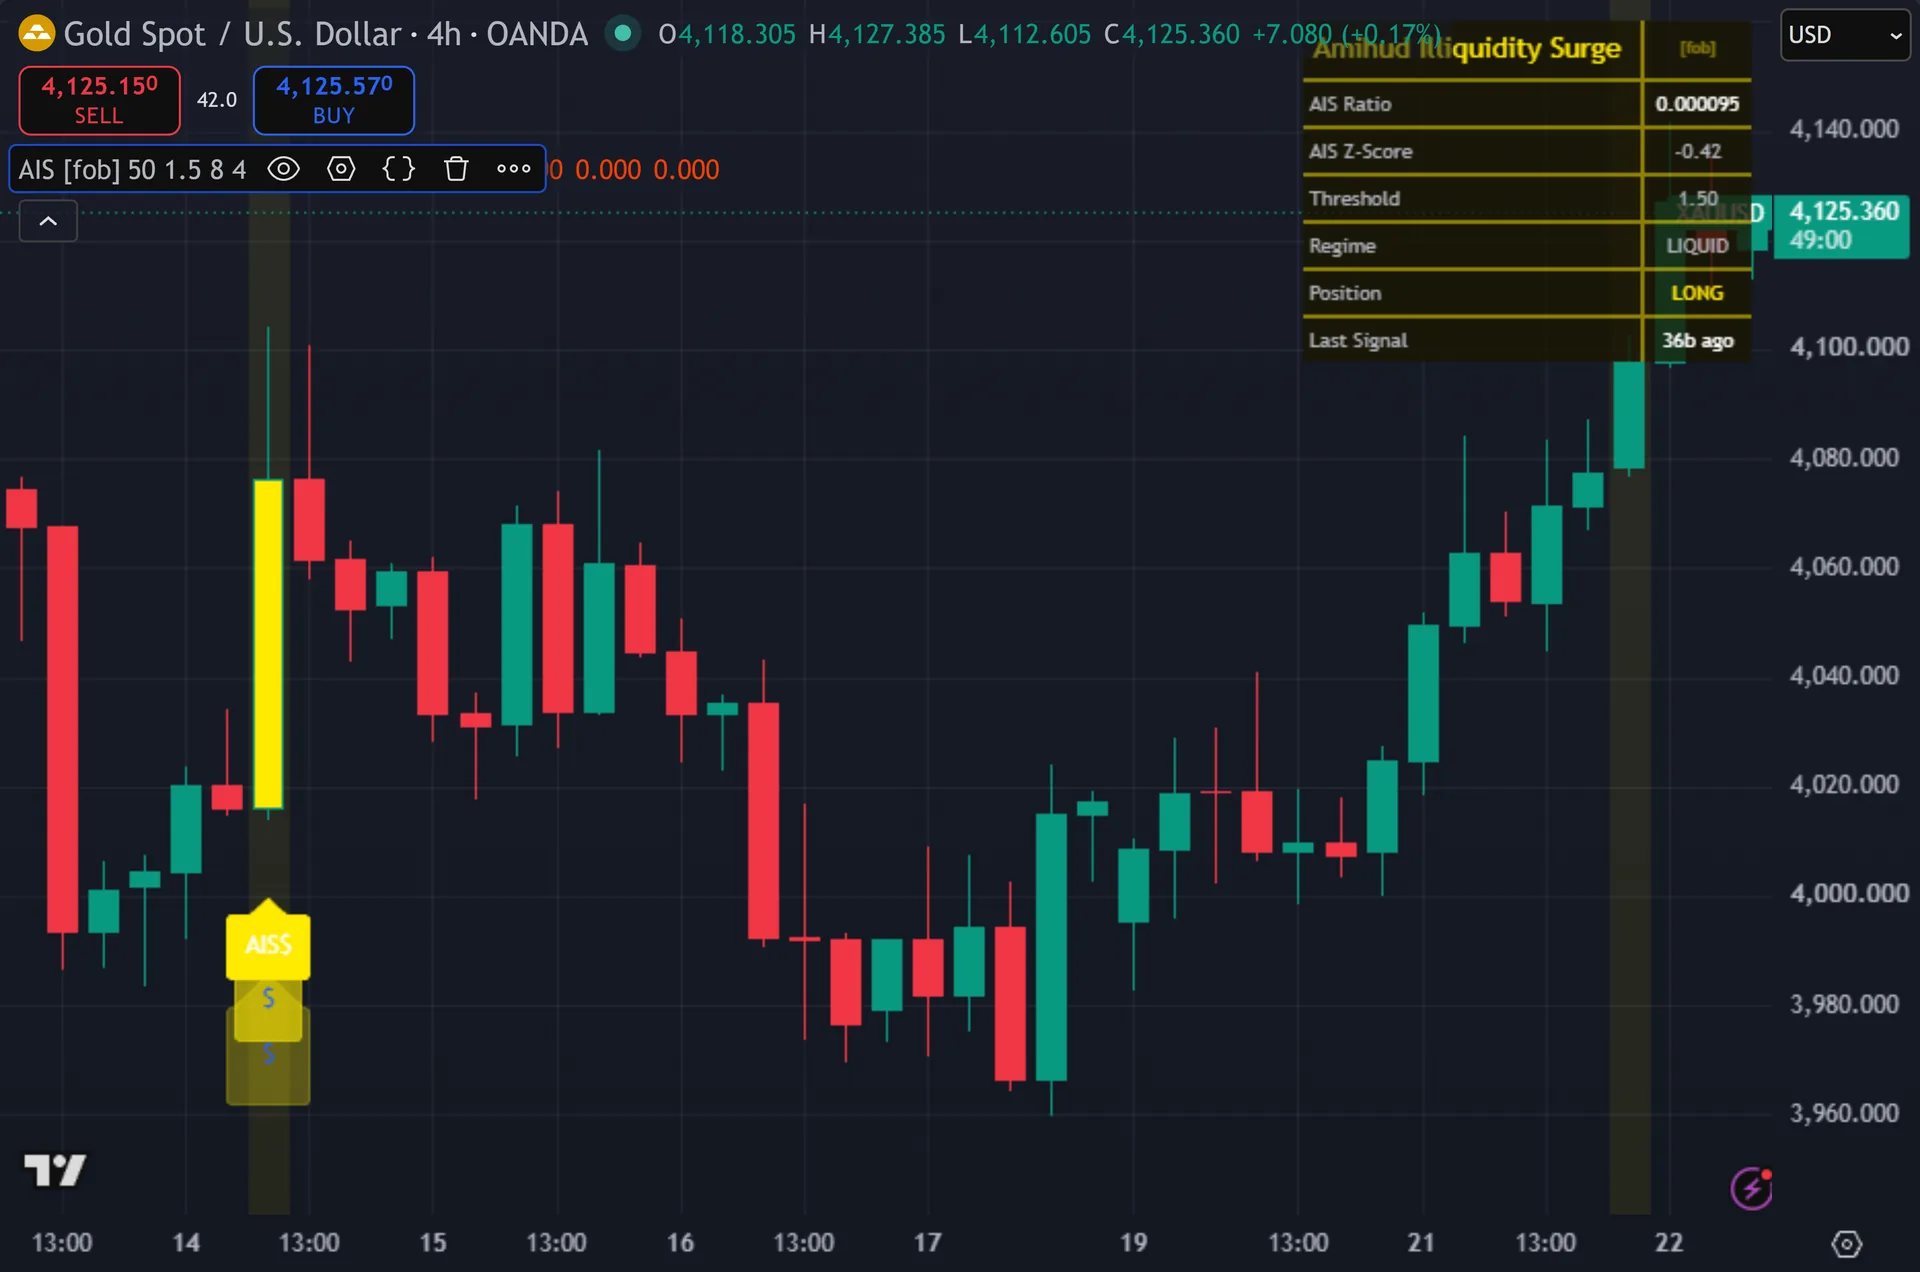
The script sits on the price chart yet plots no line. Thus, signals appear as label shapes below or above the bar, drawn in three stacked sizes for a glow and marked with a dollar sign. Signal bars get recoloured gold or red-orange. While the z-score sits at or above the threshold, the background carries a faint tint – gold when close holds above the EMA, red-orange when it sits below. A seven-row dashboard in the top right reports the raw ratio, its z-score, the threshold, the regime word, position and bars since the last signal.

How Amihud Illiquidity Surge is built
The Amihud ratio in code
Amihud (2002) defined illiquidity as the average of absolute daily return divided by daily dollar volume. Hence, move a lot on little volume and the market is illiquid. Move little on heavy volume and it is deep. Next, the measure became the standard academic proxy for price impact, and it needs no order book to compute.
This script builds the per-bar version. Then, it takes the absolute price change, close minus the previous close, then divides by that bar’s volume. A guard clamps volume to a floor of 1, so a bar with no volume cannot divide by zero. Yet, two deviations from the published formula matter here: the numerator is an absolute price change rather than a percentage return, and the denominator is raw volume rather than dollar volume.
A 50-bar simple moving average and a 50-bar standard deviation then normalise the ratio. Truly, the z-score equals the current ratio minus its mean, divided by that deviation. If the deviation reads zero the script writes zero instead of dividing. Plainly, a z at or above 1.5 flags the surge regime and turns the background on.
Turning a surge into a signal
Illiquidity carries no direction. Also, a thin market can drop or rip. So the script takes direction from an 8-period EMA of close. Indeed, a close crossing above that EMA during a surge gives a buy. A close crossing below during a surge gives a sell. Still, outside the surge regime no label prints at all, however clean the cross looks.
Three gates finish the job. Thus, signals alternate, so a buy cannot follow a buy. At least 4 bars must pass since the last signal. Hence, and barstate.isconfirmed must be true, so labels land on closed bars only. The background tint skips that last gate, since it follows the live z-score and can appear or vanish while the bar still forms.
The alert list holds nine conditions. Next, two of them suit regime work better than entries: surge start and surge end. A third fires when the z-score reaches 3.0 or more, which flags a genuinely extreme price-impact bar rather than a routine one.
How to read the signals
Read the z-score, not the raw ratio. Then, the raw number scales with the instrument’s price and its volume units, so it means nothing on its own. A z of 1.5 says this bar moved far more per unit of volume than the last 50 bars typically did.
Pair the surge with the tint colour. Yet, gold means the surge arrived with close above the 8-period EMA. Red-orange means it arrived below. Truly, that pairing is the whole signal logic in one glance: thin conditions plus a directional cross.
Check the clock before reading meaning into a surge. Plainly, thin sessions, holidays and rollover produce high price impact without any real demand behind it. Labels also require a closed bar, so your entry sits at the next open.
Every Amihud Illiquidity Surge setting explained
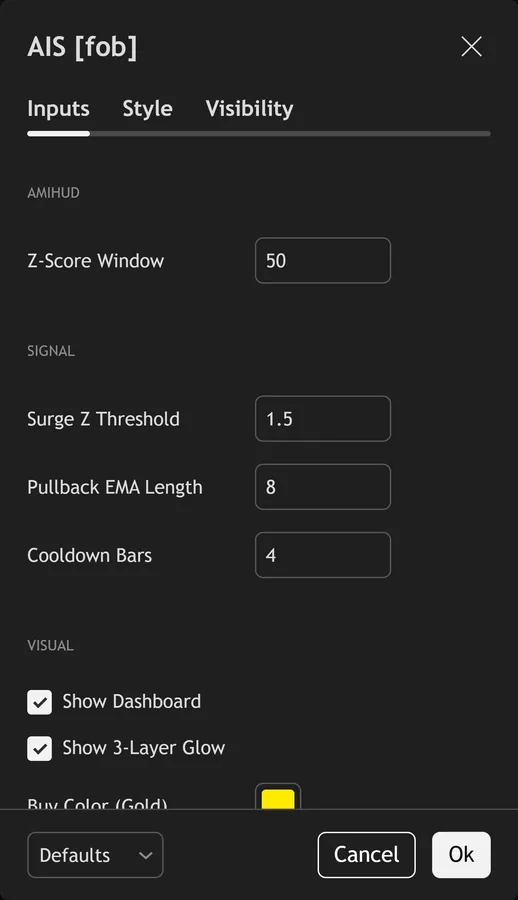
The script exposes 8 inputs, grouped in the settings panel exactly as shown below. Defaults are the published values.
Amihud
| Setting | What it does | Default | Range |
|---|---|---|---|
| Z-Score Window | Sets the z-score window used in the calculation. | 50 | 20 to 200 |
Signal
| Setting | What it does | Default | Range |
|---|---|---|---|
| Surge Z Threshold | Sets the surge z threshold used in the calculation. | 1.5 | 0.5 to 4.0 |
| Pullback EMA Length | Sets the pullback ema length used in the calculation. | 8 | 3 to 50 |
| Cooldown Bars | Sets the cooldown bars used in the calculation. | 4 | 1 to 20 |
Visual
| Setting | What it does | Default | Range |
|---|---|---|---|
| Show Dashboard | Toggles show dashboard on the chart. | on | on / off |
| Show 3-Layer Glow | Toggles show 3-layer glow on the chart. | on | on / off |
| Buy Color (Gold) | Colour used for buy color (gold). | #ffea00 | |
| Sell Color (Red-Orange) | Colour used for sell color (red-orange). | #ff3d00 |
Alerts built into Amihud Illiquidity Surge
The script ships 11 alert conditions. Also, open the alert dialog on the chart, pick the indicator as the condition source, then choose the event you want. Alerts fire on the close of the bar, so they follow the same confirmed-bar rule the on-chart signals use.
- AIS Buy
- AIS Sell
- AIS Any Signal
- AIS Surge Start
- AIS Surge End
- AIS Extreme
- AIS EMA Up
- AIS EMA Down
- AIS Webhook JSON
Other markets and timeframes
The threshold is a z-score, so it adapts to any instrument without retuning. Indeed, the volume input adapts far less cleanly. Spot forex volume is broker tick count rather than exchange size, so the ratio measures price move per tick and varies between brokers. Still, futures, crypto and stocks feed real traded size and suit the measure better. On a symbol with no volume at all, the floor of 1 degrades the tool into a plain price-change z-score.
Limitations worth knowing
This reads a market condition, not a trade plan. Thus, it sets no stop, no target and no position size. Illiquidity is direction blind by definition, so every long or short call here comes from one 8-period EMA cross, which is a simple timing rule rather than a trend model.
The output depends entirely on the volume feed. Hence, broker tick volume on spot forex is a proxy, not exchange size, so two brokers can produce different z-scores on the same pair. The raw ratio is scale dependent too, so compare z-scores between charts and never the raw numbers.
There is no oscillator pane. Next, the ratio and its z-score appear only as dashboard figures and a background tint, so you cannot see their history along the chart. The 50-bar window also leaves the first 50 bars of any chart without a usable z-score.
Get Amihud Illiquidity Surge on TradingView
Open Amihud Illiquidity Surge on TradingView
If you also trade MetaTrader, the MT4 and MT5 indicator library is available below.
Get the complete indicator library
One email unlocks the full MT4 and MT5 indicator library. Then, this TradingView script stays free on TradingView – the button above adds it to your chart.
Using it alongside MetaTrader
Adding a script on TradingView takes one click, so there is no install step here. Yet, if you want the same idea on MetaTrader, the MT4 and MT5 indicator installation guide walks through copying files into the data folder and attaching them to a chart. You can also browse the full MetaTrader indicator library, the MT4 indicators section, or the other free TradingView scripts published on this profile. For related chart tools see the MT5 indicators section and the forex trading strategies guides.
External references
- Money flow index on Wikipedia
- On-Balance Volume at Investopedia
- CandleVolume at StockCharts ChartSchool
Frequently asked questions
Does the Amihud Illiquidity Surge repaint?
The labels do not. Truly, every buy and sell checks barstate.isconfirmed, so a marker prints only after the bar closes. The background tint and the dashboard follow the live z-score, so those two can change while the candle is still forming.
Is this the real Amihud illiquidity measure?
It is the per-bar form of it. Plainly, amihud (2002) used absolute return over dollar volume, averaged across a month. This script uses the absolute price change over raw bar volume, then z-scores it across 50 bars. Also, the z-score removes most of the scaling difference, but the two are not identical.
Does it work on spot forex without exchange volume?
It runs, with a caveat. Indeed, Forex volume from a broker is a tick count, so the ratio becomes price move per tick rather than per lot. That still tracks thin conditions well. Still, just expect the raw values to differ between brokers and data feeds.
Why did a clean EMA cross print no label?
The surge gate blocked it. Thus, the z-score has to sit at 1.5 or above on that bar. Two other gates can also stop it: signals must alternate long and short, and at least 4 bars must pass since the last one. Hence, the dashboard z-score row shows which.
How much should I rely on this indicator?
Treat it as one input, not a decision. Next, it is a chart analysis tool, not trading advice. Test it on your own markets and timeframes before relying on it. Results are not guaranteed; past performance is not indicative of future results.

About the author
Written by Dominic Walsh, a Forex trader and MT4/MT5 indicator, Expert Advisor and script developer. Every tool on forexmt4systems.com is tested on live charts before release and ships with ready-to-use compiled MT4 (.ex4) and MT5 (.ex5) files. Learn more about the trader and developer behind this site.
How we build, test and correct every tool: Editorial & Testing Policy. Trading carries risk; see the disclaimer.