
Argus Gaze works like a pattern recognition indicator TradingView traders can interrogate rather than trust blindly. Also, it encodes each bar as three ATR-normalised numbers, then compares today against the last 64 bars. A softmax turns those similarity distances into weights. Indeed, the engine averages the moves that followed the closest matches and smooths the result into a Trend Score. A prop firm risk layer then decides whether a signal may fire.
It is free and open source. Still, you can add it to any chart from the Argus Gaze: Attention Trend Engine script page on TradingView, and the full Pine source is published there for you to read.
What Argus Gaze: Attention Trend Engine plots on the price chart
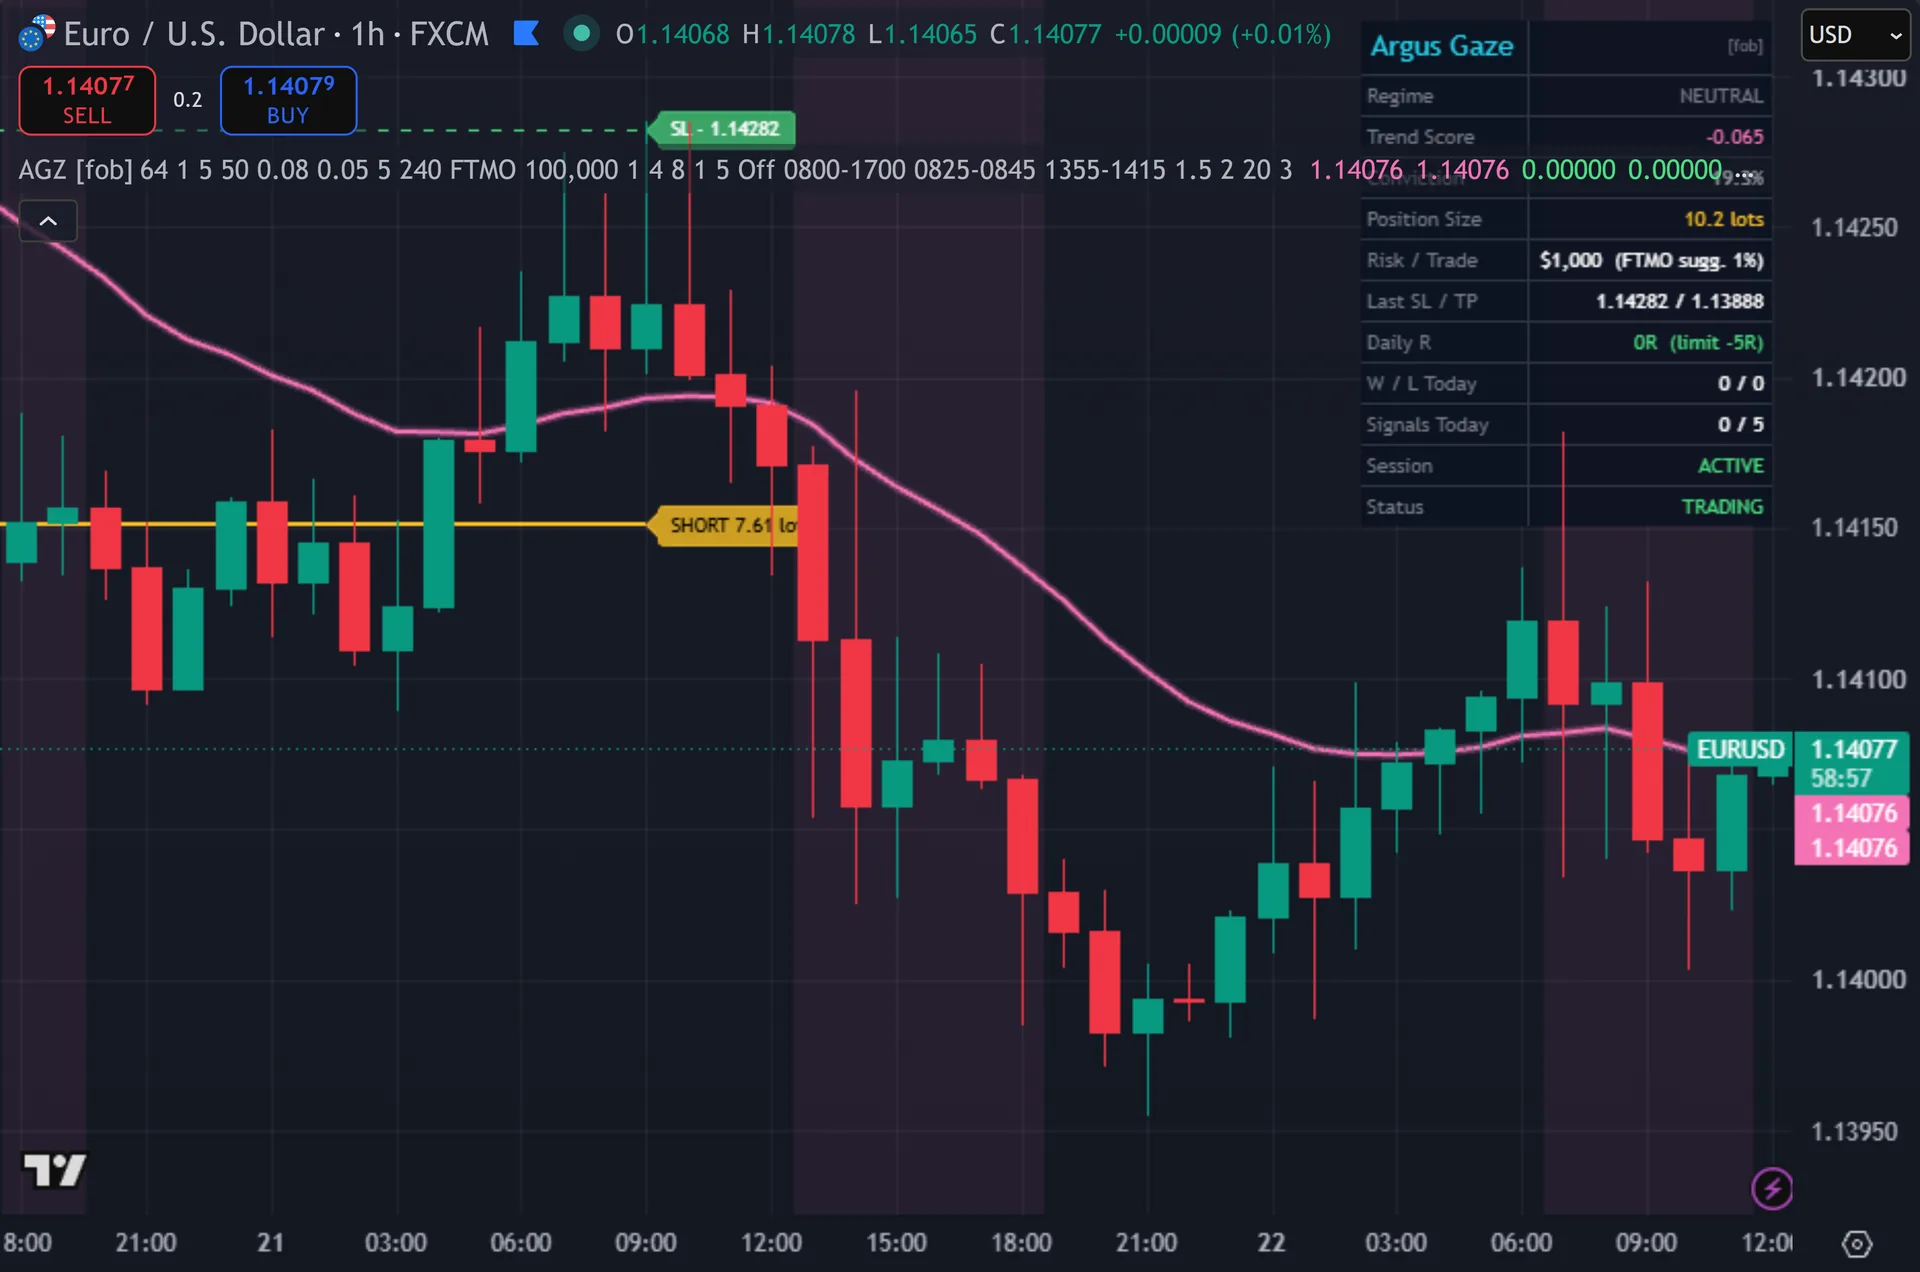
Argus Gaze paints the 21-period EMA as a two-layer ribbon. Thus, it turns green while the Trend Score sits above zero and pink below it. Signals print as stacked triangles under or over the bar, tagged AGZ, and the signal bar itself changes colour. Hence, a soft background tint marks the active regime and turns orange during a lockout. Each signal draws a gold entry line plus dashed stop and target lines with price labels. Next, a twelve-row dashboard and a floating attention focus label complete the display.
How Argus Gaze: Attention Trend Engine is built
Three numbers per bar
The engine describes every bar with three values. Then, feature one is the one-bar close change divided by ATR(14). Feature two is bar range over ATR(14) minus one, so an average-sized bar reads zero. Yet, feature three is the volume z-score across the last 50 bars. All three carry no units. Truly, that matters, because the comparison that follows only works when a bar from 2019 and a bar from today sit on the same scale.
Now the attention step. For every lag k from 1 to 64 the script takes the squared distance between today’s three numbers and the numbers from k bars back. It divides that distance by the temperature input, default 1.0, then flips the sign. Closer states score higher. A softmax with max-subtraction converts the 64 scores into weights that add up to one.
Each past state carries a known sequel: the ATR-normalised move that came after it. Plainly, the engine averages those 64 sequels using the attention weights, then runs a 5-period EMA over the result to produce the Trend Score. Nothing here trains. Also, there are no learned parameters and no neural network. It is a weighted nearest-neighbour average wearing transformer vocabulary.
The gates a signal must clear
A raw trigger needs the Trend Score to cross above +0.08 or below -0.08, stated in ATR units. Indeed, it also needs conviction above the 0.05 floor. Conviction is one minus attention entropy divided by ln(64). Still, low entropy means a handful of analogues dominate the average. At temperature 1.0 the weights usually stay fairly flat, which explains why the default floor sits so low.
The risk engine rules next. Thus, presets load two limits: FTMO 5 percent daily and 10 percent total, Topstep 2 and 4, Apex 2.5 and 5. The script converts them into R multiples using your risk per trade. Hence, at 1 percent risk, FTMO becomes minus 5R for the day and 10R of drawdown. A simulated tracker then runs the signals at a 1.5 ATR stop and a 2.0 reward-to-risk target, checking the stop before the target on each bar.
Five more gates follow: the optional higher-timeframe EMA(21) filter, the session window, the news blackout, a cap of five signals per day, a five-bar cooldown, and barstate.isconfirmed. Next, the daily lockout always blocks signals and clears at the next session day. A drawdown breach only blocks when you switch that option on, otherwise it just flags DD WARN on the dashboard.
How to read the signals
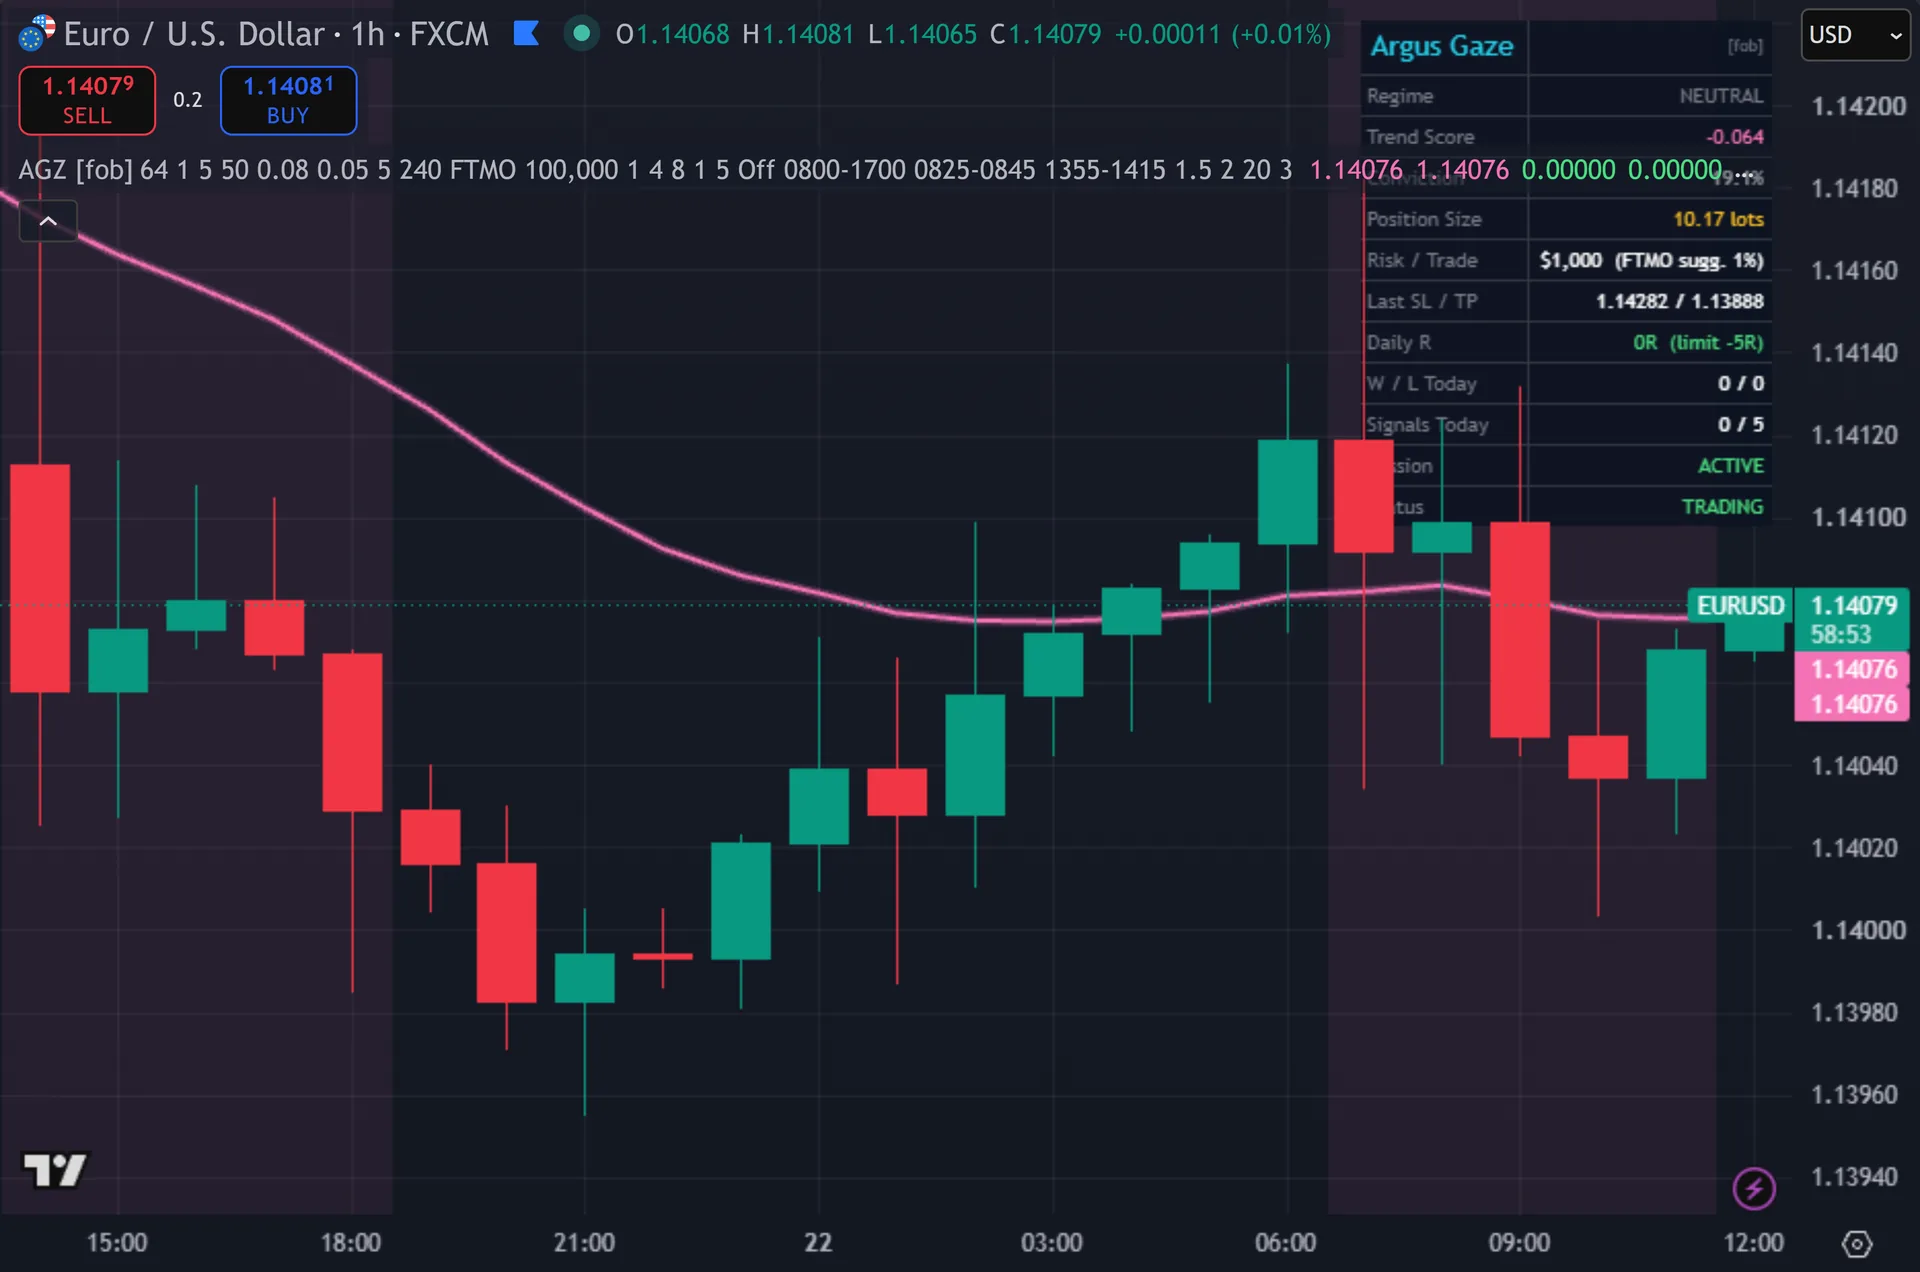
Start with the dashboard. Then, trend Score states the attention-weighted expected move in ATR units, so 0.15 means the closest analogues moved roughly 0.15 ATR after states like this one. Conviction states how concentrated the attention was. Yet, a high score with 4 percent conviction rests on a broad, flat average. The same score at 40 percent rests on a few sharply similar bars.
The floating label tells you where the engine looks. Truly, it lists the top three lags, their weights and the effective number of analogues, computed as one over the sum of squared weights. When that figure sits near 64, attention spreads evenly and the forecast approaches a plain average. Plainly, when it falls into single digits, a handful of bars drive the whole reading.
Signals need a closed bar, so the triangle lands after the candle completes. Direction also alternates. The position state moves to long or short and never returns to flat on its own, so a buy can only be followed by a sell. Also, treat the gold entry line and its dashed pair as a suggested frame built from your ATR stop and reward-to-risk inputs, then size the trade yourself.
Every Argus Gaze: Attention Trend Engine setting explained
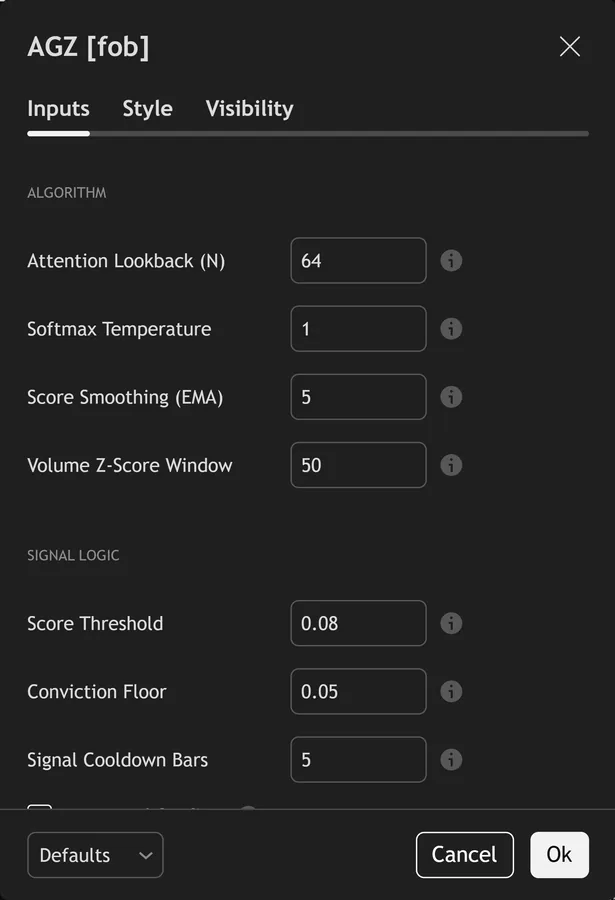
The script exposes 34 inputs, grouped in the settings panel exactly as shown below. Defaults are the published values.
Algorithm
| Setting | What it does | Default | Range |
|---|---|---|---|
| Attention Lookback (N) | How many historical states the attention head compares against the current bar. Larger N = richer memory but slower regime adaptation. | 64 | 16 to 200 |
| Softmax Temperature | Controls attention sharpness. Low temperature = attention collapses onto the few closest analogues (spiky). High temperature = attention spreads across many states (smooth). | 1.0 | 0.1 to 10.0 |
| Score Smoothing (EMA) | EMA length applied to the raw attention forecast to produce the Trend Score. | 5 | 1 to 50 |
| Volume Z-Score Window | Window for the volume mean/stdev used in feature 3 of the state vector. | 50 | 10 to 200 |
Signal Logic
| Setting | What it does | Default | Range |
|---|---|---|---|
| Score Threshold | Trend Score must cross above +threshold (buy) or below -threshold (sell). Units are ATR-normalized expected return. | 0.08 | 0.01 to 1.0 |
| Conviction Floor | Minimum attention conviction (1 – normalized entropy) required for a signal. Keep low/permissive; raise to demand sharply focused attention. | 0.05 | 0.0 to 0.9 |
| Signal Cooldown Bars | Minimum bars between consecutive signals. | 5 | 1 to 100 |
| HTF Trend Confirm | Require price to be on the correct side of a higher-timeframe EMA(21). Uses the last CONFIRMED HTF value (lookahead off, offset 1) — non-repainting. | off | on / off |
| HTF Timeframe | Controls htf timeframe. | 240 |
Prop Firm Rules
| Setting | What it does | Default | Range |
|---|---|---|---|
| Prop Firm Preset | Loads daily-loss and max-drawdown limits for the selected firm. Apex uses a trailing drawdown. Custom reads the three inputs below. | FTMO | FTMO, Topstep, Apex, Custom |
| Account Size $ | Sets the account size $ used in the calculation. | 100000 | |
| Risk per Trade % | Percent of account risked per trade. Presets SUGGEST a value (FTMO 1.0 / Topstep 0.5 / Apex 0.5) but this input always rules. | 1.0 | 0.1 to 5.0 |
| Custom: Daily Loss % | Only used when Preset = Custom. | 4.0 | 0.5 to 20.0 |
| Custom: Max Drawdown % | Only used when Preset = Custom. | 8.0 | 1.0 to 50.0 |
| Custom: Suggested Risk % | Only used when Preset = Custom. Informational — shown on the dashboard. | 1.0 | 0.1 to 5.0 |
| Max Signals / Day | Consistency rule: no further signals after this many in one session day. | 5 | 1 to 50 |
| Lock Signals on Max DD Breach | OFF (default): a max-drawdown breach of the simulated R curve only shows DD BREACH on the dashboard. ON: it also suppresses signals until you reset the indicator. The daily-loss lockout always gates signals and auto-resets each day. | off | on / off |
Sessions & News
| Setting | What it does | Default | Range |
|---|---|---|---|
| Session Filter | Restrict signals to a trading session (exchange timezone of the chart symbol). | Off | Off, London, New York, RTH Futures, Custom |
| Custom Session | Controls custom session. | 0800-1700 | |
| Enable News Blackout | Block signals inside the two news windows below (e.g. CPI 08:30, FOMC 14:00 ET). | off | on / off |
| News Window 1 | Controls news window 1. | 0825-0845 | |
| News Window 2 | Controls news window 2. | 1355-1415 |
Trade Management
| Setting | What it does | Default | Range |
|---|---|---|---|
| Stop Loss (ATR mult) | SL distance = this multiple of ATR(14) from entry. | 1.5 | 0.5 to 10.0 |
| Reward : Risk | TP distance = SL distance x this ratio. Default 2.0 = 1:2 R:R. | 2.0 | 0.5 to 10.0 |
| Trade Line Length (bars) | Sets the trade line length (bars) used in the calculation. | 20 | 5 to 200 |
| Keep Last N Trade Drawings | Sets the keep last n trade drawings used in the calculation. | 3 | 1 to 20 |
Visual
| Setting | What it does | Default | Range |
|---|---|---|---|
| Show Dashboard | Toggles show dashboard on the chart. | on | on / off |
| Show 3-Layer Signal Glow | Toggles show 3-layer signal glow on the chart. | on | on / off |
| Show Trend Baseline Ribbon | Toggles show trend baseline ribbon on the chart. | on | on / off |
| Show Attention Focus Label | Floating label showing WHERE the attention head is looking: the top-3 most similar historical lags, their weights, and the effective sample size. | on | on / off |
| Buy Color | Colour used for buy color. | #4ade80 | |
| Sell Color | Colour used for sell color. | #f472b6 | |
| Accent (Cyan) | Colour used for accent (cyan). | #22d3ee | |
| Entry Line (Gold) | Colour used for entry line (gold). | #fbbf24 |
Alerts built into Argus Gaze: Attention Trend Engine
The script ships 12 alert conditions. Indeed, open the alert dialog on the chart, pick the indicator as the condition source, then choose the event you want. Alerts fire on the close of the bar, so they follow the same confirmed-bar rule the on-chart signals use.
- AGZ Buy
- AGZ Sell
- AGZ Any Signal
- AGZ Regime Bull
- AGZ Regime Bear
- AGZ High Conviction
- AGZ Lockout
- AGZ Session Open
- AGZ Daily Reset
- AGZ Webhook JSON
Other markets and timeframes
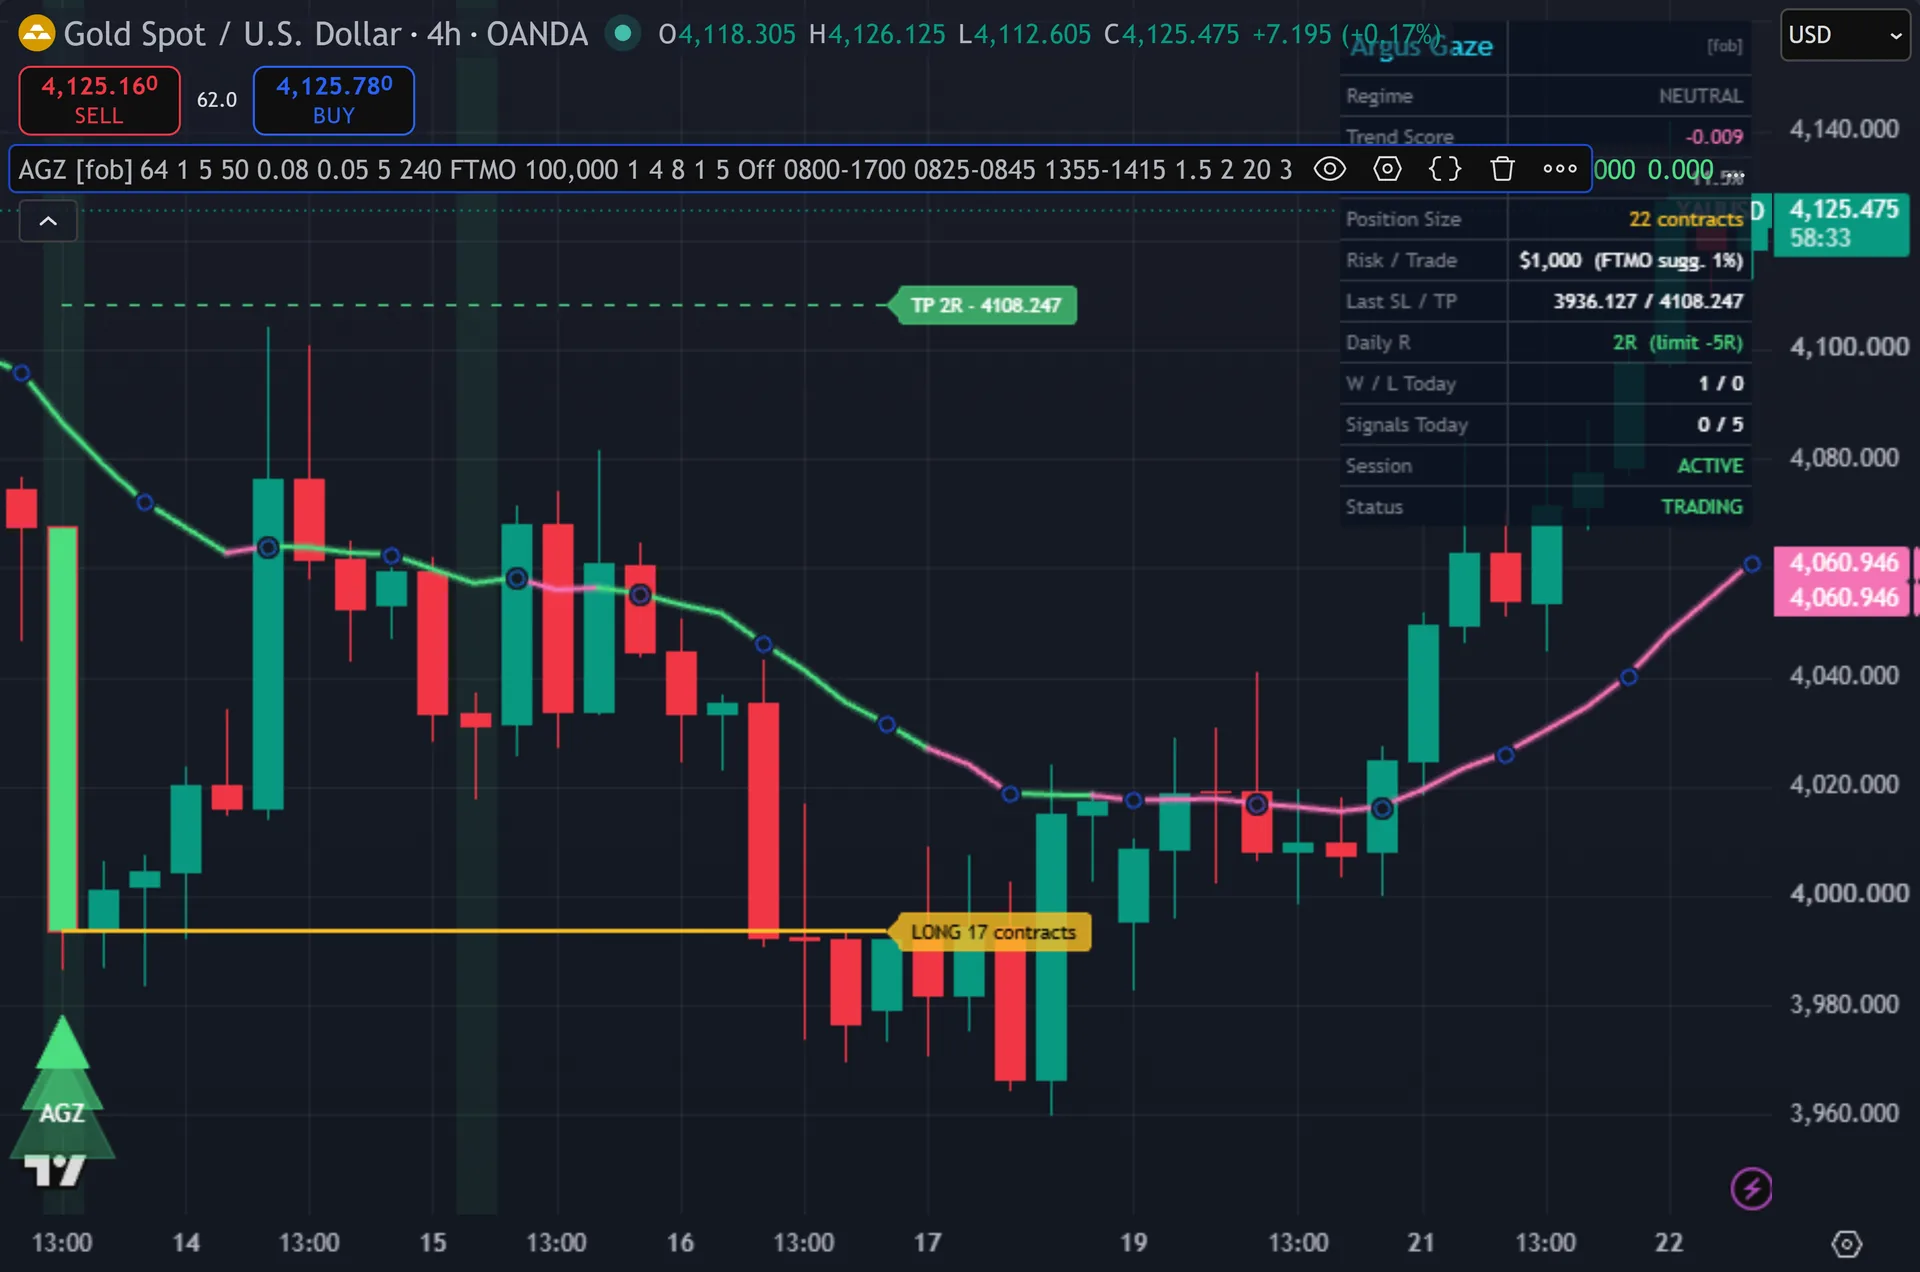
Every input to the forecast stays relative. Still, the features divide by ATR and standardise volume, and the score threshold reads in ATR units, so the defaults carry to gold, indices and crypto without retuning. Two parts do not travel as cleanly. Thus, the volume z-score needs a volume feed, and the position size line uses syminfo.pointvalue, which behaves differently on futures than on spot forex. Session presets follow the exchange clock of the chart symbol, so check them per instrument.
Limitations worth knowing
This places no orders and manages no account. Hence, the stop, target and lot size on screen are suggestions built from your own inputs. The engine sees no spreads, no slippage and no news calendar. Next, the daily R figure and the win-loss count come from its own hypothetical trades at a fixed 1.5 ATR stop, so they describe the indicator, not your broker balance.
The analogue search has a narrow view. Then, it compares three features across 64 lags on the current chart only, so it cannot reach a similar setup from two years back. At lag 1 the outcome it borrows is the current bar’s own move, which already feeds feature one. Yet, attention entropy also stays high at the default temperature, so conviction rarely climbs far above the floor.
Volume drives the third feature. Truly, spot forex volume comes from broker tick counts rather than an exchange, so the z-score shifts between data providers. On symbols with no volume the feature flattens to zero and the state vector loses a dimension. Plainly, the prop firm presets are hard-coded numbers too, not a live rule feed, so check them against your firm’s current terms.
Get Argus Gaze: Attention Trend Engine on TradingView
Open Argus Gaze: Attention Trend Engine on TradingView
If you also trade MetaTrader, the MT4 and MT5 indicator library is available below.
Get the complete indicator library
One email unlocks the full MT4 and MT5 indicator library. Also, this TradingView script stays free on TradingView – the button above adds it to your chart.
Using it alongside MetaTrader
Adding a script on TradingView takes one click, so there is no install step here. Indeed, if you want the same idea on MetaTrader, the MT4 and MT5 indicator installation guide walks through copying files into the data folder and attaching them to a chart. You can also browse the full MetaTrader indicator library, the MT4 indicators section, or the other free TradingView scripts published on this profile. For related chart tools see the MT5 indicators section and the forex trading strategies guides.
External references
- Candlestick pattern on Wikipedia
- ADX at Investopedia
- Candlestick Bearish Reversal Patterns at StockCharts ChartSchool
Frequently asked questions
Does Argus Gaze repaint?
No. Still, both signal booleans require barstate.isconfirmed, and the plotshapes read those same booleans, so a triangle only prints after the bar closes. The optional higher-timeframe filter reads ema21[1] through request.security with lookahead off, so it uses a closed higher-timeframe bar. Thus, the dashboard and the attention label describe the live bar and update while it forms.
Is this really a transformer?
No. Hence, it borrows the softmax attention formula and nothing else. There is no training loop, no learned weight matrix and no network. Next, the query is today’s three features, the keys are the last 64 bar states, and the values are the moves that followed them. A fair description is a softmax-weighted nearest-neighbour forecast.
The score crossed the threshold. Why did no arrow print?
Seven gates can block it: conviction under the floor, the five-bar cooldown, the five-signals-per-day cap, the session window, the news blackout, an active daily lockout, or direction alternation after a same-side signal. Then, the dashboard shows Status, Signals Today and Session, so you can see which one stopped it.
Does it enforce my prop firm rules?
No, it simulates them. Yet, the daily loss lockout and the drawdown reading run on an internal R curve built from the indicator’s own signals at a fixed stop and target. Your firm’s dashboard remains the authority on your real limits. Truly, treat this panel as a discipline prompt, and confirm the preset numbers against your current account terms.
How much should I rely on this indicator?
Treat it as one input, not a decision. Plainly, it is a chart analysis tool, not trading advice. Test it on your own markets and timeframes before relying on it. Results are not guaranteed; past performance is not indicative of future results.

About the author
Written by Dominic Walsh, a Forex trader and MT4/MT5 indicator, Expert Advisor and script developer. Every tool on forexmt4systems.com is tested on live charts before release and ships with ready-to-use compiled MT4 (.ex4) and MT5 (.ex5) files. Learn more about the trader and developer behind this site.
How we build, test and correct every tool: Editorial & Testing Policy. Trading carries risk; see the disclaimer.