
Most trend tools smooth price. This bayesian trend indicator TradingView script counts instead. It tallies how many of the last 30 bars closed higher, then folds that count into a Beta prior. The output is P(up), a plain probability that the next bar closes up. A hysteresis pair at 0.55 and 0.45 locks the regime. Entries then wait for a small pullback back through the 8-period EMA.
It is free and open source. You can add it to any chart from the Bayesian Trend Posterior script page on TradingView, and the full Pine source is published there for you to read.
What Bayesian Trend Posterior plots on the price chart
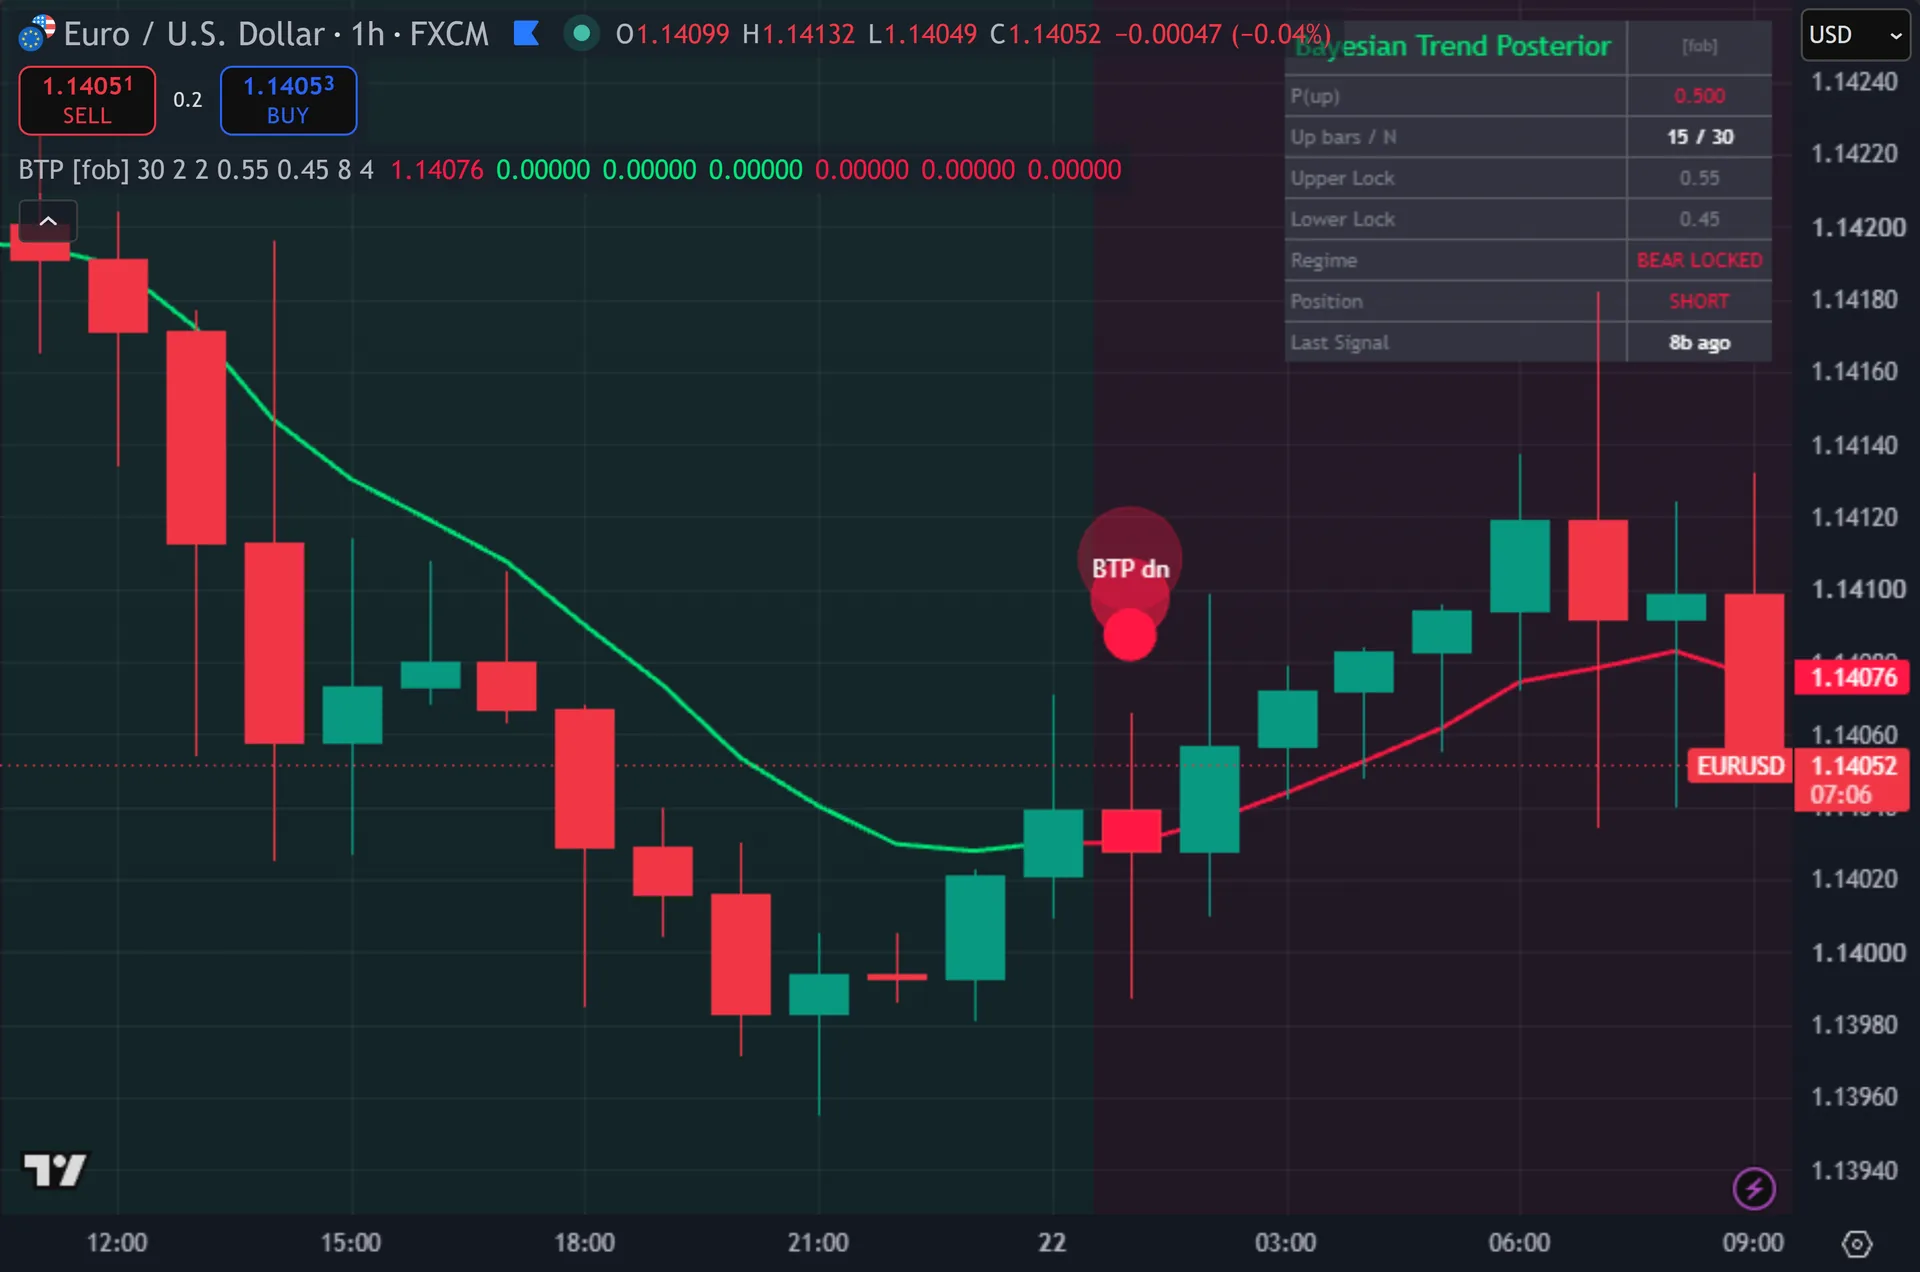
The script draws one line, the 8-period pullback EMA. It paints that line green in a locked bull regime, red in a locked bear regime, and grey while neutral. A faint background tint at 94 percent transparency marks the active regime. Signals print as stacked circles – a huge glow, a large glow, then a solid core – below the bar for buys and above it for sells. The core circle carries the text BTP up or BTP dn. Signal bars change color too. An eight-row dashboard sits top right.

How Bayesian Trend Posterior is built
The Beta-Bernoulli count
The maths starts with a coin-flip view of the tape. Each bar is up or down, nothing more. A loop walks the last N bars, 30 by default, and adds one to upCount whenever close[k] beats close[k+1]. Range, volume and body size never enter the tally. You can set N anywhere from 10 to 100.
A Beta prior turns that raw count into a probability. The posterior mean is (alpha + up) / (alpha + beta + N). Both priors default to 2.0, so the script starts from a neutral 0.5 and adds four pseudo-bars of ballast. Say 18 of the last 30 bars closed up. P(up) then reads (2 + 18) / (2 + 2 + 30), or 0.588.
You can push either prior from 0.5 up to 20.0 in 0.5 steps. A large alpha tilts the reading toward the up side and slows every flip. A large beta does the reverse. Equal priors keep the tool honest and let the window do the work.
Regime lock and pullback trigger
Hysteresis stops the flicker. A posterior at or above 0.55 sets the regime to bull. A posterior at or below 0.45 sets it to bear. Between those two lines the regime simply holds its last value, so a reading that drifts around 0.50 cannot flip the state.
Entries need both a regime and a trigger. The script takes a close crossover of the 8-period EMA inside a bull regime, or a crossunder inside a bear regime. A position flag blocks a second buy until a sell resets it. A four-bar cooldown spaces the arrows out. Every signal also requires barstate.isconfirmed, so circles print at bar close and do not repaint.
Alerts cover eleven cases. Two alert() calls fire JSON payloads with ticker, price and the posterior value. Nine alertcondition entries cover buys, sells, either side, a fresh bull lock, a fresh bear lock, P(up) at or above 0.70, P(up) at or below 0.30, a cross of 0.50, and a webhook template.
How to read the signals
Start at the dashboard. The P(up) row shows the posterior to three decimals, and the row under it shows the raw split, such as 18 / 30. The Regime row reads BULL LOCKED, BEAR LOCKED or NEUTRAL. Read those three rows together. A posterior of 0.588 with a bull lock says the last month of bars leaned up, not that the next bar must rise.
Treat the background tint as context and the circles as the trigger. The tint tells you which side the script allows. The circle tells you a pullback just recovered through the EMA. Signals only appear when both agree, so a locked bull regime with price below the EMA simply waits.
The Position and Last Signal rows track state. Position shows LONG, SHORT or FLAT after the most recent circle. Last Signal counts bars since that circle, which helps you see the four-bar cooldown at work. On noisy intraday charts, widen the window N or push the two lock levels further apart, for example 0.60 and 0.40.
Every Bayesian Trend Posterior setting explained
The script exposes 12 inputs, grouped in the settings panel exactly as shown below. Defaults are the published values.
Bayesian
| Setting | What it does | Default | Range |
|---|---|---|---|
| Posterior Window N | Sets the posterior window n used in the calculation. | 30 | 10 to 100 |
| Prior alpha (Beta) | Beta prior alpha. Higher = more confident in up-bias before seeing data. | 2.0 | 0.5 to 20.0 |
| Prior beta (Beta) | Beta prior beta. Higher = more confident in down-bias before seeing data. | 2.0 | 0.5 to 20.0 |
Signal Logic
| Setting | What it does | Default | Range |
|---|---|---|---|
| Upper Hysteresis (lock bull) | Sets the upper hysteresis (lock bull) used in the calculation. | 0.55 | 0.51 to 0.95 |
| Lower Hysteresis (lock bear) | Sets the lower hysteresis (lock bear) used in the calculation. | 0.45 | 0.05 to 0.49 |
| Pullback EMA Length | Sets the pullback ema length used in the calculation. | 8 | 3 to 50 |
| Cooldown Bars | Sets the cooldown bars used in the calculation. | 4 | 1 to 20 |
Visual
| Setting | What it does | Default | Range |
|---|---|---|---|
| Show Dashboard | Toggles show dashboard on the chart. | on | on / off |
| Show 3-Layer Glow | Toggles show 3-layer glow on the chart. | on | on / off |
| Show Pullback EMA | Toggles show pullback ema on the chart. | on | on / off |
| Buy Color | Colour used for buy color. | #00e676 | |
| Sell Color | Colour used for sell color. | #ff1744 |

Alerts built into Bayesian Trend Posterior
The script ships 11 alert conditions. Open the alert dialog on the chart, pick the indicator as the condition source, then choose the event you want. Alerts fire on the close of the bar, so they follow the same confirmed-bar rule the on-chart signals use.
- BTP Buy
- BTP Sell
- BTP Any Signal
- BTP Bull Lock
- BTP Bear Lock
- BTP High Posterior
- BTP Low Posterior
- BTP Cross 0.5
- BTP Webhook JSON
Other markets and timeframes
Every threshold here is relative. The count is a ratio of bars, the locks are probabilities, and the EMA works on whatever price the chart feeds it. No pip value, tick size or currency amount appears anywhere in the code. So the script runs unchanged on forex, indices, crypto, metals and single stocks. Volume never enters the maths either, which helps on thin symbols. Faster markets flip the posterior more often, so raise N or widen the lock band on one-minute charts.

Limitations worth knowing
This is a lagging counter, and it ignores magnitude. A 200-pip drop counts exactly the same as a two-pip drop. A window of 30 bars also reacts slowly to a sharp turn, so the posterior often confirms a move well after it starts.
Hysteresis cuts both ways. The lock that stops the flicker also holds a stale regime through a range. Price can top out while the regime still reads BULL LOCKED, and EMA crossovers then fire against the newer direction. The four-bar cooldown is short, so a choppy stretch can still produce several circles.
The tool plots entries only. It sets no stop, no target and no position size, and it never calls request.security, so it reads a single timeframe. Judge it as one input among several. Past performance does not predict future results.
Get Bayesian Trend Posterior on TradingView
Open Bayesian Trend Posterior on TradingView
If you also trade MetaTrader, the MT4 and MT5 indicator library is available below.
Get the complete indicator library
One email unlocks the full MT4 and MT5 indicator library. This TradingView script stays free on TradingView – the button above adds it to your chart.
Using it alongside MetaTrader
Adding a script on TradingView takes one click, so there is no install step here. If you want the same idea on MetaTrader, the MT4 and MT5 indicator installation guide walks through copying files into the data folder and attaching them to a chart. You can also browse the full MetaTrader indicator library, the MT4 indicators section, or the other free TradingView scripts published on this profile. For related chart tools see the MT5 indicators section and the forex trading strategies guides.
External references
Frequently asked questions
Does the Bayesian Trend Posterior repaint?
No. Both the buy and the sell condition require barstate.isconfirmed, so a circle only prints once the bar closes. The posterior itself updates live during the forming bar, which is normal for any rolling calculation.
What does P(up) actually mean?
It is the posterior mean of a Beta-Bernoulli model, so it estimates the chance that the next bar closes above the current one. With the default 30-bar window and 2.0 priors, a value of 0.588 means 18 of the last 30 bars closed up. It measures direction only, never size.
Which settings should I change first?
Change Posterior Window N first. Lower values near 10 react quickly and flip often. Values near 100 read slow, broad trends. After that, adjust the two hysteresis levels. Moving them to 0.60 and 0.40 makes the regime harder to lock and cuts the signal count.
Does it work on every timeframe?
Yes, the maths is timeframe agnostic. Higher timeframes give fewer and cleaner locks. On M1 and M5 the posterior swings faster, so most traders raise the window and the cooldown there. Test any setting on your own chart before you rely on it.
How much should I rely on this indicator?
Treat it as one input, not a decision. It is a chart analysis tool, not trading advice. Test it on your own markets and timeframes before relying on it. Results are not guaranteed; past performance is not indicative of future results.

About the author
Written by Dominic Walsh, a Forex trader and MT4/MT5 indicator, Expert Advisor and script developer. Every tool on forexmt4systems.com is tested on live charts before release and ships with ready-to-use compiled MT4 (.ex4) and MT5 (.ex5) files. Learn more about the trader and developer behind this site.
How we build, test and correct every tool: Editorial & Testing Policy. Trading carries risk; see the disclaimer.