
Big candles are not all the same. Some come from steady drift. Others come from a discontinuous jump. Also, bipower Jump Detector works as a price spike indicator TradingView traders can run in a pane under any chart. It splits recent variance into a smooth part and a jump part, then scores the gap with a z-statistic. Indeed, only bars whose Jump-Z clears 1.96 count as a real spike.
It is free and open source. Still, you can add it to any chart from the Bipower Jump Detector script page on TradingView, and the full Pine source is published there for you to read.
What Bipower Jump Detector plots in a separate pane below price
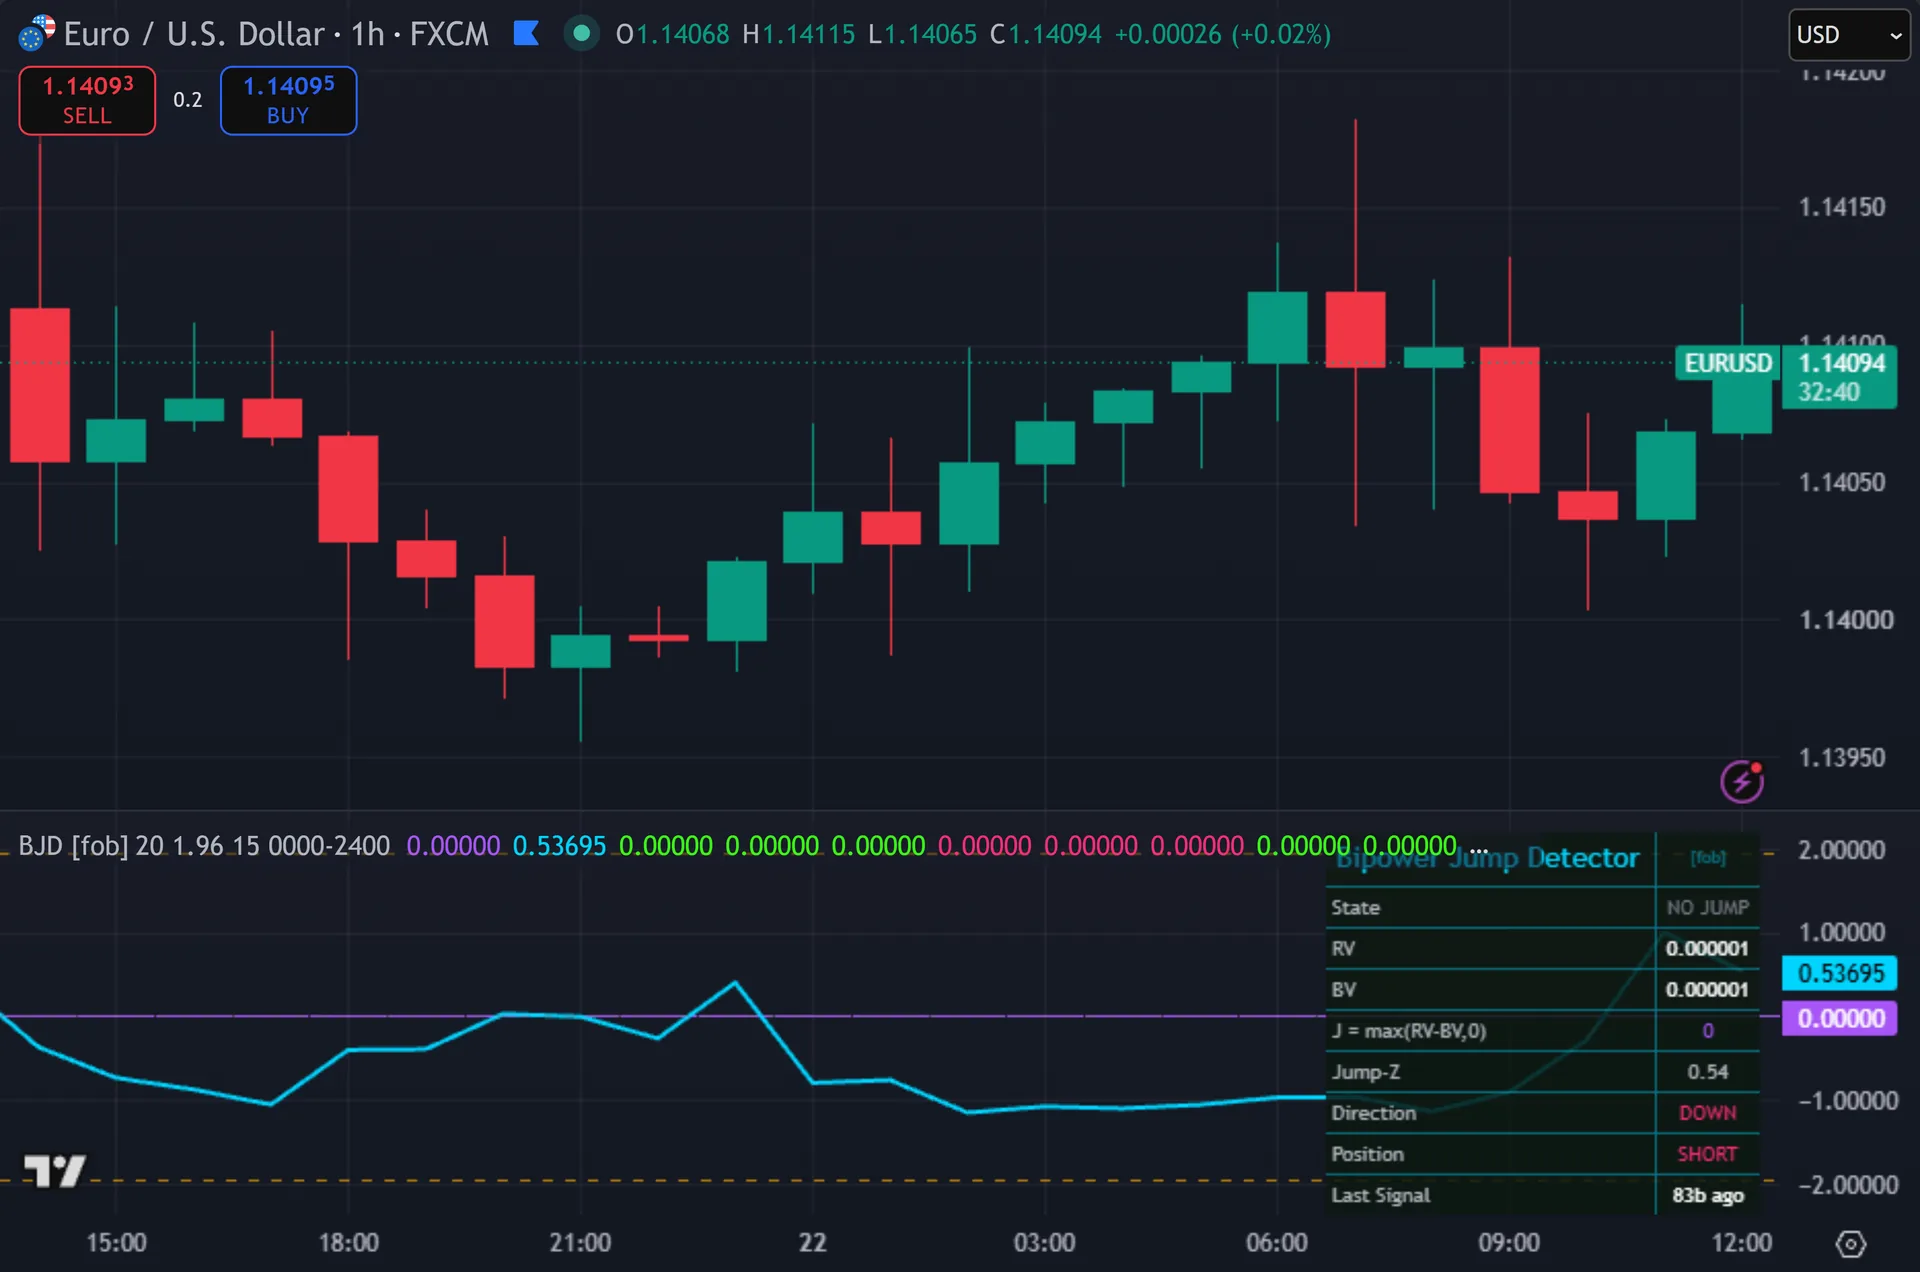
The script runs in its own pane below price, not on the candles. Thus, it plots two series: purple columns for the jump component J, and a cyan Jump-Z line. Three horizontal levels mark plus and minus your threshold and zero. Hence, the pane tints purple when Jump-Z clears the cutoff, and a vertical line marks the jump bar. Diamonds print at the pane edges on entries, and Pine v6 force_overlay mirrors those same signals as triangles on the price chart. Next, a nine-row dashboard reports RV, BV, J, Jump-Z, direction and position.

How Bipower Jump Detector is built
Splitting variance into diffusion and jumps
The script starts with log returns, r = log(close / close[1]). Then, it squares each return and sums the last 20 of them. That sum is realized variance, or RV. Yet, RV counts everything in the window: quiet drift and violent gaps alike.
Bipower variation, BV, works differently. Truly, the script multiplies each absolute return by the absolute return before it. It sums those 20 products, then scales the total by pi/2. Plainly, one huge return only enters a single product, paired with a normal-sized neighbour. So a lone jump barely moves BV. Also, RV squares that same return and lifts hard. Barndorff-Nielsen and Shephard built their jump test on exactly this asymmetry.
The jump component follows: J = max(RV – BV, 0). The clamp at zero matters. Sampling noise can push BV above RV during quiet stretches, and negative jump energy would mean nothing.
The Jump-Z test and trade direction
A raw difference tells you little without a scale. So the script standardises it. Jump-Z = sqrt(20) x (RV – BV) / sqrt(theta x BV^2 x 0.5), where theta = pi^2/4 + pi – 5, about 0.6090. Indeed, that constant comes from the asymptotic theory behind the test. The extra 0.5 factor is a scaling choice in this build, not the textbook constant. Still, read Jump-Z as a proportional test statistic, then, rather than an exact p-value.
The default cutoff sits at 1.96, the two-sided 95 percent normal quantile. Thus, raise it toward 2.58 for a stricter read, or drop it to 1.0 for more candidates. The input caps at 4.0.
Direction comes from a loop, not from the current candle. Hence, the script scans the last 20 returns and keeps the one with the largest absolute size. That return’s sign sets the trade side. Three more gates then apply. The bar must close, since every signal reads barstate.isconfirmed. Next, fifteen cooldown bars must have passed. And the internal position state must not already sit on that side. Then, an optional session window narrows things further.
How to read the signals
Read the two series together. Yet, the purple columns show how much jump energy sits in the window. The cyan line shows whether that energy looks statistically unusual. Truly, columns can run tall while Jump-Z stays low, which simply means the whole window turned volatile.
Watch the RV and BV rows in the dashboard. Plainly, when RV runs well above BV, discontinuous moves dominate. When the two sit close together, price is drifting smoothly and the tool stays quiet. Also, that distinction is the real output here. The diamonds are a convenience layer on top of it.
Direction lags by design. Indeed, the largest return in the 20-bar window may have printed several bars ago, so a signal can point the way of a move that already ran. Treat the diamond as a flag that a jump regime is active, then use your own structure read for the entry.
Every Bipower Jump Detector setting explained
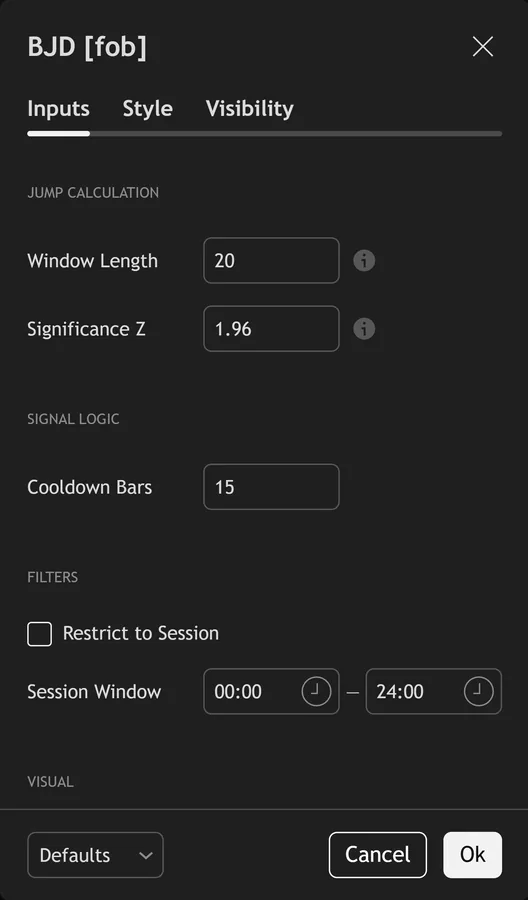
The script exposes 13 inputs, grouped in the settings panel exactly as shown below. Defaults are the published values.
Jump Calculation
| Setting | What it does | Default | Range |
|---|---|---|---|
| Window Length | Bars used for RV and BV. Must be at least 5. | 20 | 5 to 200 |
| Significance Z | One-sided test cutoff. 1.96 ~ 95%, 2.58 ~ 99%. | 1.96 | 1.0 to 4.0 |
Signal Logic
| Setting | What it does | Default | Range |
|---|---|---|---|
| Cooldown Bars | Sets the cooldown bars used in the calculation. | 15 | 1 to 60 |
Filters
| Setting | What it does | Default | Range |
|---|---|---|---|
| Restrict to Session | Toggles restrict to session on the chart. | off | on / off |
| Session Window | Controls session window. | 0000-2400 |
Visual
| Setting | What it does | Default | Range |
|---|---|---|---|
| Show Dashboard | Toggles show dashboard on the chart. | on | on / off |
| Show 3-Layer Glow | Toggles show 3-layer glow on the chart. | on | on / off |
| Show Jump Markers | Toggles show jump markers on the chart. | on | on / off |
| Buy Color | Colour used for buy color. | #39ff14 | |
| Sell Color | Colour used for sell color. | #ff2d78 | |
| Jump Component | Colour used for jump component. | #a855f7 | |
| Jump-Z Line | Colour used for jump-z line. | #00d4ff | |
| Dashboard BG | Colour used for dashboard bg. | color.new(#0c1810, 16) |
Alerts built into Bipower Jump Detector
The script ships 13 alert conditions. Still, open the alert dialog on the chart, pick the indicator as the condition source, then choose the event you want. Alerts fire on the close of the bar, so they follow the same confirmed-bar rule the on-chart signals use.
- BJD Buy
- BJD Sell
- BJD Any Signal
- BJD Significant
- BJD Jump Up
- BJD Jump Down
- BJD Z Rising
- BJD J Rising
- BJD High Jump Ratio
- BJD Quiet Diffusion
- BJD Webhook JSON
Other markets and timeframes
Nothing here ties to forex. Thus, log returns strip out price scale, so a 1.2 percent move in gold and a 1.2 percent move in EURUSD feed the same number. Jump-Z carries no units either, and 1.96 means the same thing on crypto, indices and equities. Hence, the script reads no volume at all, so instruments without a volume feed work fine. Only the window and the cooldown deserve a second look, since fast intraday charts throw far more candidates than a daily chart.

Limitations worth knowing
It detects jumps. Next, it does not forecast them, and it says nothing about what follows one. There is no stop logic, no target, no position sizing, and no trend filter beyond the sign of the largest recent return.
The statistic is a window measure, so it decays with the window. Then, a jump stays inside RV for 20 bars, which keeps Jump-Z elevated well after the event and can hold the background tint on for a stretch. The 15-bar cooldown limits repeat entries but does not sharpen the timing.
Signals confirm on bar close, so a diamond lands at the open of the next candle. Also, the Jump-Z line and the pane tint both update inside the live bar, because bgcolor reads the raw significance flag rather than the confirmed one. The line can cross the threshold and then fall back before the candle closes.
Get Bipower Jump Detector on TradingView
Open Bipower Jump Detector on TradingView
If you also trade MetaTrader, the MT4 and MT5 indicator library is available below.
Get the complete indicator library
One email unlocks the full MT4 and MT5 indicator library. Yet, this TradingView script stays free on TradingView – the button above adds it to your chart.
Using it alongside MetaTrader
Adding a script on TradingView takes one click, so there is no install step here. Truly, if you want the same idea on MetaTrader, the MT4 and MT5 indicator installation guide walks through copying files into the data folder and attaching them to a chart. You can also browse the full MetaTrader indicator library, the MT4 indicators section, or the other free TradingView scripts published on this profile. For related chart tools see the MT5 indicators section and the forex trading strategies guides.
External references
- Price action trading on Wikipedia
- Stochastic Oscillator at Investopedia
- Raff Regression Channel at StockCharts ChartSchool
Frequently asked questions
Does the Bipower Jump Detector repaint?
The signals do not. Plainly, both entry flags include barstate.isconfirmed, so the diamonds, the price-pane triangles and the bar colouring stay put once printed. The plotted Jump-Z line and the purple pane tint do move within the forming bar, since they read the live value. Also, that is normal for any oscillator.
What does a Jump-Z of 2.4 mean?
It means realized variance sits far enough above bipower variation that ordinary diffusion struggles to explain the window. Indeed, the reading clears the 1.96 default by a clear margin. It is a measure of statistical unusualness, not the odds that a trade works.
Why did a huge candle produce no signal?
Four gates can block it. Still, jump-Z may sit under your threshold, which happens when the window was already volatile and one more big bar barely shifts the ratio. The 15-bar cooldown may still be running. Thus, the position state may already sit on that side. Or the session filter is on and the bar fell outside the window.
Is it multi-timeframe?
No. Hence, there is no request.security call anywhere in the script. Every value comes from the chart timeframe you have open. For a higher-timeframe read, add the indicator to a second chart at that resolution.
How much should I rely on this indicator?
Treat it as one input, not a decision. Next, it is a chart analysis tool, not trading advice. Test it on your own markets and timeframes before relying on it. Results are not guaranteed; past performance is not indicative of future results.

About the author
Written by Dominic Walsh, a Forex trader and MT4/MT5 indicator, Expert Advisor and script developer. Every tool on forexmt4systems.com is tested on live charts before release and ships with ready-to-use compiled MT4 (.ex4) and MT5 (.ex5) files. Learn more about the trader and developer behind this site.
How we build, test and correct every tool: Editorial & Testing Policy. Trading carries risk; see the disclaimer.