
Traders eyeball a big candle and call it significant. Also, bootstrap Confidence Break is a confidence interval indicator TradingView users can run to put a number on that instead. It builds a 90 percent band around the mean of the last 40 bar returns, checks whether the current bar’s return falls outside it, then waits for a close cross of an 8-period EMA in the same direction before it prints anything.
It is free and open source. Indeed, you can add it to any chart from the Bootstrap Confidence Break script page on TradingView, and the full Pine source is published there for you to read.
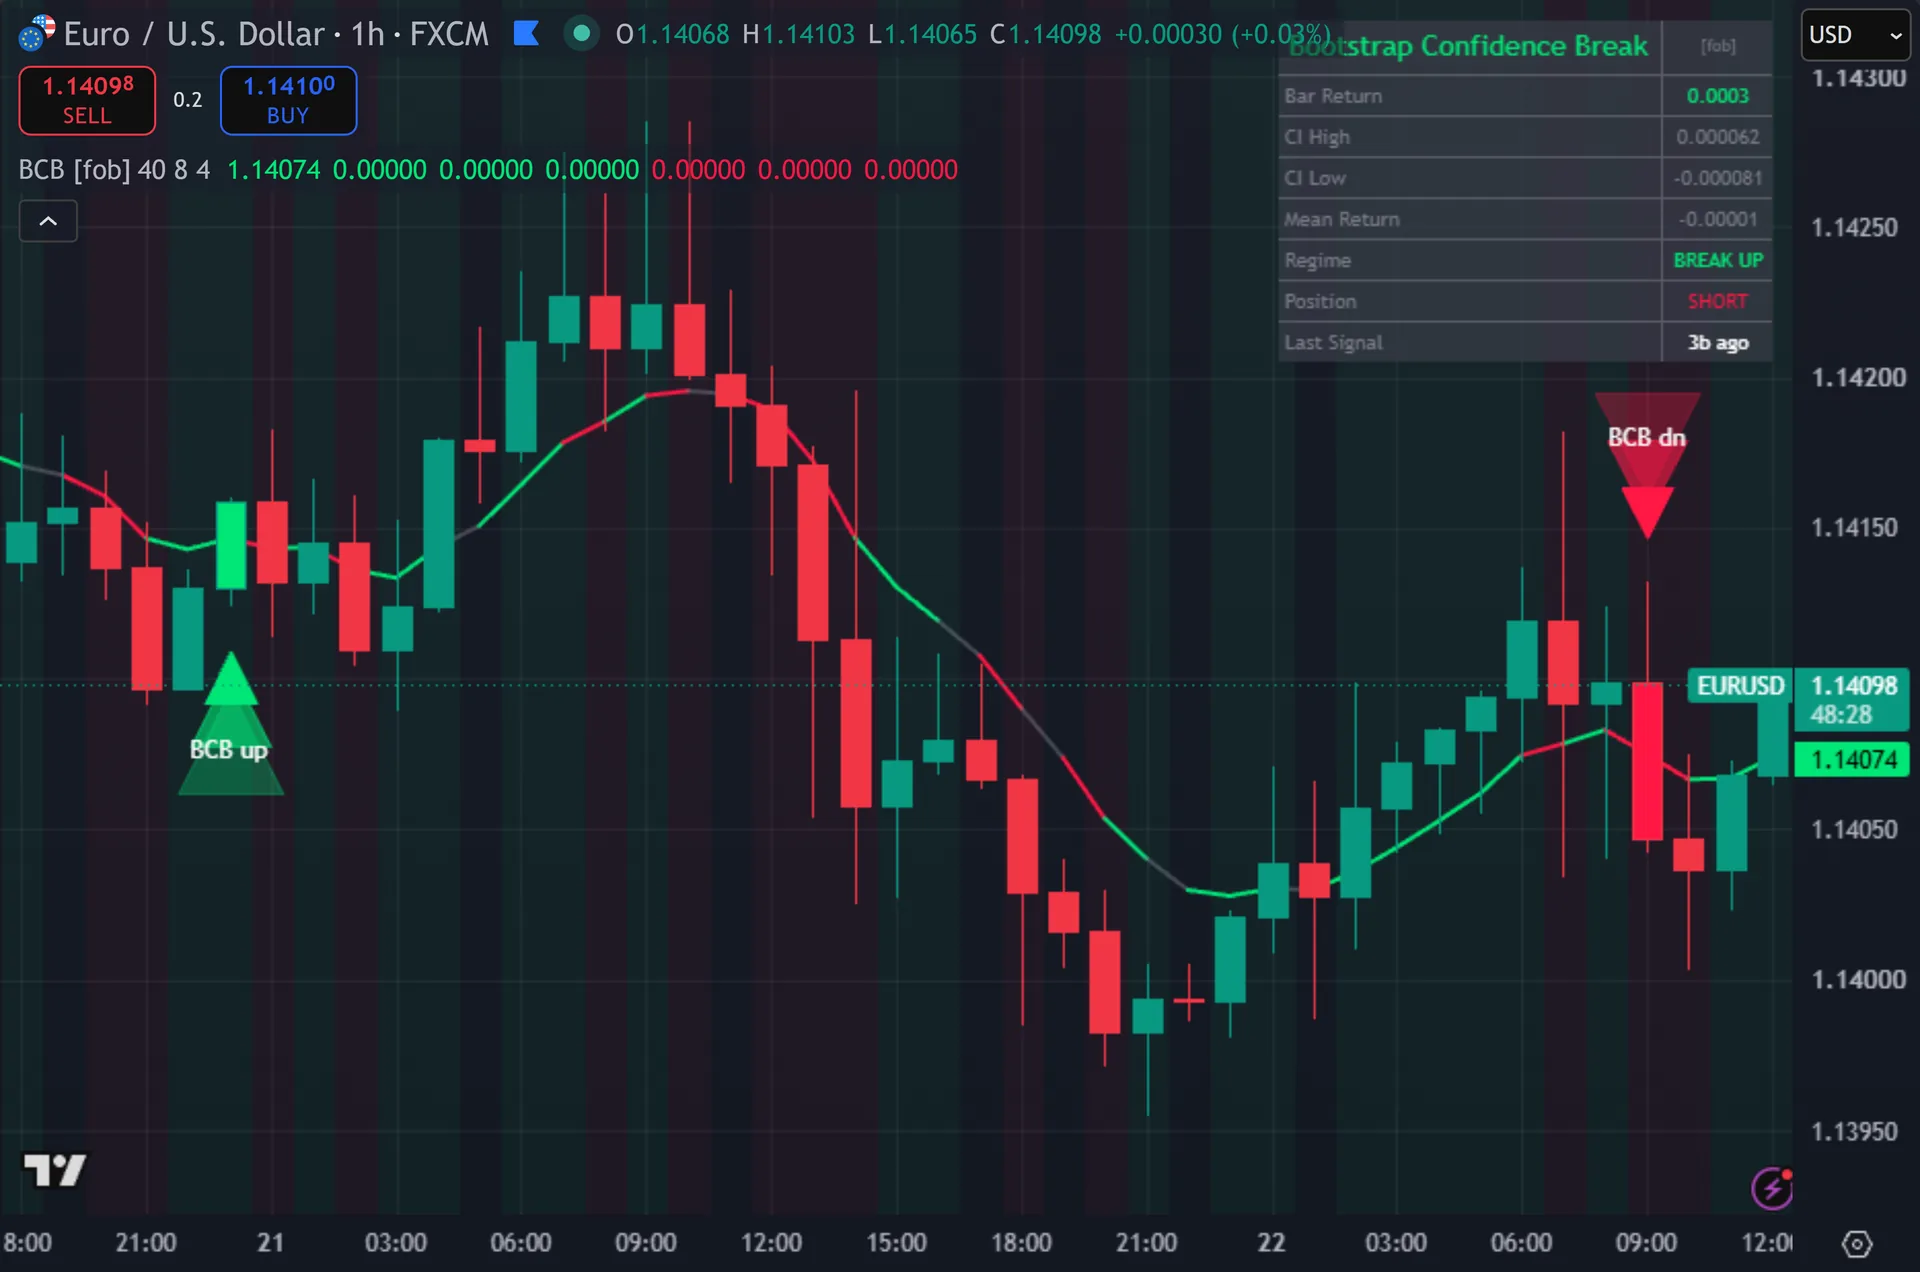
What Bootstrap Confidence Break plots on the price chart
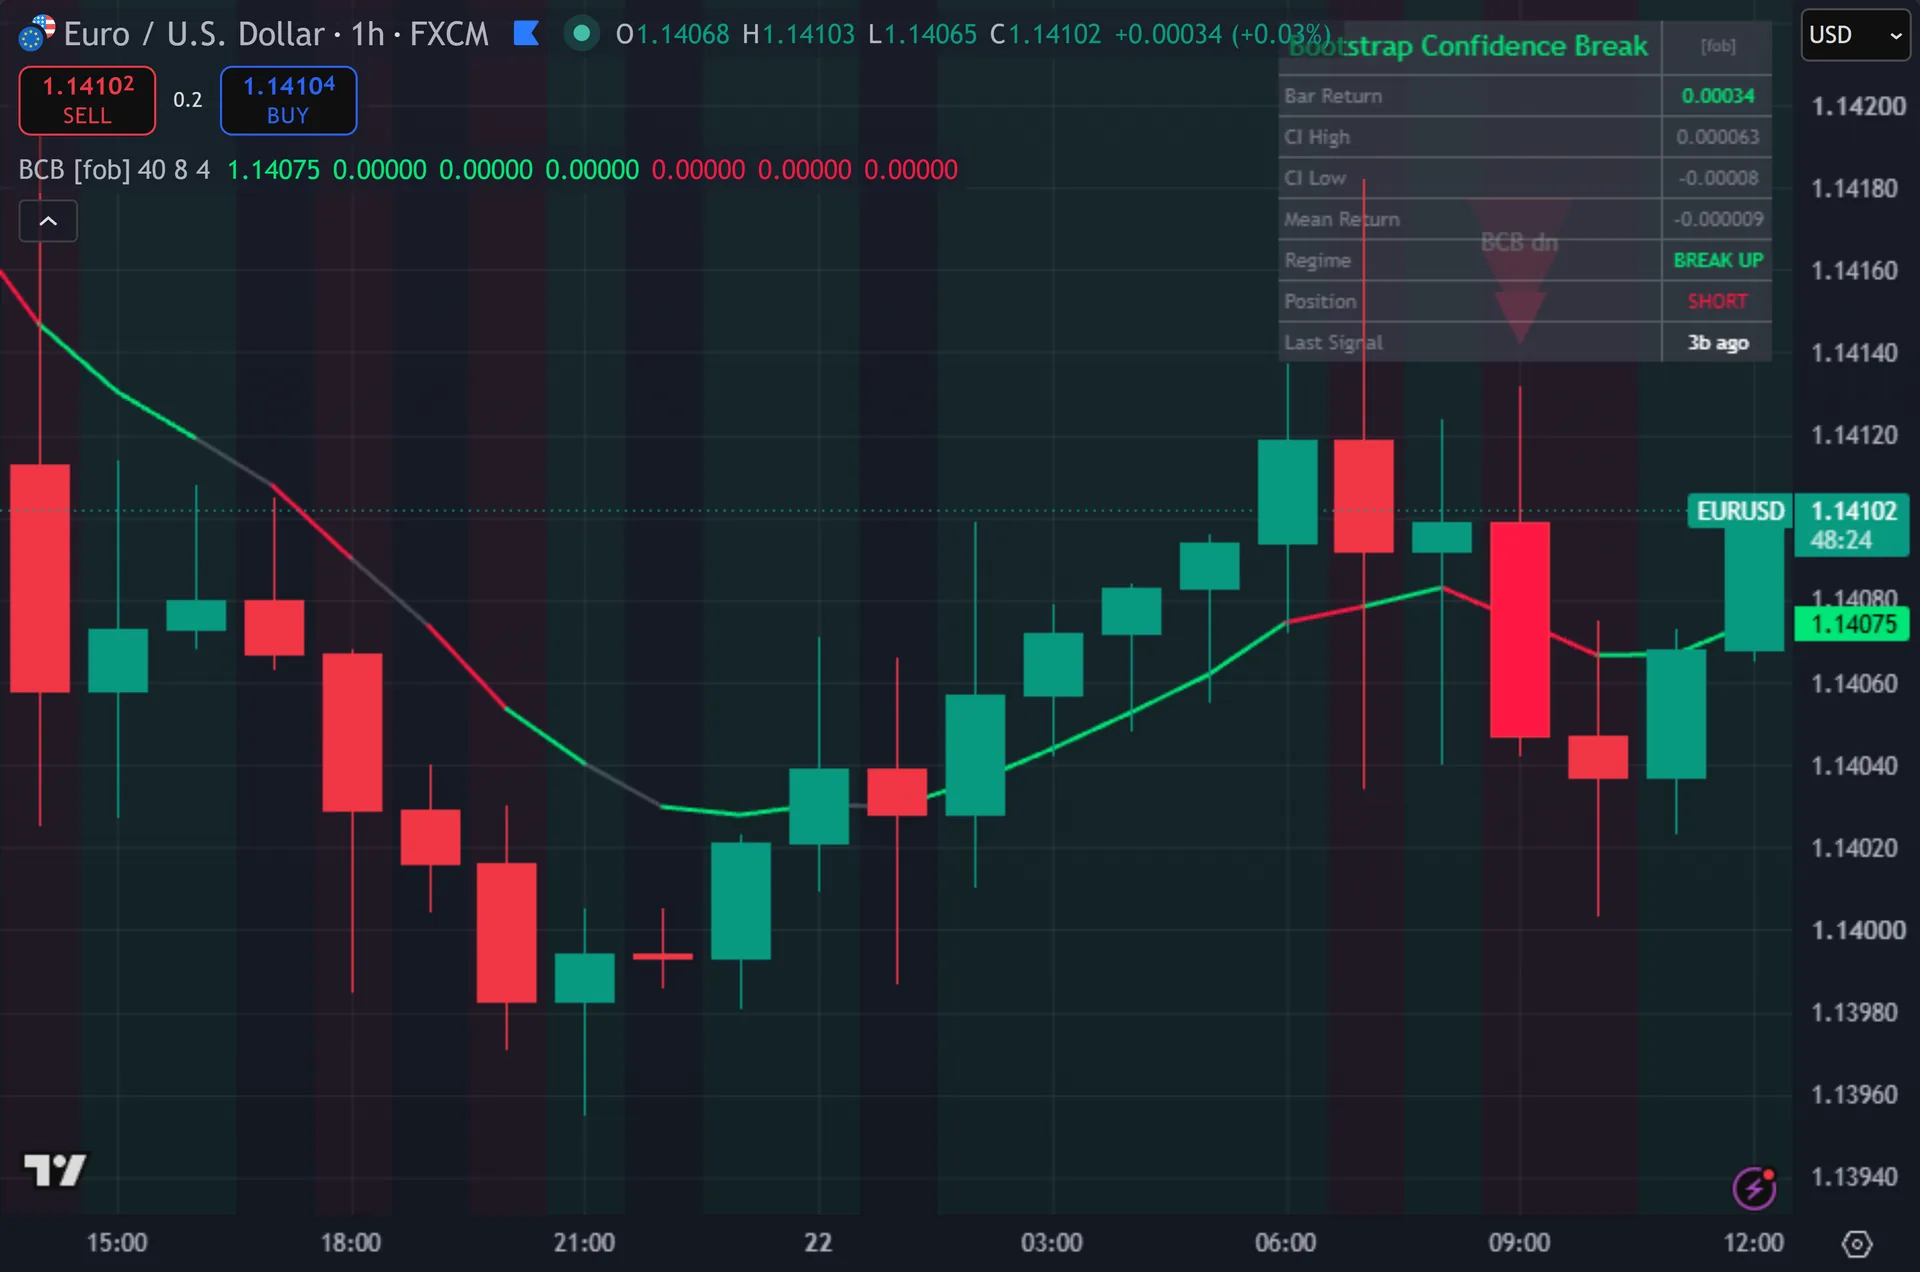
One line plots: the 8-period pullback EMA. Still, it turns green while the current return sits above the band, red while it sits below, and grey the rest of the time. Signals print as triangles below or above the bar, stacked in three sizes for a glow and labelled BCB up or BCB dn. Signal bars get recoloured. The background carries a very faint directional tint whenever the return sits outside the band. Thus, an eight-row dashboard reports the bar return, both bounds, the mean return, a regime word and position.
How Bootstrap Confidence Break is built
What the interval actually is
Start with the honest part. Hence, the script header describes 200 deterministic resamples and a 5th to 95th percentile of the resampled means. The code does no resampling. Next, it computes a normal-approximation interval instead: the 40-bar mean of returns, plus and minus 1.645 times the standard error. Standard error here is the 40-bar standard deviation divided by the square root of 40.
So the band is parametric, not distribution free. Then, the value 1.645 is the two-sided 90 percent normal critical value, and the arithmetic is textbook. Just do not expect true bootstrap behaviour on fat-tailed returns. Yet, the interval assumes the mean of 40 returns is roughly normal, which is reasonable, yet it is not the same claim the name makes.
The returns themselves are simple price differences, close minus the previous close, rather than log or percentage returns. Truly, that keeps every value in chart units, which is why the dashboard prints the bounds to six decimal places.
Why the band sits so tight
Dividing by the square root of 40 shrinks the band hard. Plainly, the half width works out at 1.645 divided by 6.32, which is roughly 0.26 standard deviations. So a bar whose return clears the mean by about a quarter of one standard deviation already counts as outside. Also, this is a confidence interval for the mean return, not a prediction interval for a single bar, and plenty of ordinary bars clear it.
Treat the band as a mild directional bias then, not a rare-event marker. Indeed, real filtering happens further down the chain. Close must cross the 8-period EMA in the matching direction on the same bar. Still, signals must alternate long and short. At least 4 bars must pass since the last one. Thus, and barstate.isconfirmed must be true, so triangles land on closed bars only.
The alert list holds a stricter test if you want one. Hence, the 2-Sigma alert fires when the absolute bar return exceeds twice the 40-bar standard deviation. That is a genuinely uncommon bar, far rarer than a simple band break, and it makes a better regime warning than an entry trigger.
How to read the signals
Read the EMA colour first. Next, green says the current return sits above the band, red says below, grey says inside. That colour is the statistical state. Then, the triangle is only the timed entry, which arrives when close crosses that same EMA in the matching direction.
Use the dashboard numbers for context. Yet, compare Bar Return against CI High and CI Low directly. Because the band tracks the rolling mean, a strong uptrend lifts the mean, so an up-break then has to clear a higher bar than it would in a flat market.
Triangles need a closed bar, so you act at the next open. Truly, the background tint and the EMA colour both follow the forming bar, so they can flip mid-candle. Watch what the colour reads at the close, not what it flashed halfway through.
Every Bootstrap Confidence Break setting explained
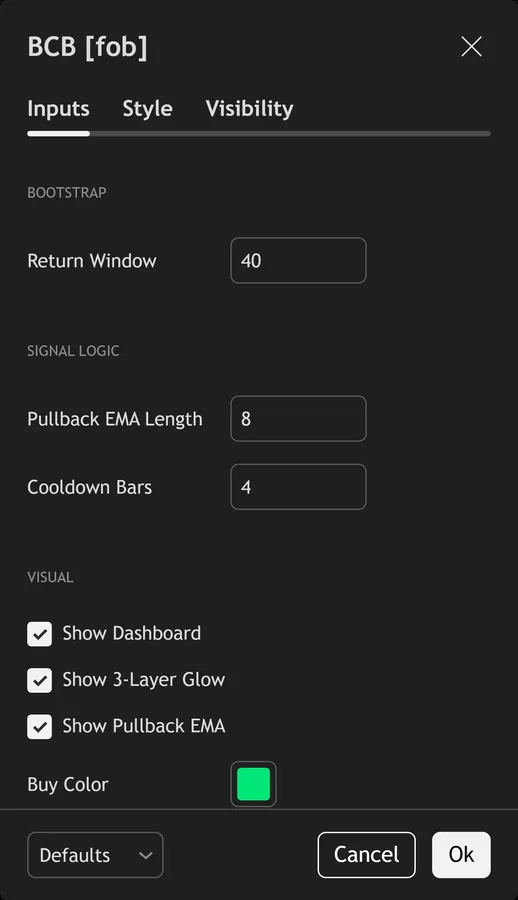
The script exposes 8 inputs, grouped in the settings panel exactly as shown below. Defaults are the published values.
Bootstrap
| Setting | What it does | Default | Range |
|---|---|---|---|
| Return Window | Sets the return window used in the calculation. | 40 | 20 to 100 |
Signal Logic
| Setting | What it does | Default | Range |
|---|---|---|---|
| Pullback EMA Length | Sets the pullback ema length used in the calculation. | 8 | 3 to 50 |
| Cooldown Bars | Sets the cooldown bars used in the calculation. | 4 | 1 to 20 |
Visual
| Setting | What it does | Default | Range |
|---|---|---|---|
| Show Dashboard | Toggles show dashboard on the chart. | on | on / off |
| Show 3-Layer Glow | Toggles show 3-layer glow on the chart. | on | on / off |
| Show Pullback EMA | Toggles show pullback ema on the chart. | on | on / off |
| Buy Color | Colour used for buy color. | #00e676 | |
| Sell Color | Colour used for sell color. | #ff1744 |
Alerts built into Bootstrap Confidence Break
The script ships 11 alert conditions. Plainly, open the alert dialog on the chart, pick the indicator as the condition source, then choose the event you want. Alerts fire on the close of the bar, so they follow the same confirmed-bar rule the on-chart signals use.
- BCB Buy
- BCB Sell
- BCB Any Signal
- BCB Outside Up
- BCB Outside Down
- BCB EMA Up
- BCB EMA Down
- BCB 2-Sigma
- BCB Webhook JSON
Other markets and timeframes
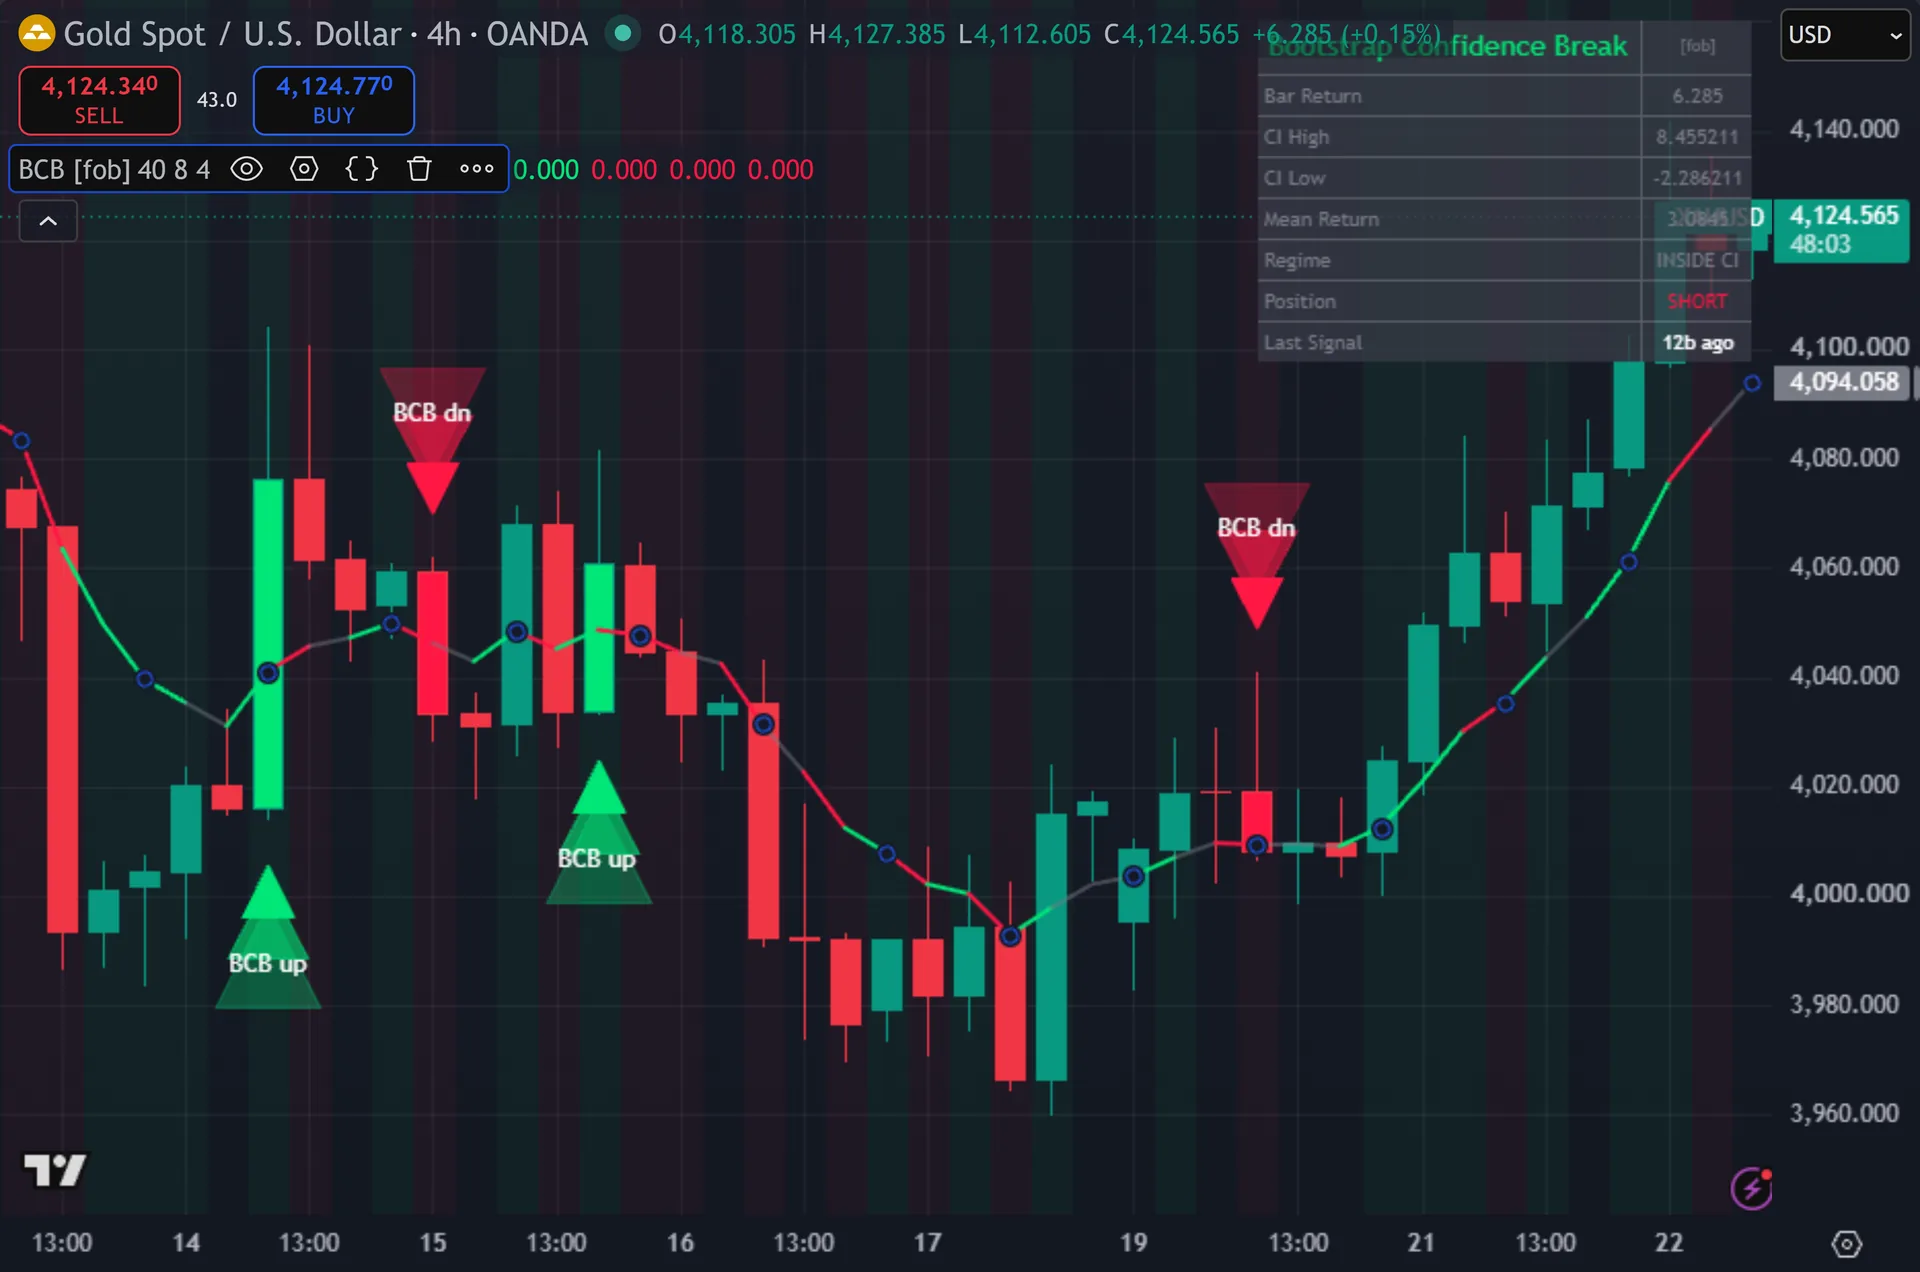
Every number in the calculation is relative to the instrument’s own returns, so the tool is market agnostic. Also, the mean, the deviation and the interval all rescale automatically on gold, indices, crypto or stocks. Volume never enters the maths, so no data feed problem arises. Indeed, the one caveat is that price differences drive the calculation rather than percentage returns. The printed bounds therefore cannot be compared across two instruments with different price scales.
Limitations worth knowing
This flags an unusual bar and times a cross. Still, it is not a trading system. There is no stop logic, no target logic and no sizing. Thus, it also carries no view on trend or structure, so a statistically large bar inside a range gets the same treatment as one breaking a level.
The name oversells the maths. Hence, no bootstrap resampling happens anywhere in the code. The band is a normal-approximation confidence interval for the mean, so anyone expecting distribution-free behaviour on fat-tailed data should know exactly what they are reading.
Because the band is tight, sitting outside it is common rather than rare, and most of the filtering falls to the EMA cross and the cooldown. Next, the 40-bar window also leaves the first 40 bars of a chart unusable, and the 4-bar cooldown blocks a valid second signal that arrives soon after the first.
Get Bootstrap Confidence Break on TradingView
Open Bootstrap Confidence Break on TradingView
If you also trade MetaTrader, the MT4 and MT5 indicator library is available below.
Get the complete indicator library
One email unlocks the full MT4 and MT5 indicator library. Then, this TradingView script stays free on TradingView – the button above adds it to your chart.
Using it alongside MetaTrader
Adding a script on TradingView takes one click, so there is no install step here. Yet, if you want the same idea on MetaTrader, the MT4 and MT5 indicator installation guide walks through copying files into the data folder and attaching them to a chart. You can also browse the full MetaTrader indicator library, the MT4 indicators section, or the other free TradingView scripts published on this profile. For related chart tools see the MT5 indicators section and the forex trading strategies guides.
External references
- Stochastic oscillator on Wikipedia
- Stochastic Oscillator at Investopedia
- Raff Regression Channel at StockCharts ChartSchool
Frequently asked questions
Does the Bootstrap Confidence Break repaint?
The triangles do not. Truly, each signal checks barstate.isconfirmed, so a marker prints only once the bar has closed. The EMA colour, the background tint and the dashboard values all track the live bar, so those can change until the candle closes.
Does it really run a bootstrap?
No. Plainly, the code computes the 40-bar mean of returns plus and minus 1.645 times the standard error, which is a normal-approximation 90 percent interval for the mean. No resampling takes place, so the band is parametric rather than distribution free.
What does the number 1.645 mean?
It is the two-sided 90 percent critical value from the normal distribution. Also, multiplying it by the standard error, which is the 40-bar deviation divided by the square root of 40, sets the half width of the band around the mean return.
How do I make the signals rarer?
Raise Cooldown Bars above 4 to space marks further apart, and lengthen the Pullback EMA so fewer crosses qualify. For a much stricter filter, build your alert on the 2-Sigma condition instead, which needs an absolute return above twice the 40-bar deviation.
How much should I rely on this indicator?
Treat it as one input, not a decision. Indeed, it is a chart analysis tool, not trading advice. Test it on your own markets and timeframes before relying on it. Results are not guaranteed; past performance is not indicative of future results.

About the author
Written by Dominic Walsh, a Forex trader and MT4/MT5 indicator, Expert Advisor and script developer. Every tool on forexmt4systems.com is tested on live charts before release and ships with ready-to-use compiled MT4 (.ex4) and MT5 (.ex5) files. Learn more about the trader and developer behind this site.
How we build, test and correct every tool: Editorial & Testing Policy. Trading carries risk; see the disclaimer.